
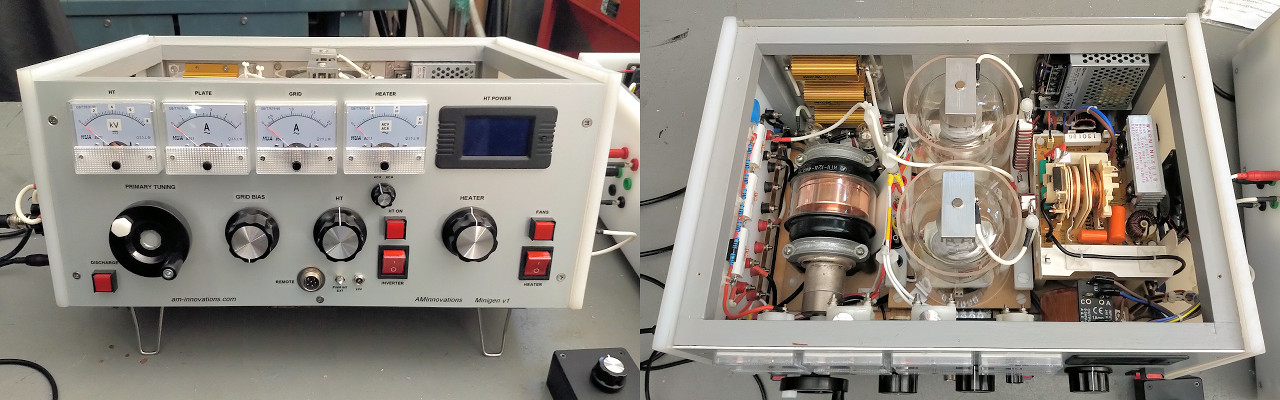
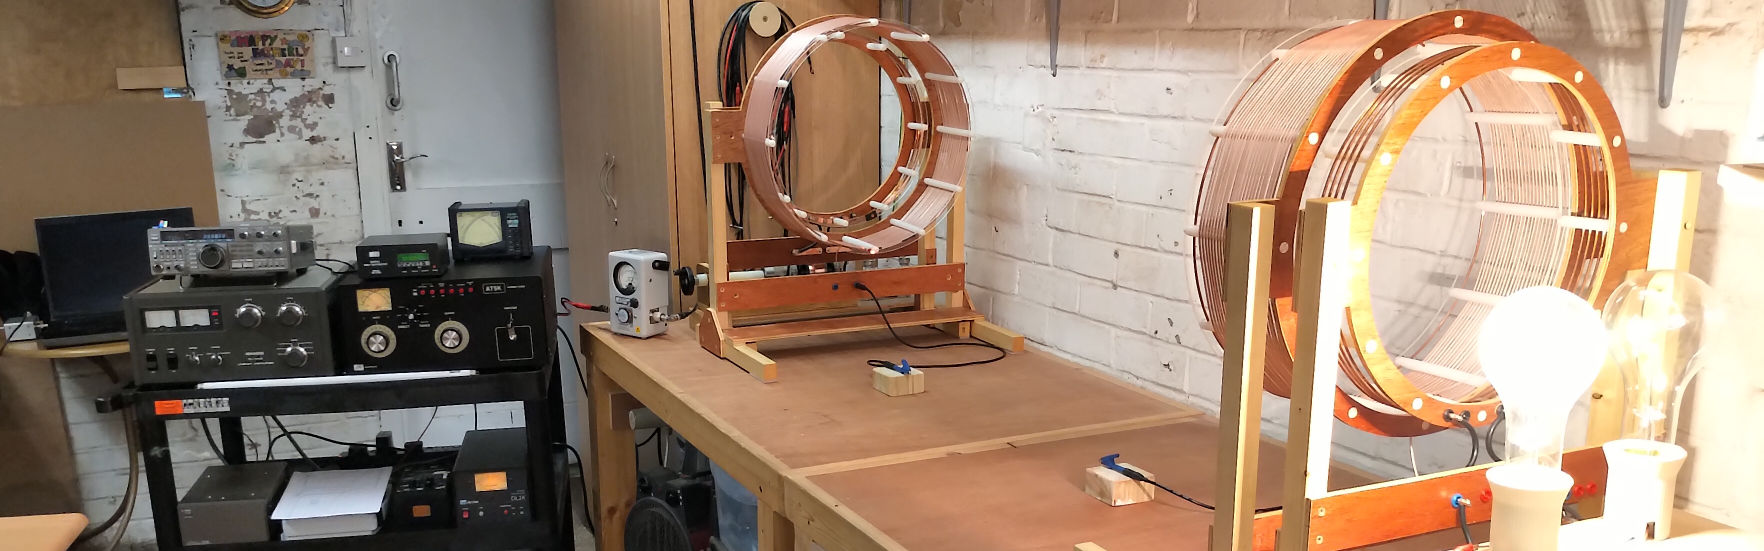
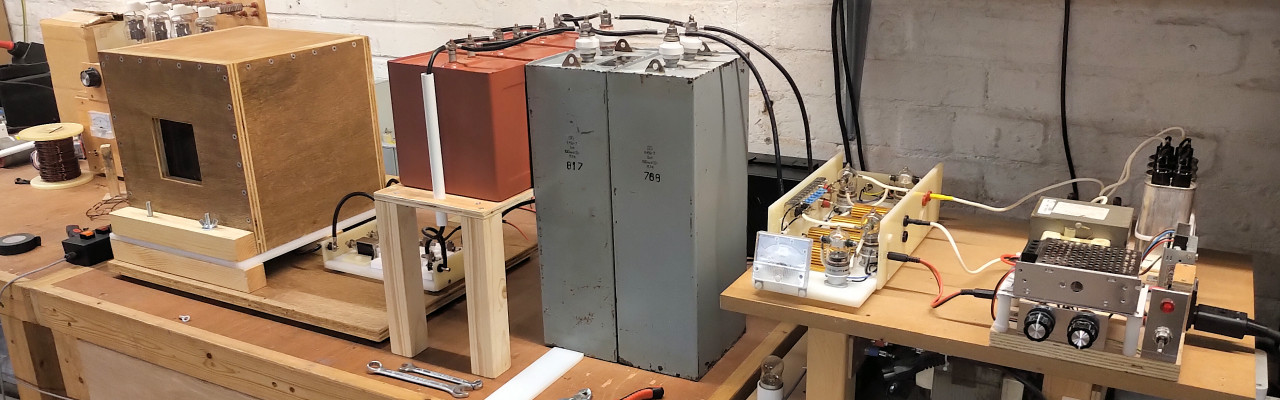
Part 1 of the spark gap generator covered the major components of the system, along with the design steps taken to build a diathermy replica unit (DR). In this part measurements are carried out both in the frequency and time domains, to further understand the operating characteristics, and how best to match the output of the generator to the experimental load. In this part there is also consideration as to how the generator transforms the incoming mains supply to an output suitable for experiments in the displacement and transference of electric power.
The primary purpose of any generator within such an experimental system, arranged to investigate the inner properties and workings of electricity, is to provide the necessary tension to the experiment, in order to change the balance of the electric and magnetic fields of induction within the local region of the experimental system. It is considered that changing the local balance of these fields in turn couples to deeper properties within the energetic dynamics and wheel-work of nature, which according to the purpose or the load of the system generates a response into the local experimental system. In so doing the form of the electrical input to the generator is transformed to another more suitable electrical output under tension. In other words the energetic balance of the system is based on an inter-dependence between the local source, (in this case the generator), and the “need” or purpose generated in the system, (in this case the load). The inter-action between source and load defines the local electrical characteristics of the system under experimentation.
In the case of the spark gap generator tension is established by considerably raising the potential (voltage) of the output, whilst simultaneously transforming incoming alternating currents (ac), to oscillating currents (oc) in both the primary and secondary coils in the DR. In addition, and most importantly for displacement, there is a brief moment before the initiation of the discharge of the spark where the impedance of the space in the gap is low, but no transient discharge has yet started. At this point it is conjectured that displacement occurs, and an impulse current is drawn into the system for a very brief moment before the spark discharge is established.
After this moment of displacement, current starts to flow from the tank circuit through the spark gaps, dissipating the stored energy in the circuit through the normal process of transference, and in so doing generating oscillating currents in the resonant circuits of the primary and secondary. It is conjectured that exploration of these transient impulse currents may indicate a mechanism for additional energy to be injected into the system, and is part of the larger displacement principle being investigated as an inner working of electricity, and originating from the undifferentiated coherent action of the electric and magnetic fields of induction to re-balance the dynamics of the local system.
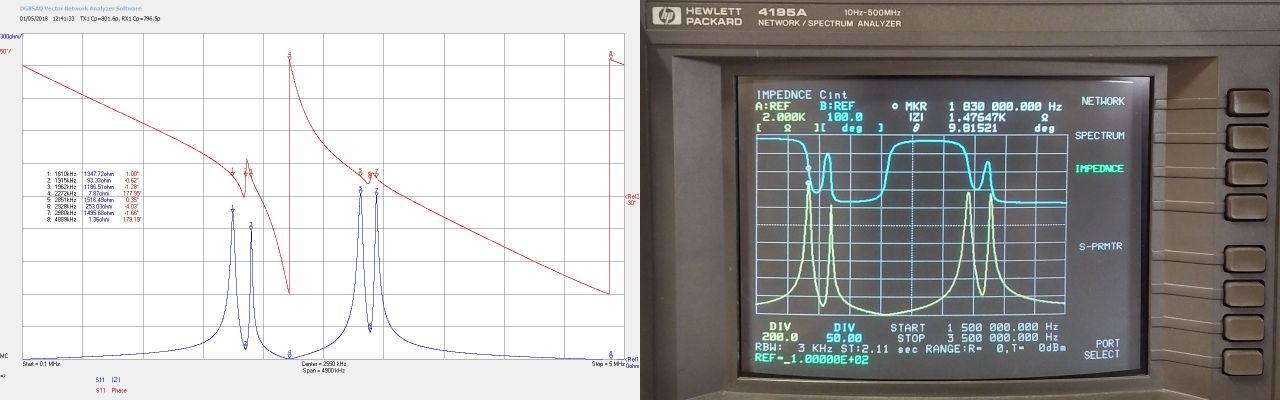
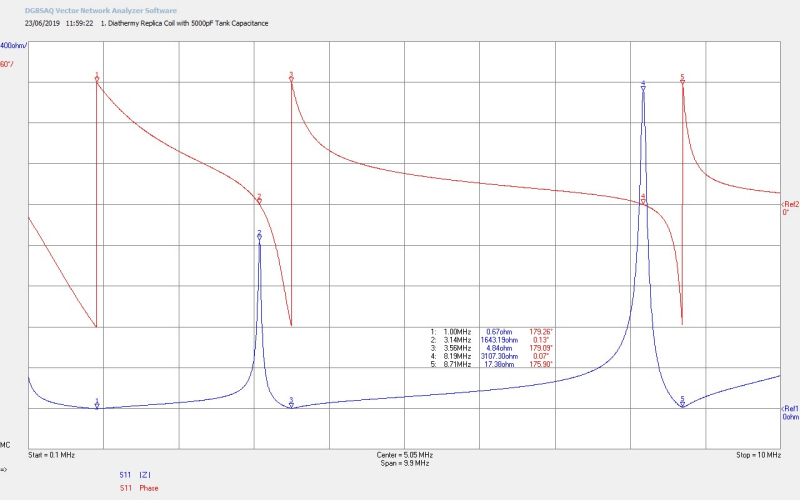
Figures 2 below show the small signal impedance measurements for Z11 up to 10Mc/s at the output of the spark gaps, (with the HV unit disconnected), and then with progressive change of tank capacitance to show the change in tuning, and the optimum match between the primary and secondary of the diathermy replica (DR) unit:

To view the large images in a new window whilst reading the explanations click on the figure numbers below, and for a more detailed explanation of the mathematical symbols used in the analysis of the results click here. For further detail in the analysis and consideration of Z11 typical for a Tesla coil based system click here.
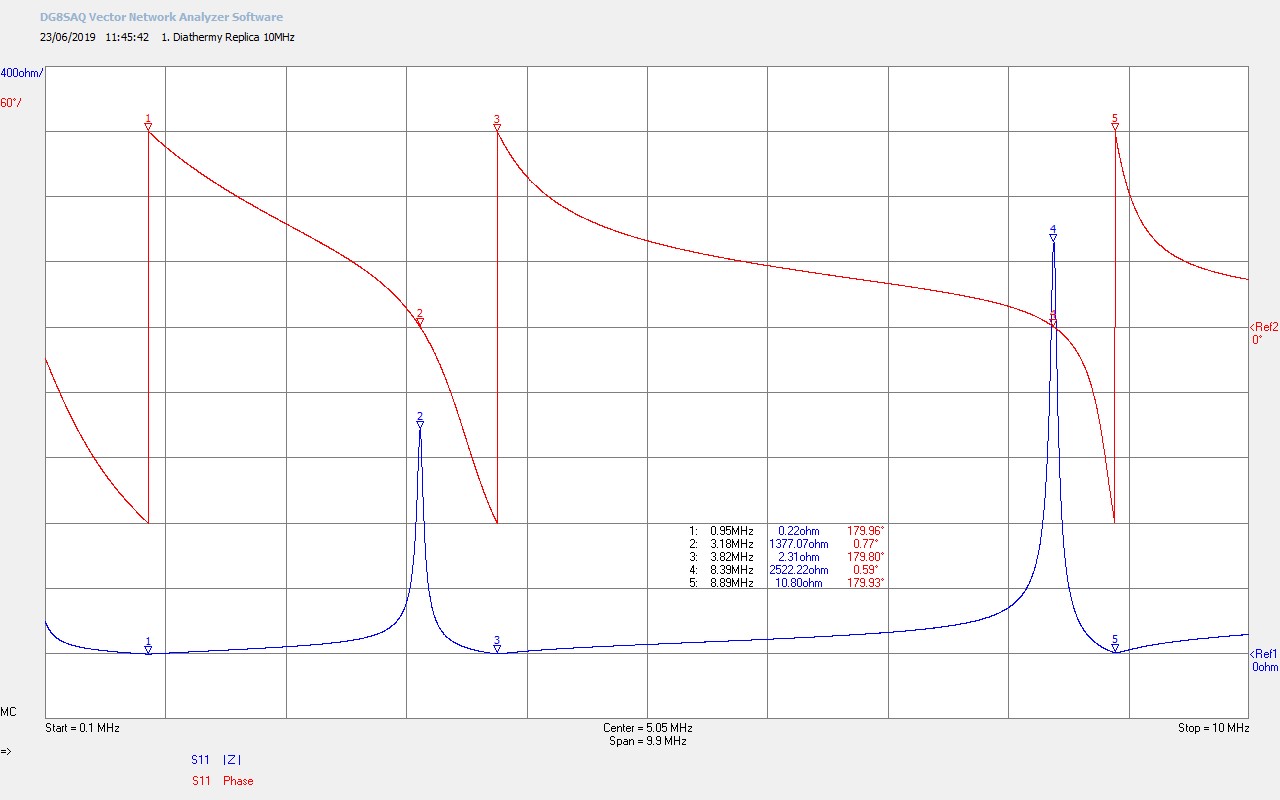
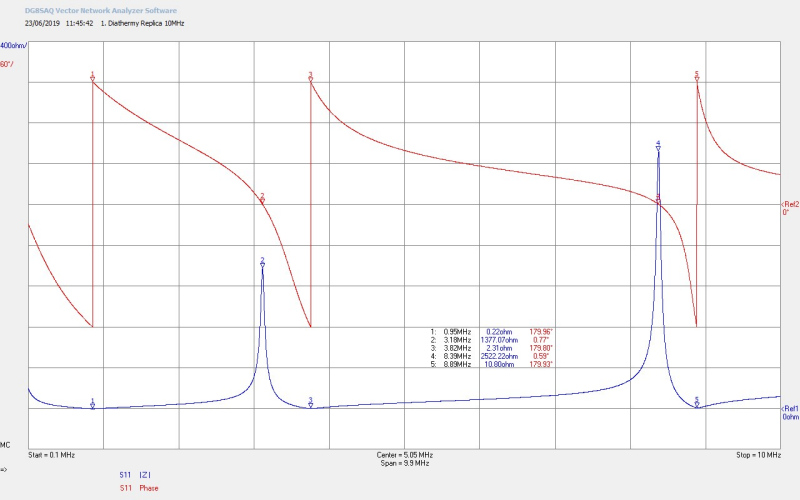
Fig 2.1. Shows the resonant frequencies of the both the primary and the secondary coils in the DR. M1 (marker 1) is the fundamental resonant frequency FP of the primary, showing the 180° phase change that takes place at the resonant frequency, and the minimum impedance point of a series resonance where |Z| has no reactive components and only reflects the electrical resistance of the primary coil. FP at 950kc/s is a result of the series combination of the primary coil inductance and resistance LP and RP, and the combined two series banks of tank capacitors CP, and any stray L and C that result from the inter-connecting wires and boundaries to the surrounding medium. RP ~ 0.22Ω is low and indicates a good primary coil size and material, which will enable larger discharge currents to flow, facilitating stronger oscillations to be coupled to the secondary, and an improved power transfer between the primary and secondary coils.
M2 shows the fundamental resonant frequency of the secondary FS = 3180kc/s, and M3 the frequency at which a 180° phase change takes place FØ180 = 3820kc/s. As is normal for a secondary coil where there is considerable distributed resistance across the coil end points FS and FØ180 do not occur at the same frequency, and the parallel resonance formed between LS and the distributed capacitance CS set the fundamental resonance of the coil at M2. When electrical energy is coupled to the secondary from the primary the coil will resonate at the frequency indicated at M2.
Where required FS can be made to more closely match FØ180 by adding additional loading capacitance to the open end (top-load) of the secondary coil. This is a very common practice for large discharge Tesla coils, (designed for powerful streamers), where metal toroids are added as a top-load and add additional loading capacitance bringing FS much closer to FØ180. This also reduces the Q of the Tesla coil and hence is not desirable for experimental coils designed to explore the inner workings of electricity.
It should be noted that the fundamental resonant frequencies of the primary FP and secondary FS do not correspond at the same frequency, as would normally be expected and tuned for a spark gap driven Tesla coil arrangement. Normally to gain maximum power transfer between the two coils their resonant frequencies will be arranged to be the same through tuning of the primary, (Lp or Cp dependent on the type of coil, how it is constructed, and with what materials). This means that in the DR case less power than optimum is coupled to the secondary, and hence the strength of any discharges from the output of the EHT terminal are reduced. Since the DR is based on the original HGF specifications it is conjectured that this may have been desirable for medical diathermy applications to restrict the strength of the EHT discharges by deliberately mis-matching the resonance of the two coils.
The second harmonic of the secondary FS2 occurs at M4 and M5. If the primary is tuned closer to M4 then the secondary coil will resonate at FS2 = 8390kc/s which represents the second odd harmonic of the secondary wire length, 3λ/4. The parallel resonance at M4 is noted to be quite strong, with a similar Q to the fundamental, indicating that the secondary could have a better response to impulse currents generated in the system. Impulse currents due to there very sharp, high energy, wide frequency band, excite a wide range of resonances within a typical Tesla coil system. The ability for the system to respond to such impulse currents largely depends on the overall Q of the coil’s harmonics. The series resistance at M5 becomes the limiting factor in how much power can be coupled to harmonics of the coil, and has risen considerably from M3 from 2.3Ω to 10.8Ω.
It can be noted from part 1 that the designed Fλ/4 (FØ180) was simulated for the coil dimensions, turns, and construction as 3806kc/s which is only ~ 0.4% error from that measured in the small signal Z11 analysis at 3820kc/s, (Fλ/4 occurs at M3, and is based on the λ/4 length of the coil when one end of the coil is at a low impedance, and the other at a high impedance).
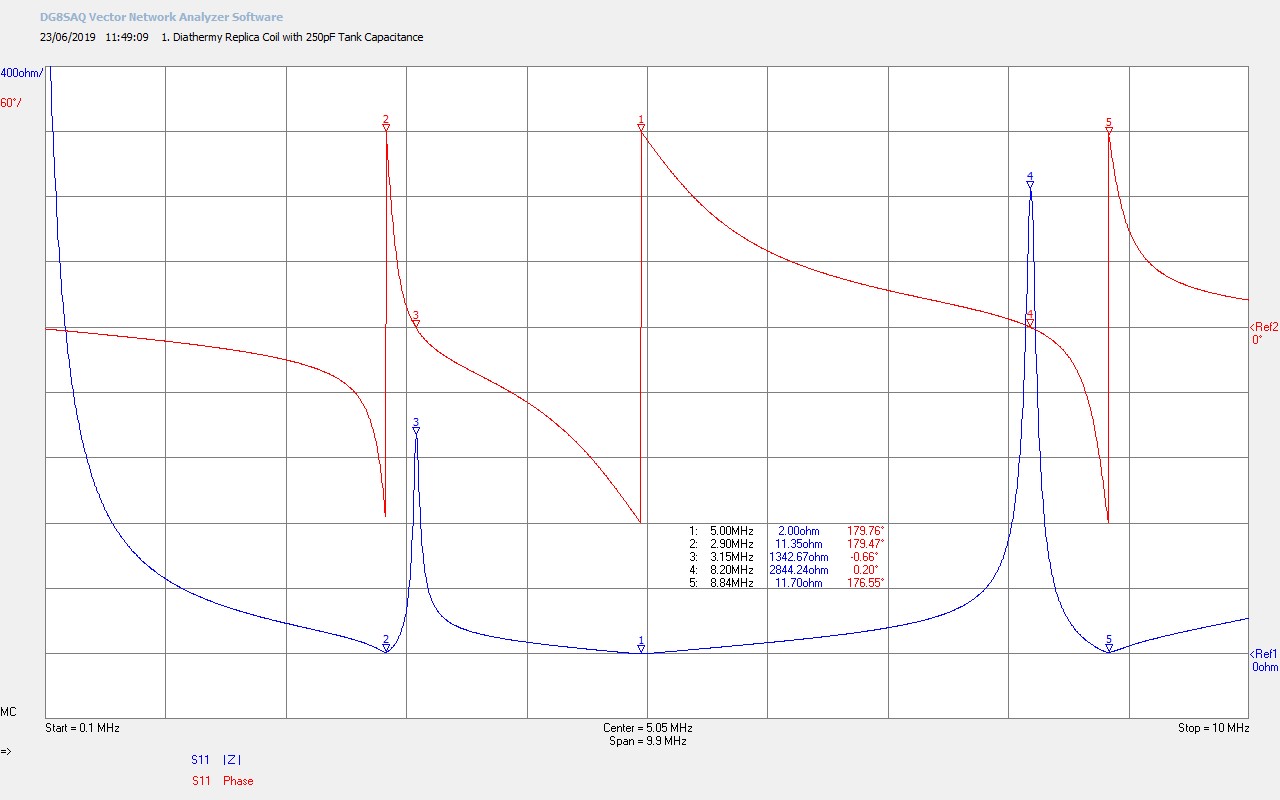
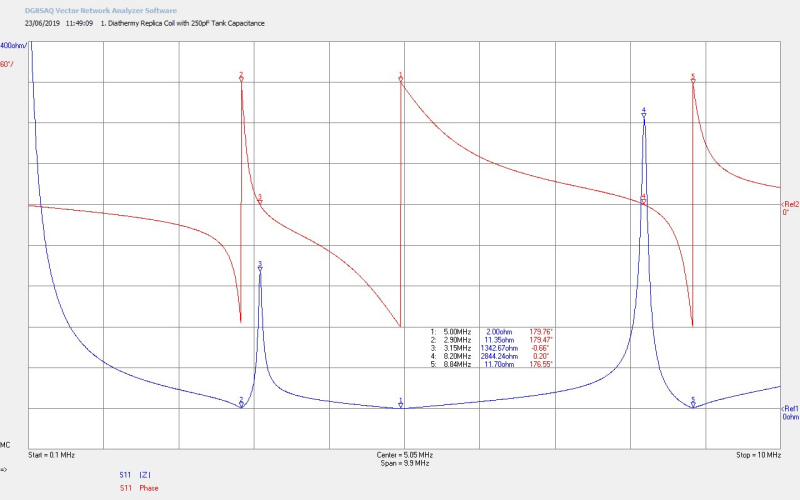
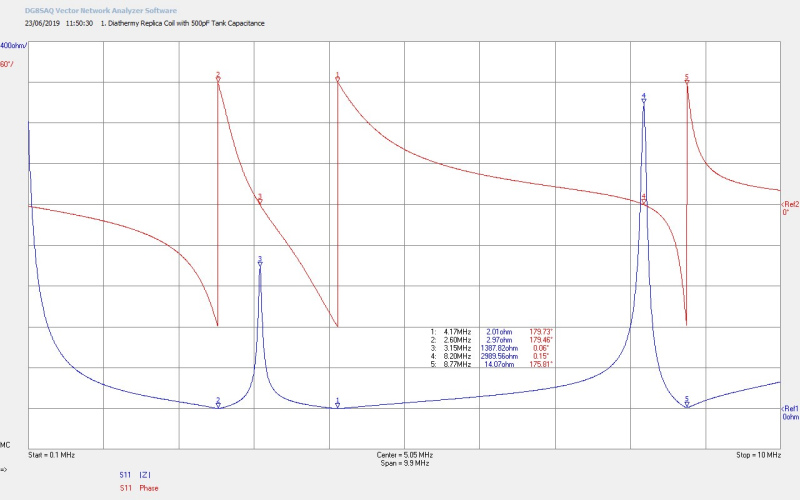
Fig 2.2. Shows the dramatic effect of reducing the total tank capacitance CP down to 250pF. The marker number for the primary M1 has been kept the same despite the order of the coil resonances changing across the 10Mc/s band. M1 the series resonant frequency of the primary FP has now moved right up to 5Mc/s, which has also resulted in a reversal of M2 and M3 so the that FS is now above FØ180 at 3150kc/s. The effect of moving the primary resonance point, through the tuned primary tank CP, is to mis-match the primary and secondary resonances the other way, increase the effective series resistance of the primary coil resonance from 0.22Ω to 2.0Ω, but to leave the actual fundamental resonance frequency of the secondary FS with only a ~1% change from 3180kc/s to 3150kc/s. Increasing M1 to between the fundamental FS and the second harmonic FS2 has also had a more dramatic impact on the frequency of the second harmonic, reducing it from 8390Kc/s to 8200kc/s, a change of ~ 2.3%.
It should be noted that the dependence of FS and FØ180 to tuning in the primary is dramatically different for the flat coil parallel tuned, and the cylindrical case series tuned. For the flat coil, parallel resonance tuned, FØ180 remains more constant with changes in CPP, and is almost exclusively effected only by the secondary wire length, whereas FS, and its harmonics FSN, vary very widely based on changes in CPP. In the cylindrical coil, series resonance tuned, the dependence reverses and FØ180 varies very widely with changed in CPS , whilst FS, and its harmonics FSN, remain more constant with changes in CPS. This emphasises the need for the correct choice in the type of secondary coil used for any specific experiment (e.g. flat, cylinder, equal ratio etc.), and also the correct choice of primary tuning mechanism, (parallel or series). The characteristics and differences, and hence the choice for specific types of experiments, for each of these different coil configurations will be considered and reported in more detail in subsequent posts on the cylindrical coil.
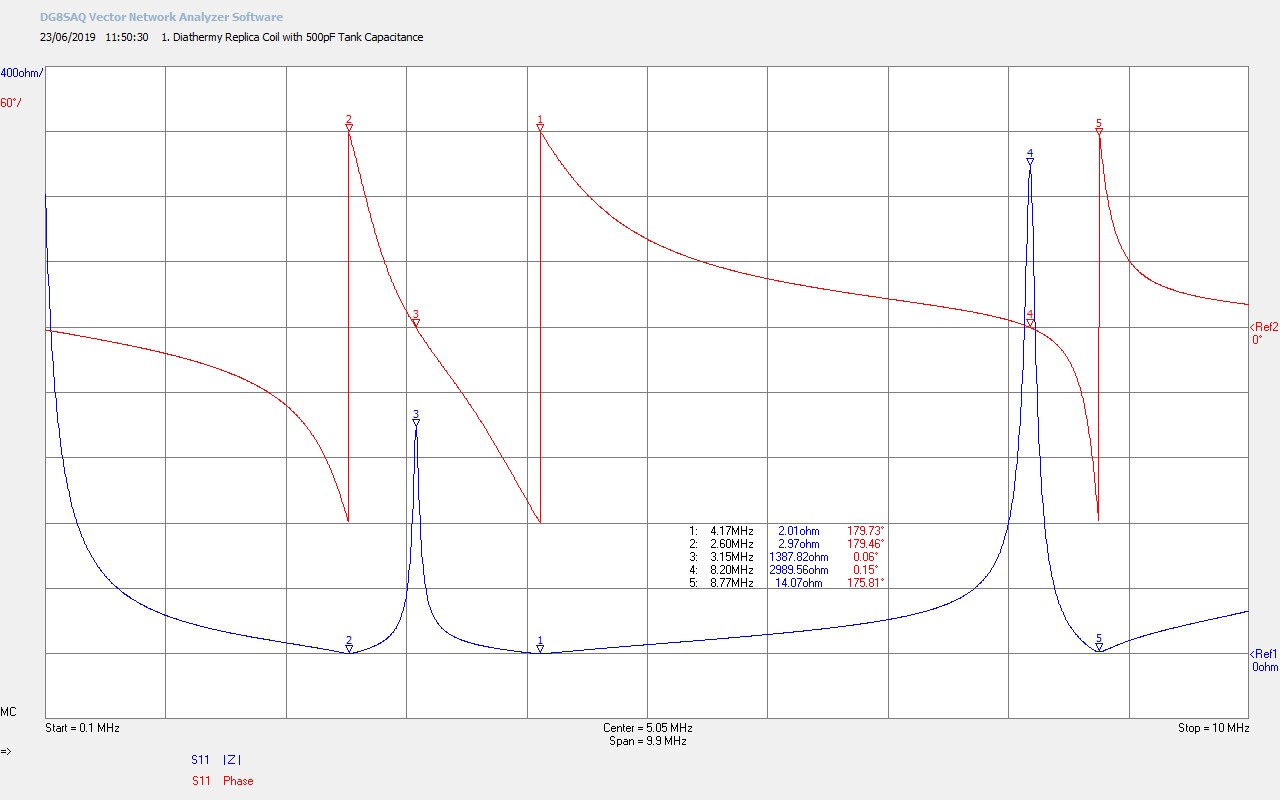
Fig 2.3. Here CP is now increased to 500pF and M1 starts to move downwards again towards the secondary FS. In this case FP is approaching the point of optimum match where the primary and secondary are equally split between the centre point. With CP = 500pF the match is still a little high where the primary is resonating at a frequency above the secondary.
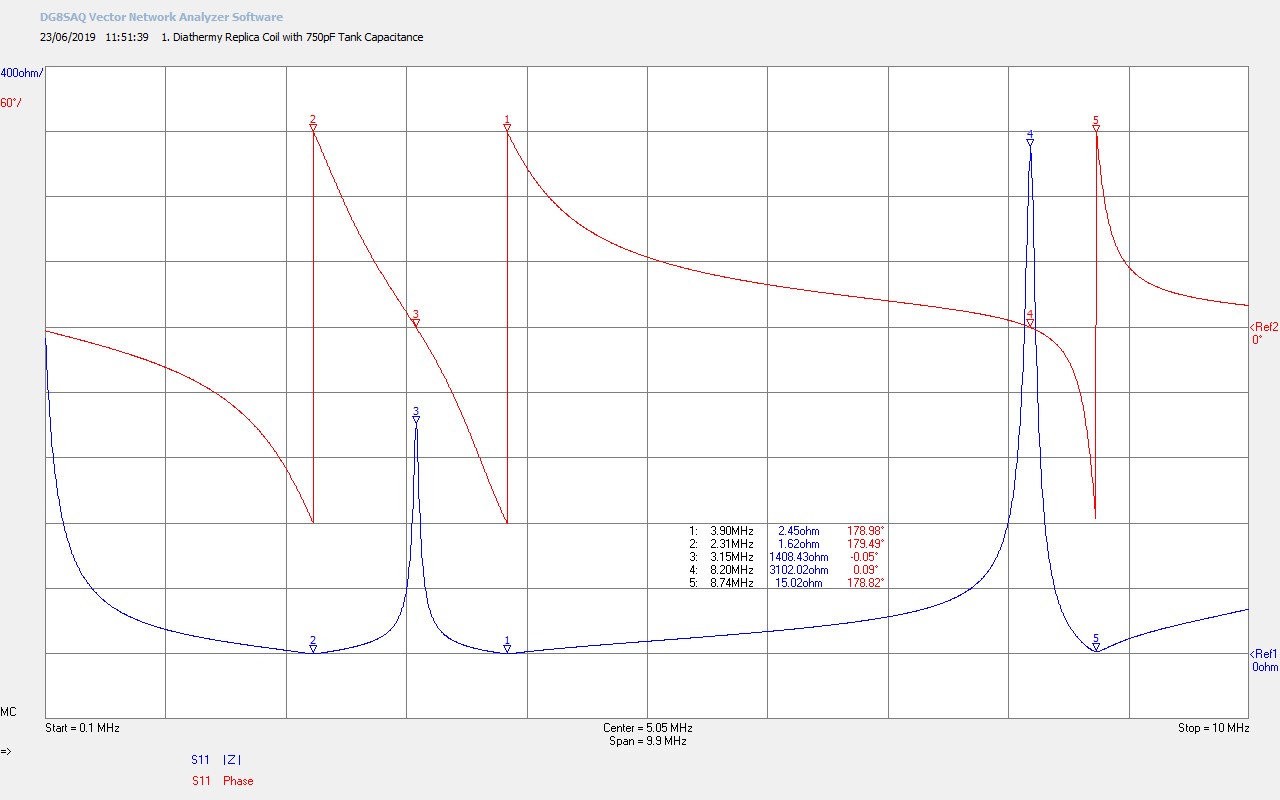
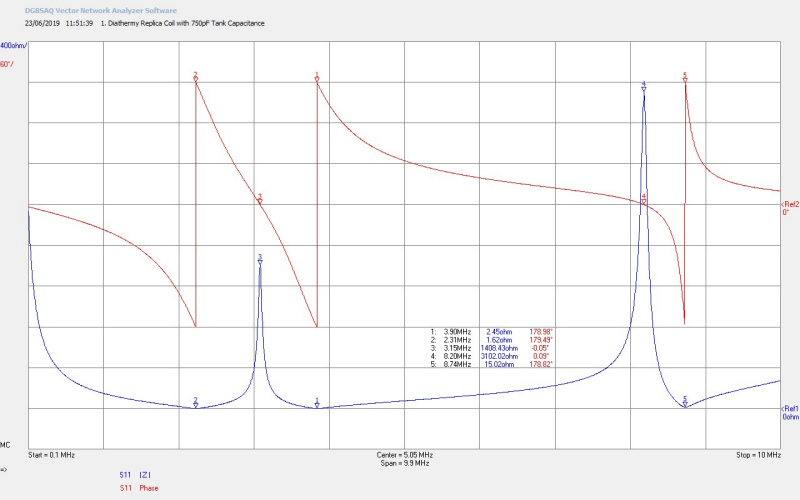
Fig 2.4. Here CP is now increased to 750pF and M1 and M2 are now equidistant either side of FS at M3. Once again FS has not really changed significantly and is still at 3150kc/s. This point of match is in principle the most optimum match between the primary and secondary coils, where maximum power can be transferred between the two coils.
In practise and for maximum streamers it is usually preferred to operate this form of cylindrical Tesla coil, where FP is slightly below FS, due to FS falling when a discharge (streamer) occurs. The discharge causes a change in the impedance of the secondary coil reducing its resonant frequency FS, bringing FS during discharge to an optimum match with the primary, allowing maximum power transfer from the tank through to the secondary discharge.
In experiments to explore the displacement and transference of electric power, where it is preferable not to produce discharge streamers (dissipating the energy of the system through transference), the optimum match where FS = FP is the preferred condition. This is where the Q of the system is maximum, and the continuity between the electric and magnetic fields of induction between primary and secondary are optimum, which in turn ensures the maximum dynamic stability, and best departure point from a system in equilibrium.
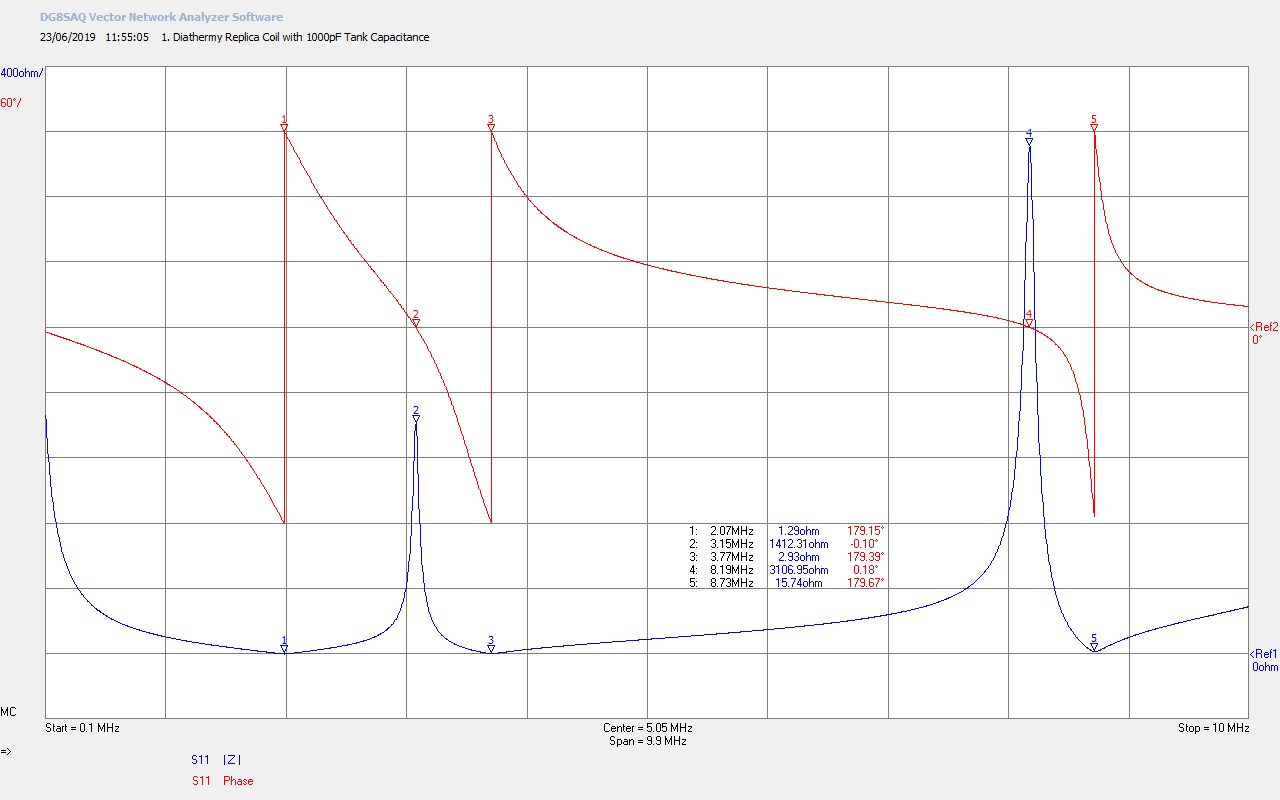
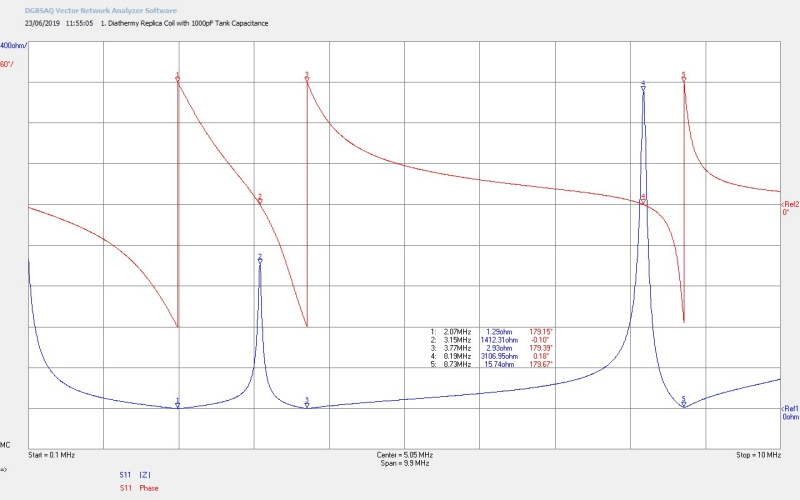
Fig 2.5. Here CP is now increased to 1000pF, FP is slightly below FS, (observed in the larger gap between M1 and M2, than M2 and M3), which is around the best empirical match for a Tesla coil designed for maximum discharge as discussed in the previous section.
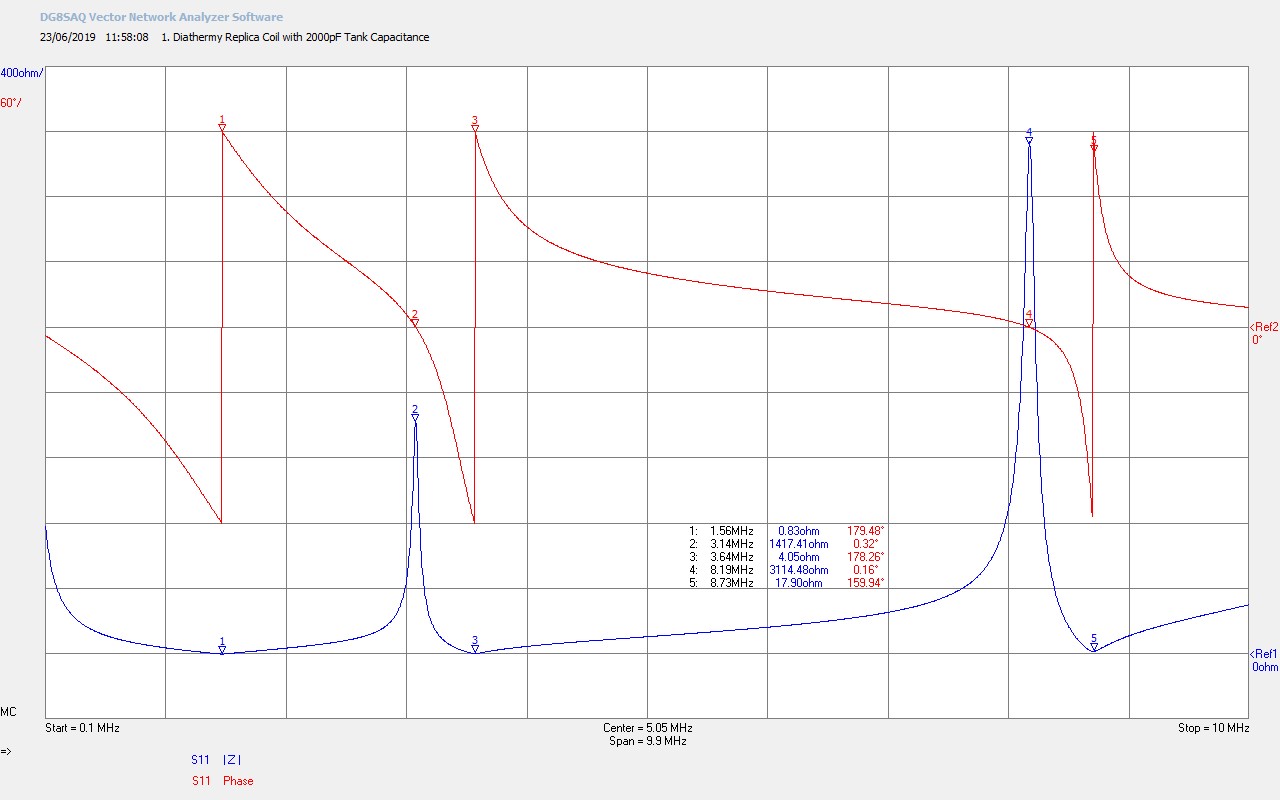
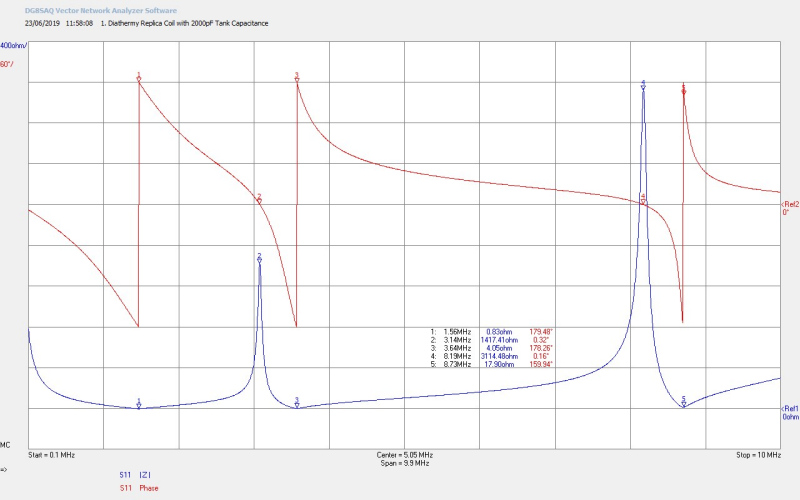
Fig 2.6. Increasing CP to 2000pF starts to move FP more rapidly away from FS, the match between the primary and the secondary is reducing, and hence the coupled energy is also reducing.
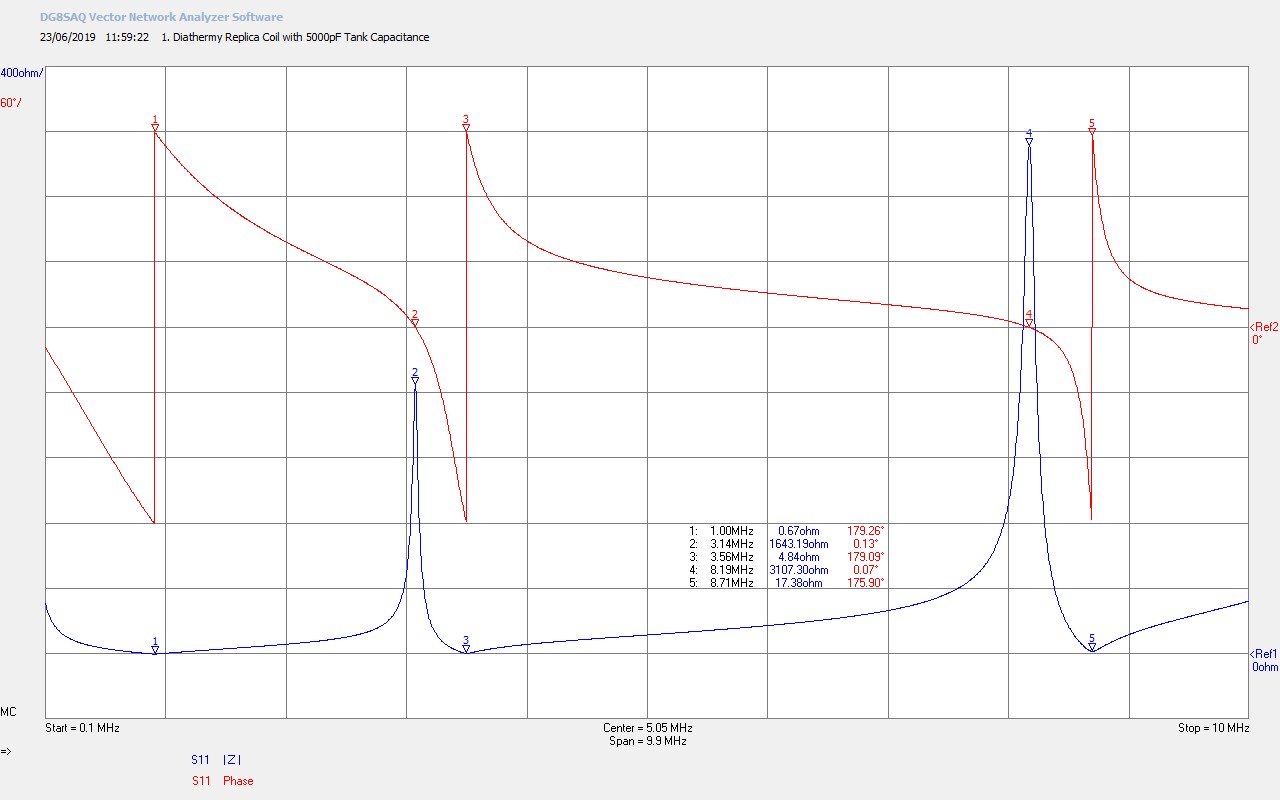
Fig 2.7. At CP = 5000pF FP is now approaching the DR design of Fig 2.1, FP = 1000Kc/s, and FS remains mainly constant at 3140kc/s, only having changed ~ 0.3% as CP changes in the range 250pF – 5000pF.
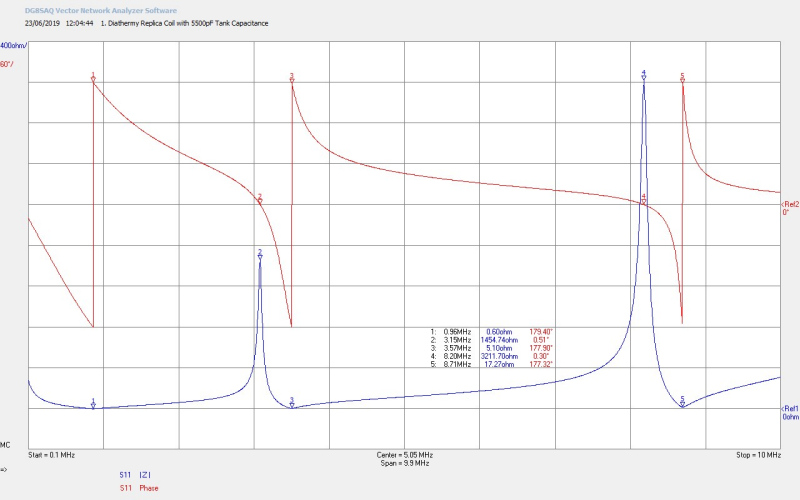
Fig 2.8. At CP = 5500pF FP is now very similar to the DR design of Fig 2.1, however FS has not yet increased slightly to match the 3180kc/s in Fig 2.1. CP is somewhat different to the expected ~ 7200pF of the two Cornell Dubiller tank capacitor banks which in combination is 6 capacitors of 47nF in series.
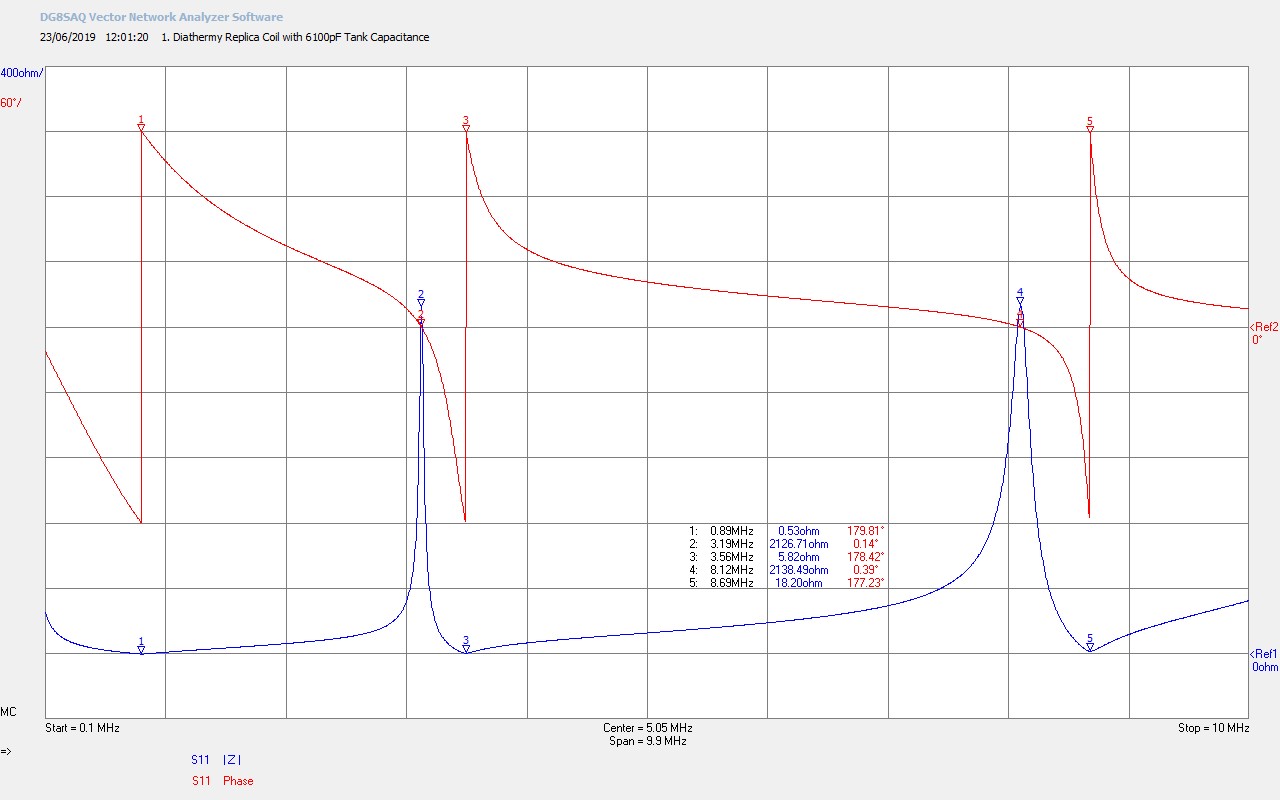
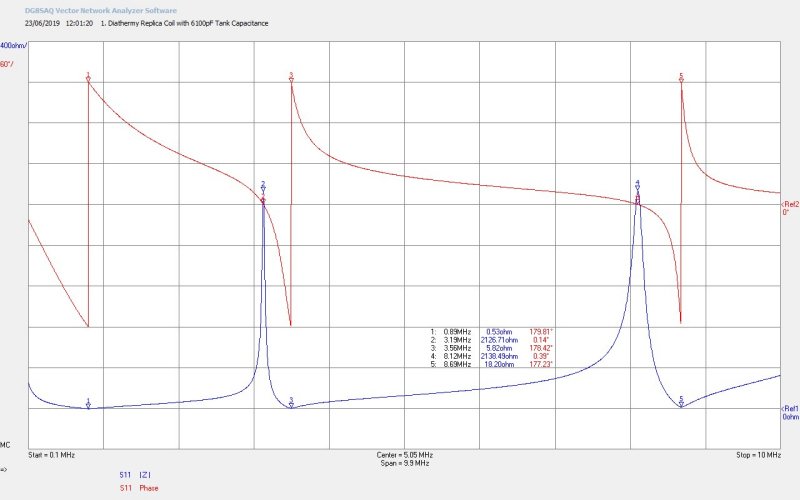
Fig 2.9. Here CP has been increased to 6100pF, where FP matches to the large signal primary resonant frequency observed during the time domain experiments shown below in Fig 3.3 at 895kc/s. FS which is now 3190kc/s has finally moved slightly away from the previously stable 3150kc/s, but notably is now closer to the DR design of Fig 2.1, and also the large signal secondary resonant frequency of 3214kc/s shown in Fig 3.6 below.
Overall the small signal Z11 analysis of the spark gap generator reveals a wealth of detail in understanding how this generator is characterised in the frequency domain, and how best to match the primary tank capacitance to obtain different operating points according to the purpose of the experimental system.
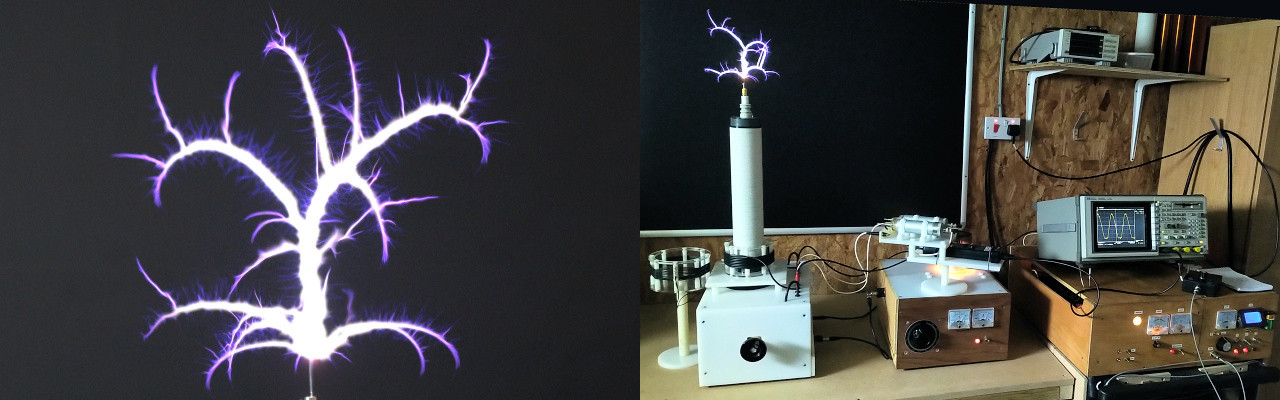
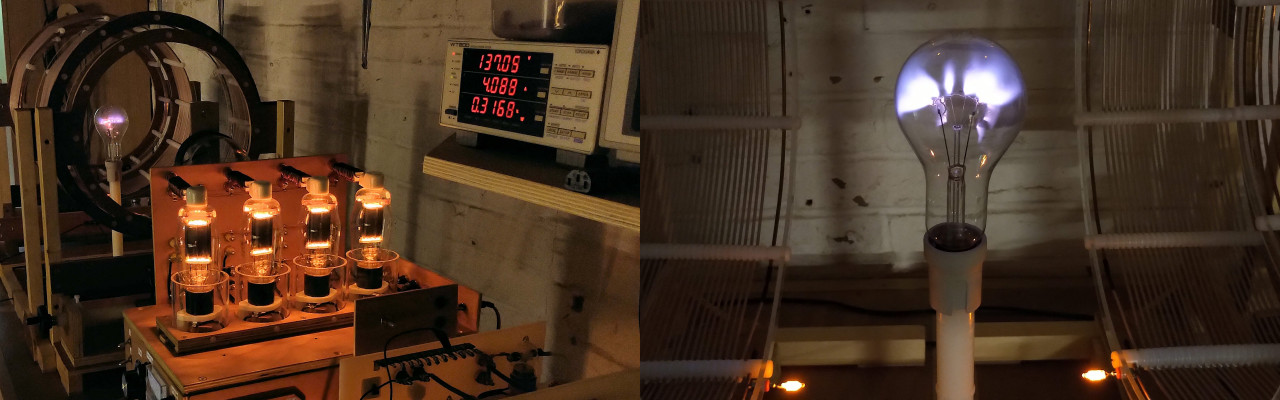
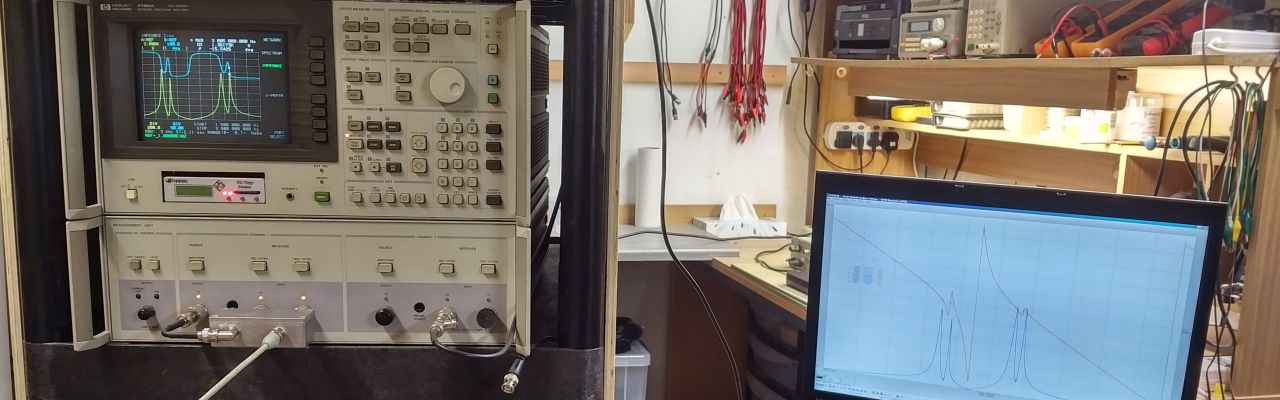
Figures 3 below show the large signal time domain waveforms of the spark gap generator as measured from the low output tap, and illustrate the different stages of the spark discharge burst both in the primary and secondary coils of the generator. The spark gap generator was being run at an input power of 300W, (monitored using a Yokogawa WT200), which was kept constant throughout the measurement of both Figures 3 and 4. Output waveforms were measured using a Pintek DP-50 high voltage differential probe, (max. 6.5kV up to 50Mc/s), which was connected to a HP 54542C oscilloscope to observe and record the output waveforms.


To view the large images in a new window whilst reading the explanations click on the figure numbers below:
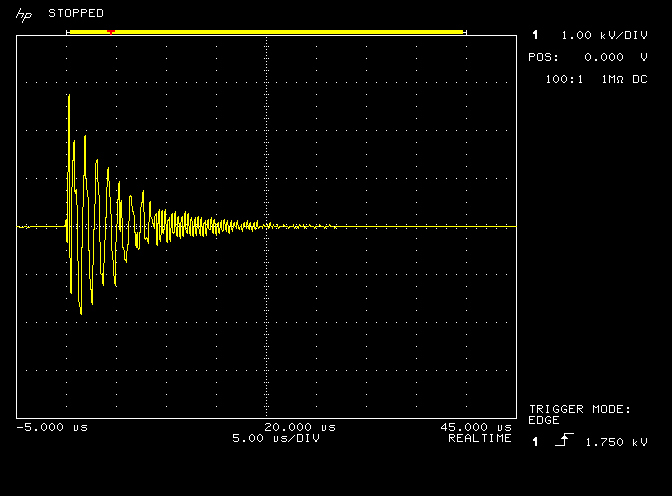
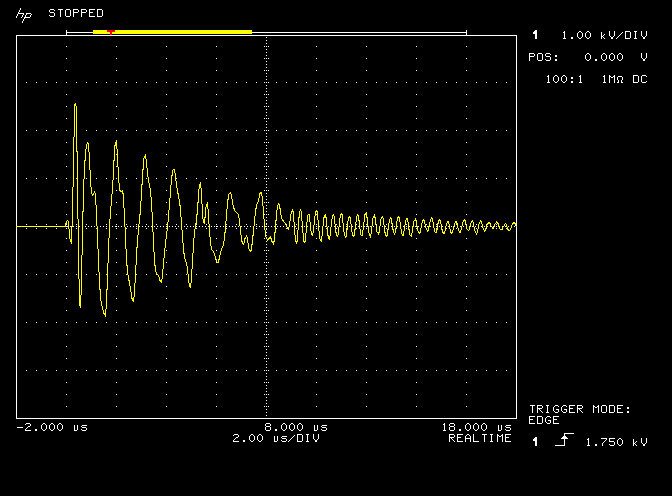
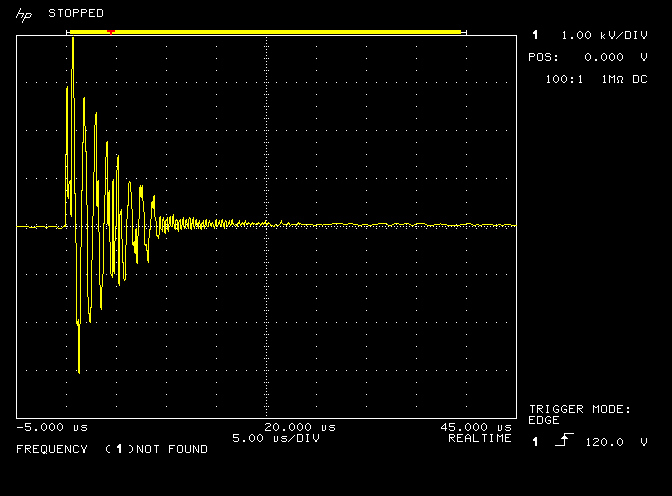
Fig 3.1. Shows the burst waveform measured at the low output tap of the DR. The vertical amplitude scale is 1kV/div, and the horizontal timebase is 5µs/div. The oscilloscope was adjusted to acquire the burst in single-shot mode, triggering at a low to high transition of 1.75kV, where the output delay was adjusted to coincide the trigger to the start of the second full horizontal division. The burst waveform is formed of three major sections, where the first is right at the point of triggering and always involves a very sharp impulse type transition, the second a ring-down of specific frequency based on an exponentially decaying oscillation in the primary coil of the DR, and the third, a ring-down of another specific frequency on an exponentially decaying oscillation in the secondary coil of the DR.
The first section occurs right around the moment of initiation of discharge of the spark gap, and includes a very sharp impulse transition, where the amplitude of this impulse can be many times more than the nominal tension of the high voltage supply. This section requires more detailed capture and measurement with a more sophisticated experimental setup, and will therefore be considered and reported in a subsequent post. Here it is sufficient to understand that there is an impulse like start to the spark discharge, which only lasts for a very brief moment around the initiation of the discharge, and produces very narrow and sharp amplitude spikes at the very beginning of the output burst.
The second section is established right after the spark discharge has started, and the energy stored in the two tank capacitor banks is being discharged in the primary circuit. Before the spark discharge is initiated the tank capacitors are charged by line frequency alternating current supplied by the output of the high voltage supply, where the charging circuit is formed by the high voltage transformer connected through the tank capacitors to the primary coil. When the tension across the output of the transformer has risen above the combined breakdown voltage of the spark gap unit, the spark discharge begins and the impedance across the spark gap suddenly changes from an open-circuit to almost a short-circuit.
The inputs to the primary tank capacitors are now shorted together by the spark and the tank capacitors discharge their stored energy rapidly through the primary coil. The resonant primary circuit formed by the tank capacitors in parallel with the primary coil cause the discharge to oscillate at a frequency defined by LPCP, and this oscillation lasts until the tank capacitors are completely discharged. How rapidly the capacitors discharge at the resonant frequency and the magnitude of the oscillating currents generated in the primary circuit is dependent on the series resistance presented by the primary circuit, which should ideally be as low as possible, and in the case of the DR was measured in Fig 2.1. to be ~ 0.2Ω.
The oscillating currents in the primary during the spark discharge of the tank capacitors, couple through induction to the secondary of the Tesla coil in the DR, or more clearly, a sudden change to the prior equilibrium state of the electric and magnetic fields of induction energy in the system result in energy being accumulated in the secondary coil. In the third section of the burst discharge this accumulated energy in the secondary transforms to oscillating currents at a frequency defined by the secondary resonant circuit LSCS. The secondary oscillating currents decay exponentially in the secondary coil, (assuming no streamer discharge from the secondary), according to the series resistance presented in the secondary circuit. These secondary oscillating currents again couple through imbalance in the electric and magnetic fields of induction back to the primary circuit, where they can be observed in the output waveform as the third section of the ring-down, which dominates the output when the second section oscillations have become sufficiently small.
The complete burst waveform lasts for about 20µs before decaying to less than 1% of its initial amplitude. Bursts are initiated each new cycle of the line frequency, so for UK standard line input at 50Hz to the high voltage supply, a burst is generated every 10ms, (2 per cycle), or at a frequency of 100Hz.
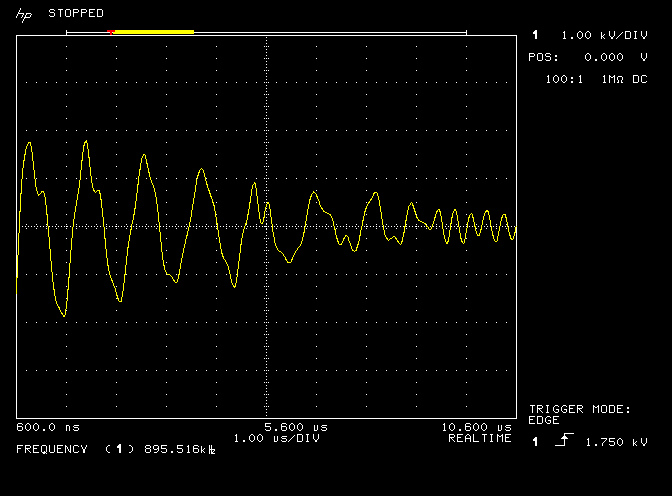
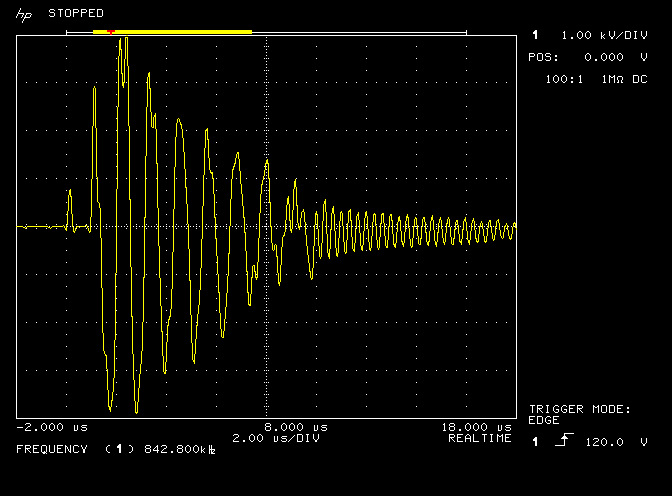
Fig 3.2. Here the horizontal timebase has been reduced to 2µs/div which accordingly magnifies the burst discharge showing more detail in the first, second, and third sections. In the second section and with careful observation it can be seen that the oscillation is not a pure sine wave, it is actually the oscillating currents of the primary circuit with the smaller oscillations of the secondary super-imposed over the top. The super-imposed secondary currents are not easily discernible in the second section because the amplitude of the oscillation in the primary circuit are large.
As these primary oscillations decay away, and after ~ 8µs, a phase change in the output occurs and the secondary oscillations now dominate the output with an envelope that carries the small decaying primary oscillations. In other words the overall burst waveform is a superposition of the oscillating currents in both the primary and the secondary in both sections two and three, where one or the other can be clearly observed based on the energy stored in the respective resonant circuit, and that coupled forward and backward through the inter-action of the two coils.
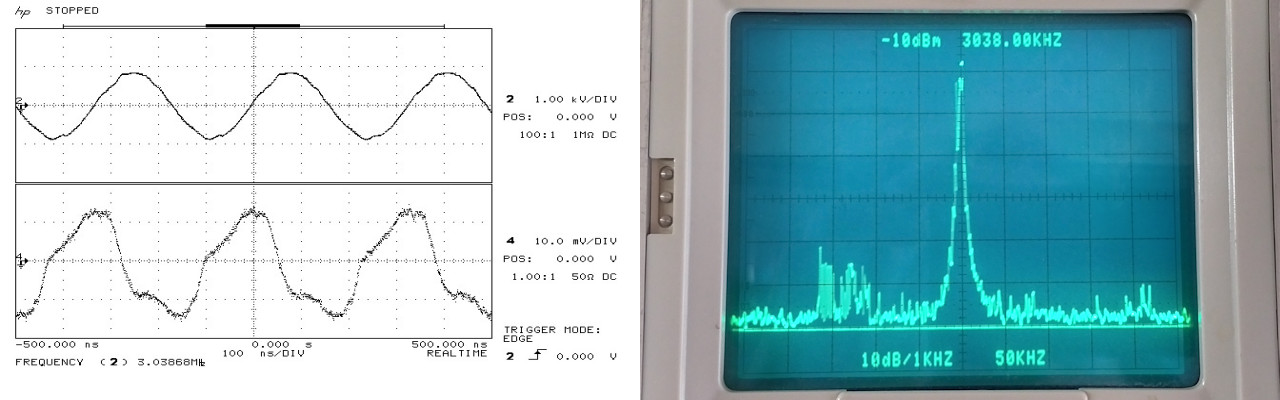
Fig 3.3. Here the horizontal timebase has been further reduced to 1µs/div and the waveform buffer delay adjusted so that section two dominated with the primary oscillations fills almost the entire trace. The transition to the third section can be seen in the last two divisions of the trace. With section two the main focus of this trace the monitored average frequency of trace 1 can be seen to be 895kc/s which is FP, the fundamental resonant frequency of the primary circuit. The amplitude of the primary oscillations is almost 4kVpk-pk at the beginning of the section, and has decayed after 8µs to ~ 1kVpk-pk.
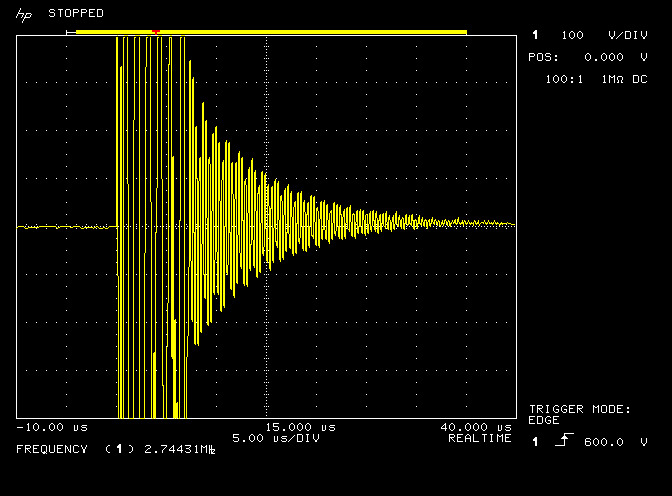
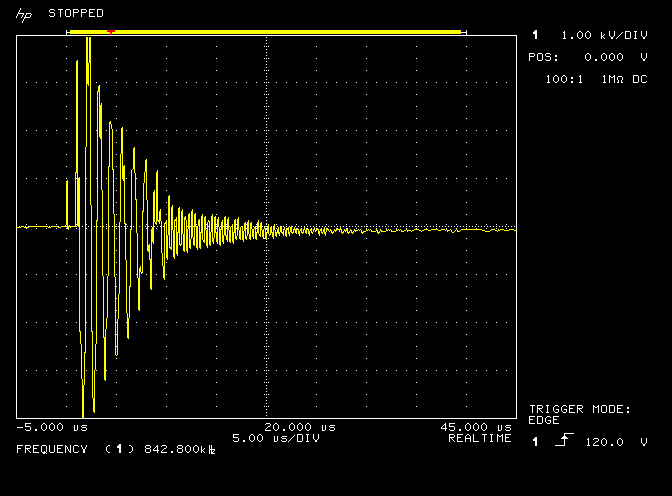
Fig 3.4. Shows the discharge burst in magnified amplitude against the original horizontal timebase rate. The amplitude has been magnified by a factor of 10 from 1kV/div to 100V/div which illustrates clearly the transition to the third section where oscillations in the secondary coil, coupled back into the primary coil, are a superposition of the both the primary and secondary oscillations, and hence the envelope of the waveform in the third section appears similar to an amplitude modulated waveform. Note: the indicated frequency on this trace is not accurate as it is calculated by averaging together sections 2 and 3, and cannot be considered to be the fundamental frequency of the secondary coil.
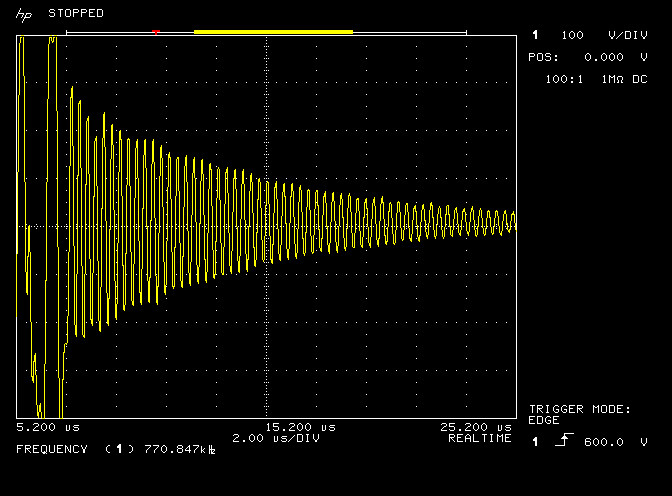
Fig 3.5. Here the discharge burst is magnified both in vertical amplitude and in the horizontal timebase, and illustrates more clearly the decay and envelope of the secondary oscillations.
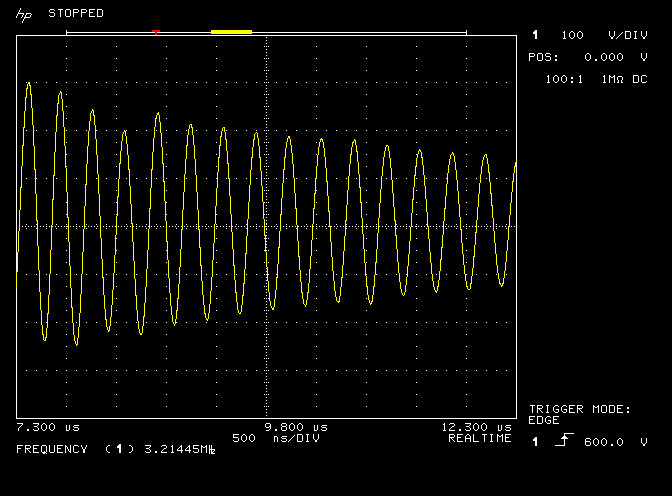
Fig 3.6. Here the discharge burst is further magnified in the horizontal timebase and delayed into the third section of the discharge burst, which shows the monitored average frequency of trace 1 to be 3214kc/s which is FS, the fundamental resonant frequency of the secondary coil.
The large signal time domain waveforms have also revealed a wealth of detail about the operating characteristics of the spark gap generator, showing the nature and characteristics of the oscillating output waveform, and with well-defined sections that can be corresponded to the frequency domain properties measured in Figures 2. The results have also shown impulse like characteristics in the first section of the waveform, that certainly require more investigation and more detailed measurement to clarify if they relate to, and contribute to, the conjecture of underlying displacement phenomena within electricity.
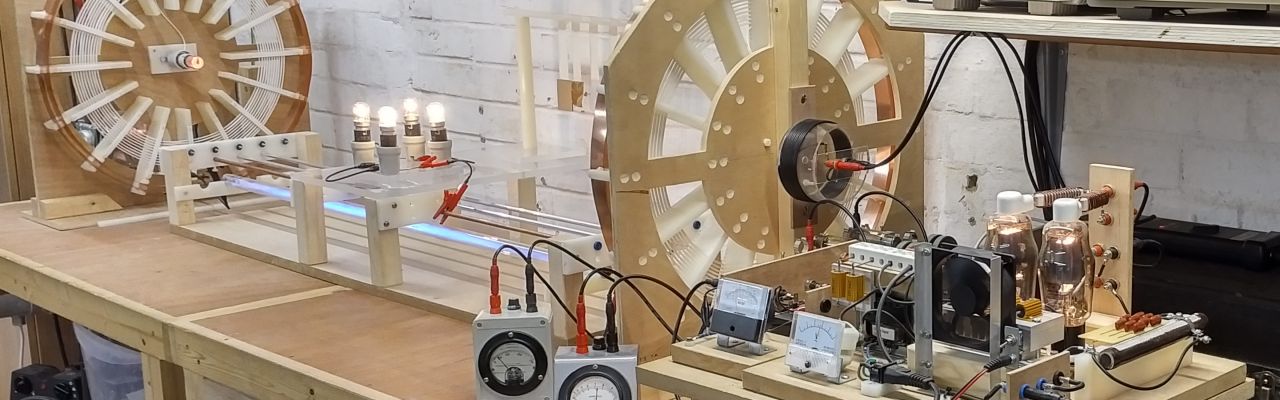
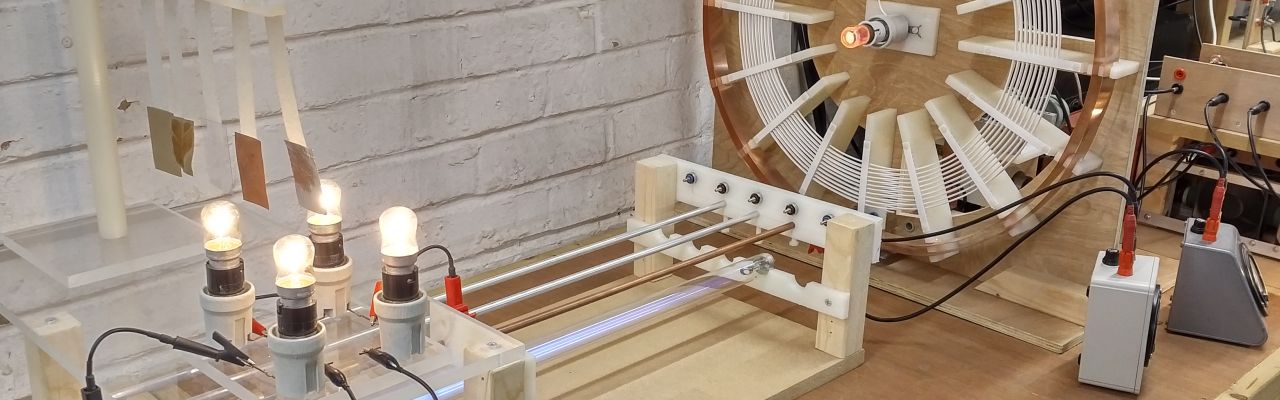
Figures 4 below show a comparison on the same vertical and horizontal scale of the low, medium, and high output taps. It can be seen that the amplitude of the output increases with each successive tap, consistent with the geometry of the primary/Oudin arrangement of the coils.


The low tap produces about 4kVpk-pk initial output, the medium tap 8kVpk-pk, and the high Oudin tap ~ 11kVpk-pk but at considerably reduced current. The medium output tap has been determined to be the best tap for driving TMT experiments, and other experimental apparatus suited to the exploration of the displacement and transference of electric power, where there is high output tension combined with stronger oscillating currents.
Summary of the generator results and conclusions so far:
1. The results and measurements for the spark gap generator correspond well between the frequency and time domain, and give a good insight into how this type of generator works, and the type of output that can be generated. The generator presented in parts 1 and 2 were initially used to confirm the experiments and results of Dollard et al.[1,2], before being applied widely to my own research into the inner workings of electricity.
2. This generator has been proven to be reliable and robust and can sustain indefinitely output powers of 1.5kW, and short bursts over 2kW with the appropriate connections and arranged loads.
3. This generator transforms the low frequency alternating currents of the line input, into high frequency oscillating current outputs, combined with considerably increasing the tension of the output.
4. Analysis, of particularly the time domain results, indicates a first section in the discharge burst that may include impulse currents and effects that are conjectured to involve displacement events. This section requires more detailed measurement and analysis, and will be reported in subsequent posts.
1. Dollard, E. & Lindemann, P. & Brown, T., Tesla’s Longitudinal Electricity, Borderland Sciences Video, 1988.
2. Mackay, M. & Dollard, E., Tesla’s Radiant Matter Replication, 2013, Gestalt Reality