Negative Resistance and the Self Generating Discharge

Negative resistance is a feature of the I-V characteristic of a discharge between two electrodes, and if correctly utilised can lead to unusual electrical phenomena within an electrical circuit. In this first part on this topic we explore the I-V properties of the negative resistance (NR) region of a carbon electrode spark gap (CSG), or carbon-arc gap. When the CSG is biased into the correct region, and combined with a switched (non-linear) impetus from the generator, the impedance of the circuit can be seen to reduce from the conventional short-circuit case, increasing the current in the circuit and intensifying the light emitted from an incandescent lamp load.

The negative resistance characteristics of a spark gap where explored and utilised by Chernetsky[1] in order to demonstrate what he called the self-generating discharge (SGD). The SGD is a state of discharge where he claimed that the energy consumed from the generator was reduced, yet the power dissipated in the load was increased, and where the additional energy in the electrical circuit was “inducted” from the surrounding medium, or what is commonly referred to as the Aether[2], a “gaseous” medium that is all pervasive throughout space, and is also considered to extend beyond the physical realm. As such Chernetsky claimed an over-unity (OU) phenomena where the total output power was greater than that supplied to the circuit by the generator. This experiment has been replicated by others, including Frolov[3], and Dawson[4], who also claim to have measured OU output. This sequence of posts investigates these principles, attempts to measure the claimed OU output, and further explore its possible origin. Ultimately the studied phenomena forms part of the continuing central research, of revealing the inner workings of electricity, and hence the displacement and transference of electric power.

When investigating over-unity claims good experimental and scientific method is critically important. I have found many situations where OU has been attributed to unusual phenomena without being supported by good and well measured experimental data. OU most often appears to arise in non-linear systems, which owing to their transient nature are also difficult to measure reliably, especially when output power is to be accurately measured. Input power is usually quite straight-forward to measure accurately as it is supplied by dc sources such as batteries and power supplies, or drawn from the mains utility supply which is a low-frequency sinusoidal input. In these cases electrical instruments can be arranged to accurately determine real and reactive input power.

Where the generator produces a non-linear output through switching, pulses, impulses, or chopping an otherwise dc or low-frequency sinusoid the dissipated output power can become a complex transient, with many high-frequency components, and many different phase relationships within the experimental circuit. When this is combined with high voltage and/or current magnification , multi-resonant elements, different transmission modes both transverse and longitudinal, cavity and termination effects, and hence significantly changing boundary conditions on the dielectric and magnetic fields of induction, the final accurate determination of output power, even with sophisticated instrumentation, is exceedingly complex, and can very easily lead to substantial errors and mis-understandings. As such, and due to the complexity of these measurements, the phenomena themselves are easily attributed to OU directly without further detailed assessment, and videos show the qualitative results of the phenomena without significant quantitative supporting evidence. It is not surprising given the often lacking experimental method, and lack of detailed supporting measurements, that conventional science so often holds a cautious and pessimistic view of the OU field.

Having stated this, OU is a very important exploration into the unknown, in the search for a truly sustainable, re-generative power source, and one that attracts wide and diverse forms of research and endeavour. My own research is orientated towards revealing the inner workings of electricity, and through co-operating with life’s natural processes, reveal the re-generative and inclusive nature of these under-lying processes. In this sense my own research strives for best scientific method, and well quantified supporting measurements, which then make it possible to either refute or support established claims, whilst making it possible for me to venture new claims of my own as to the origin, principle, and mechanisms of the explored phenomena. Often one experiment leads to another, as in the case of the experiment that is presented in this post. Whilst interesting phenomena are observed, explored, and measured, further experiments will be required to validate Chernetsky and others’ claims, that the additional energy in the OU experimental system is induced from a medium external to the electrical circuit. In my experiments in this post I find the additional energy that intensifies the luminance of the load, is drawn through the generator from the line supply, and directly as a product of biasing the CSG to utilise the NR properties in the abnormal glow region of the discharge.

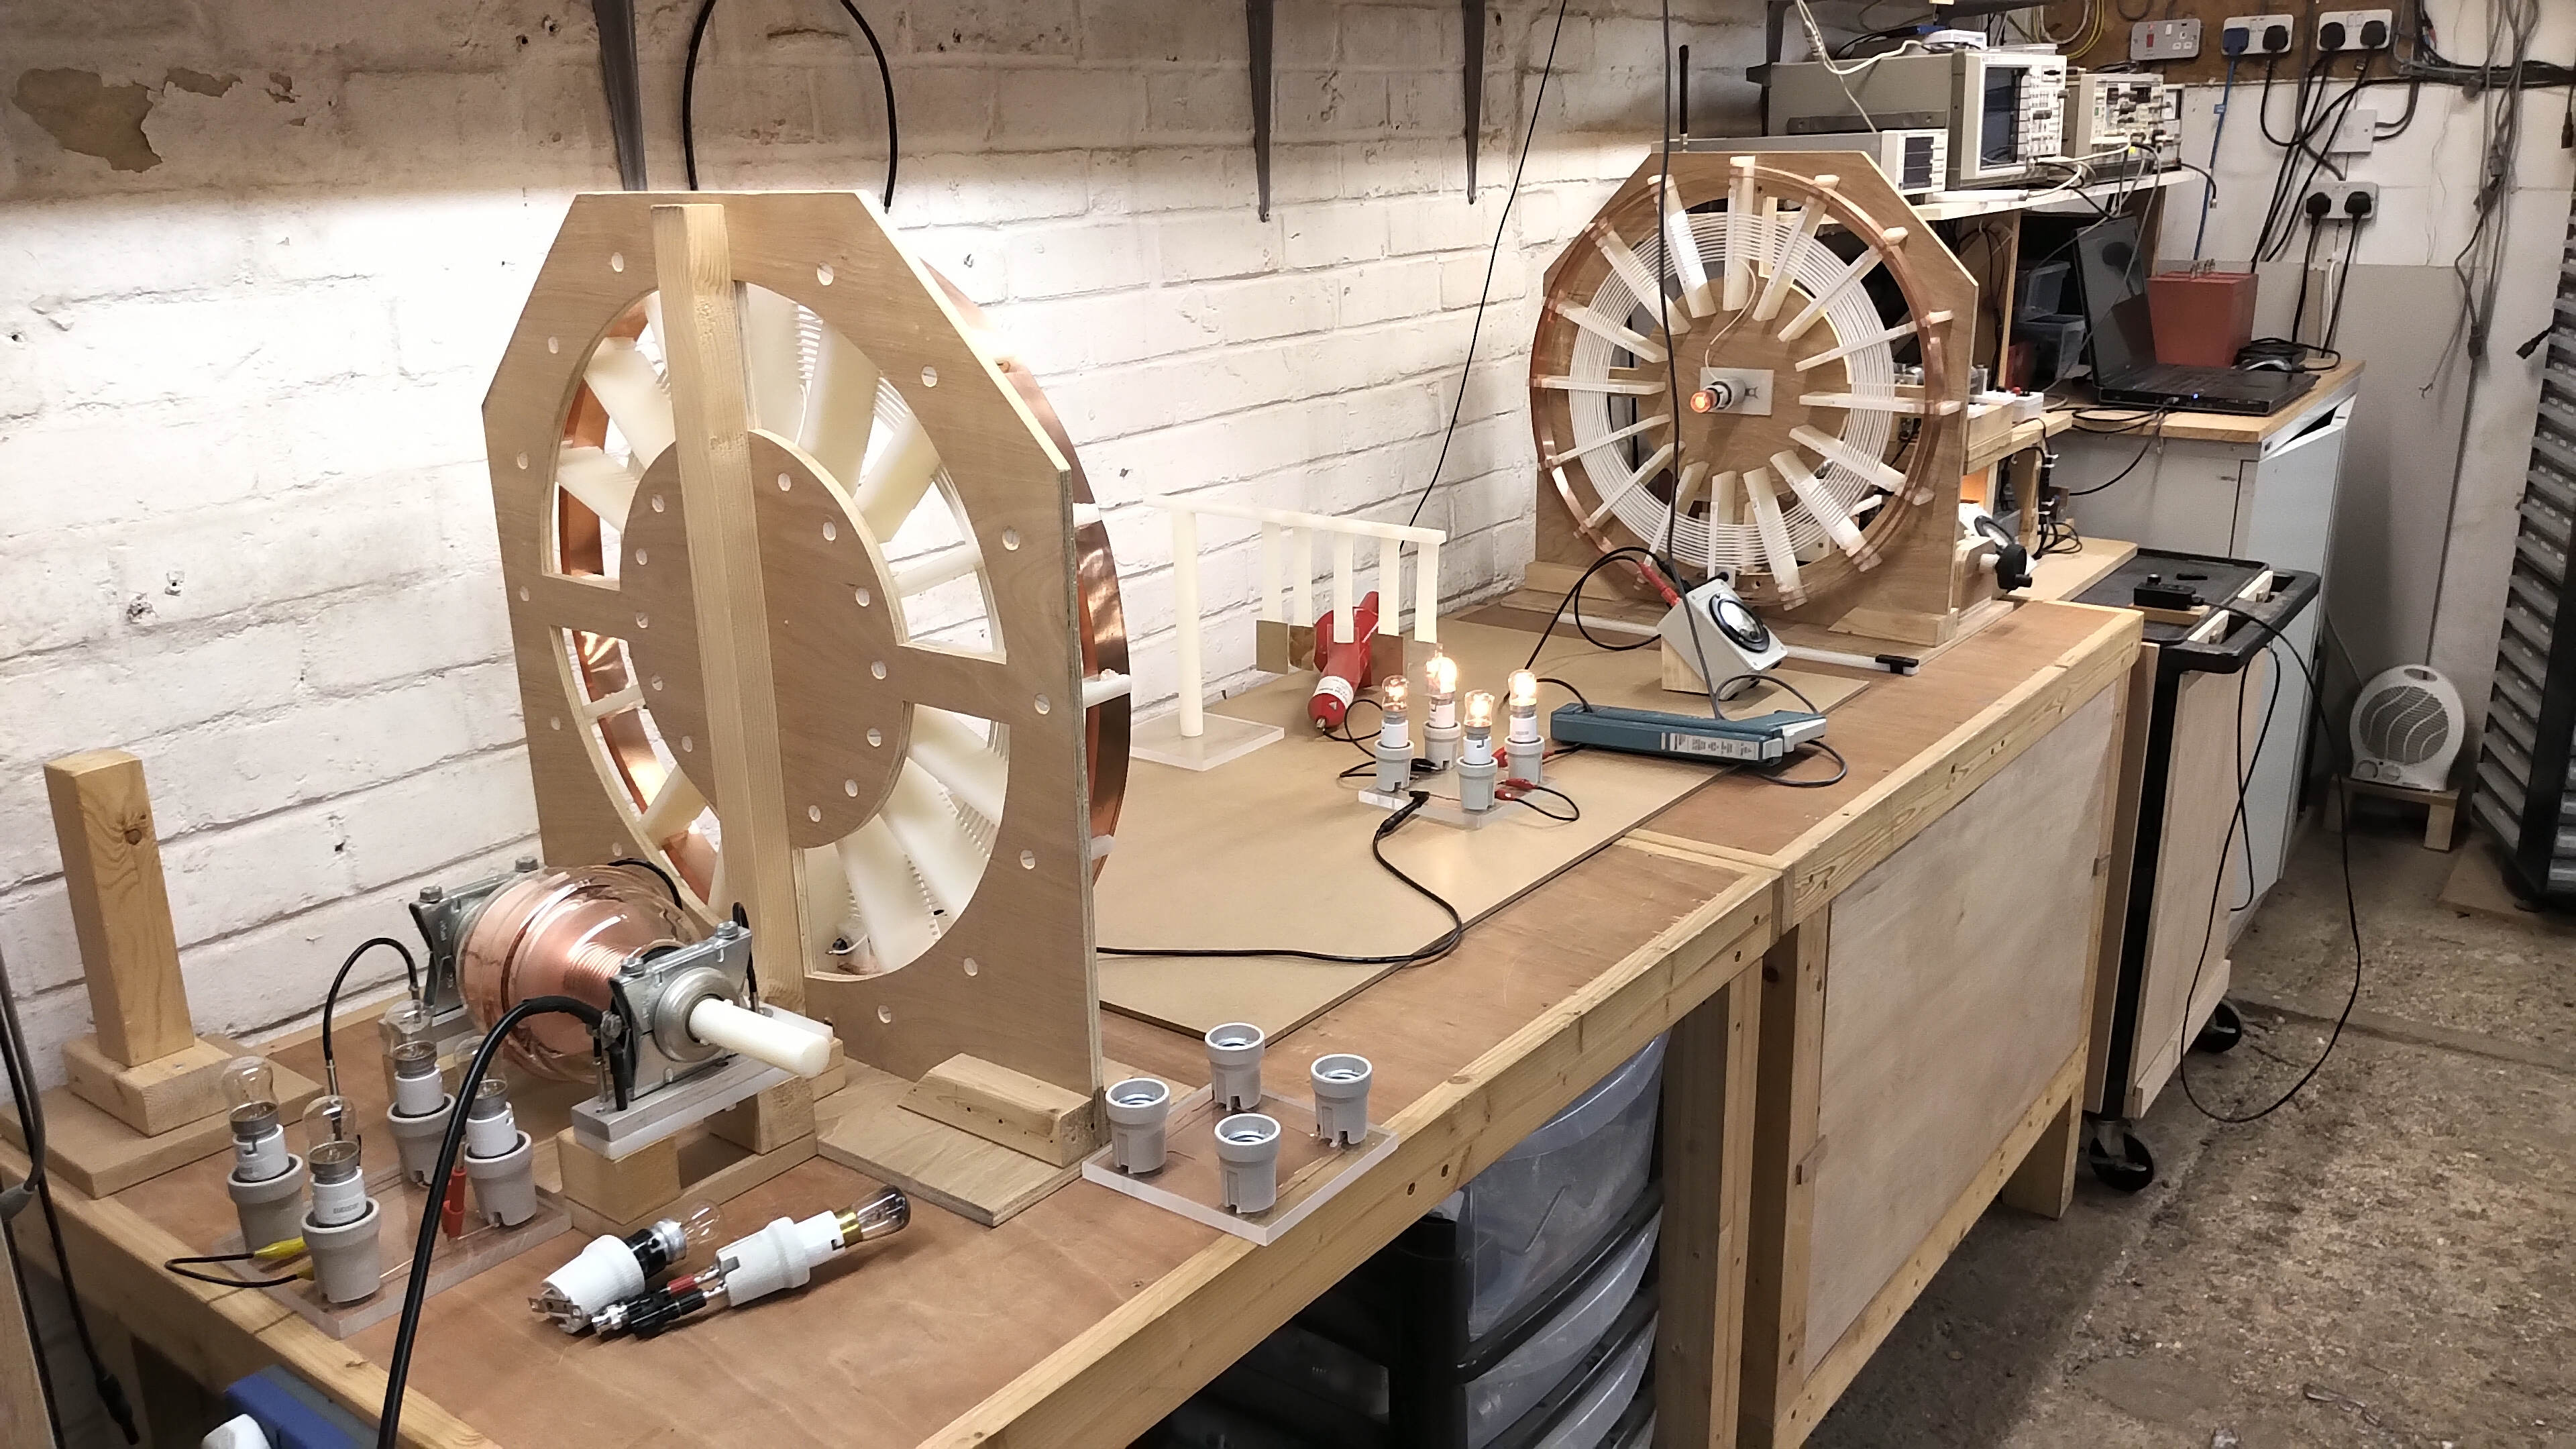
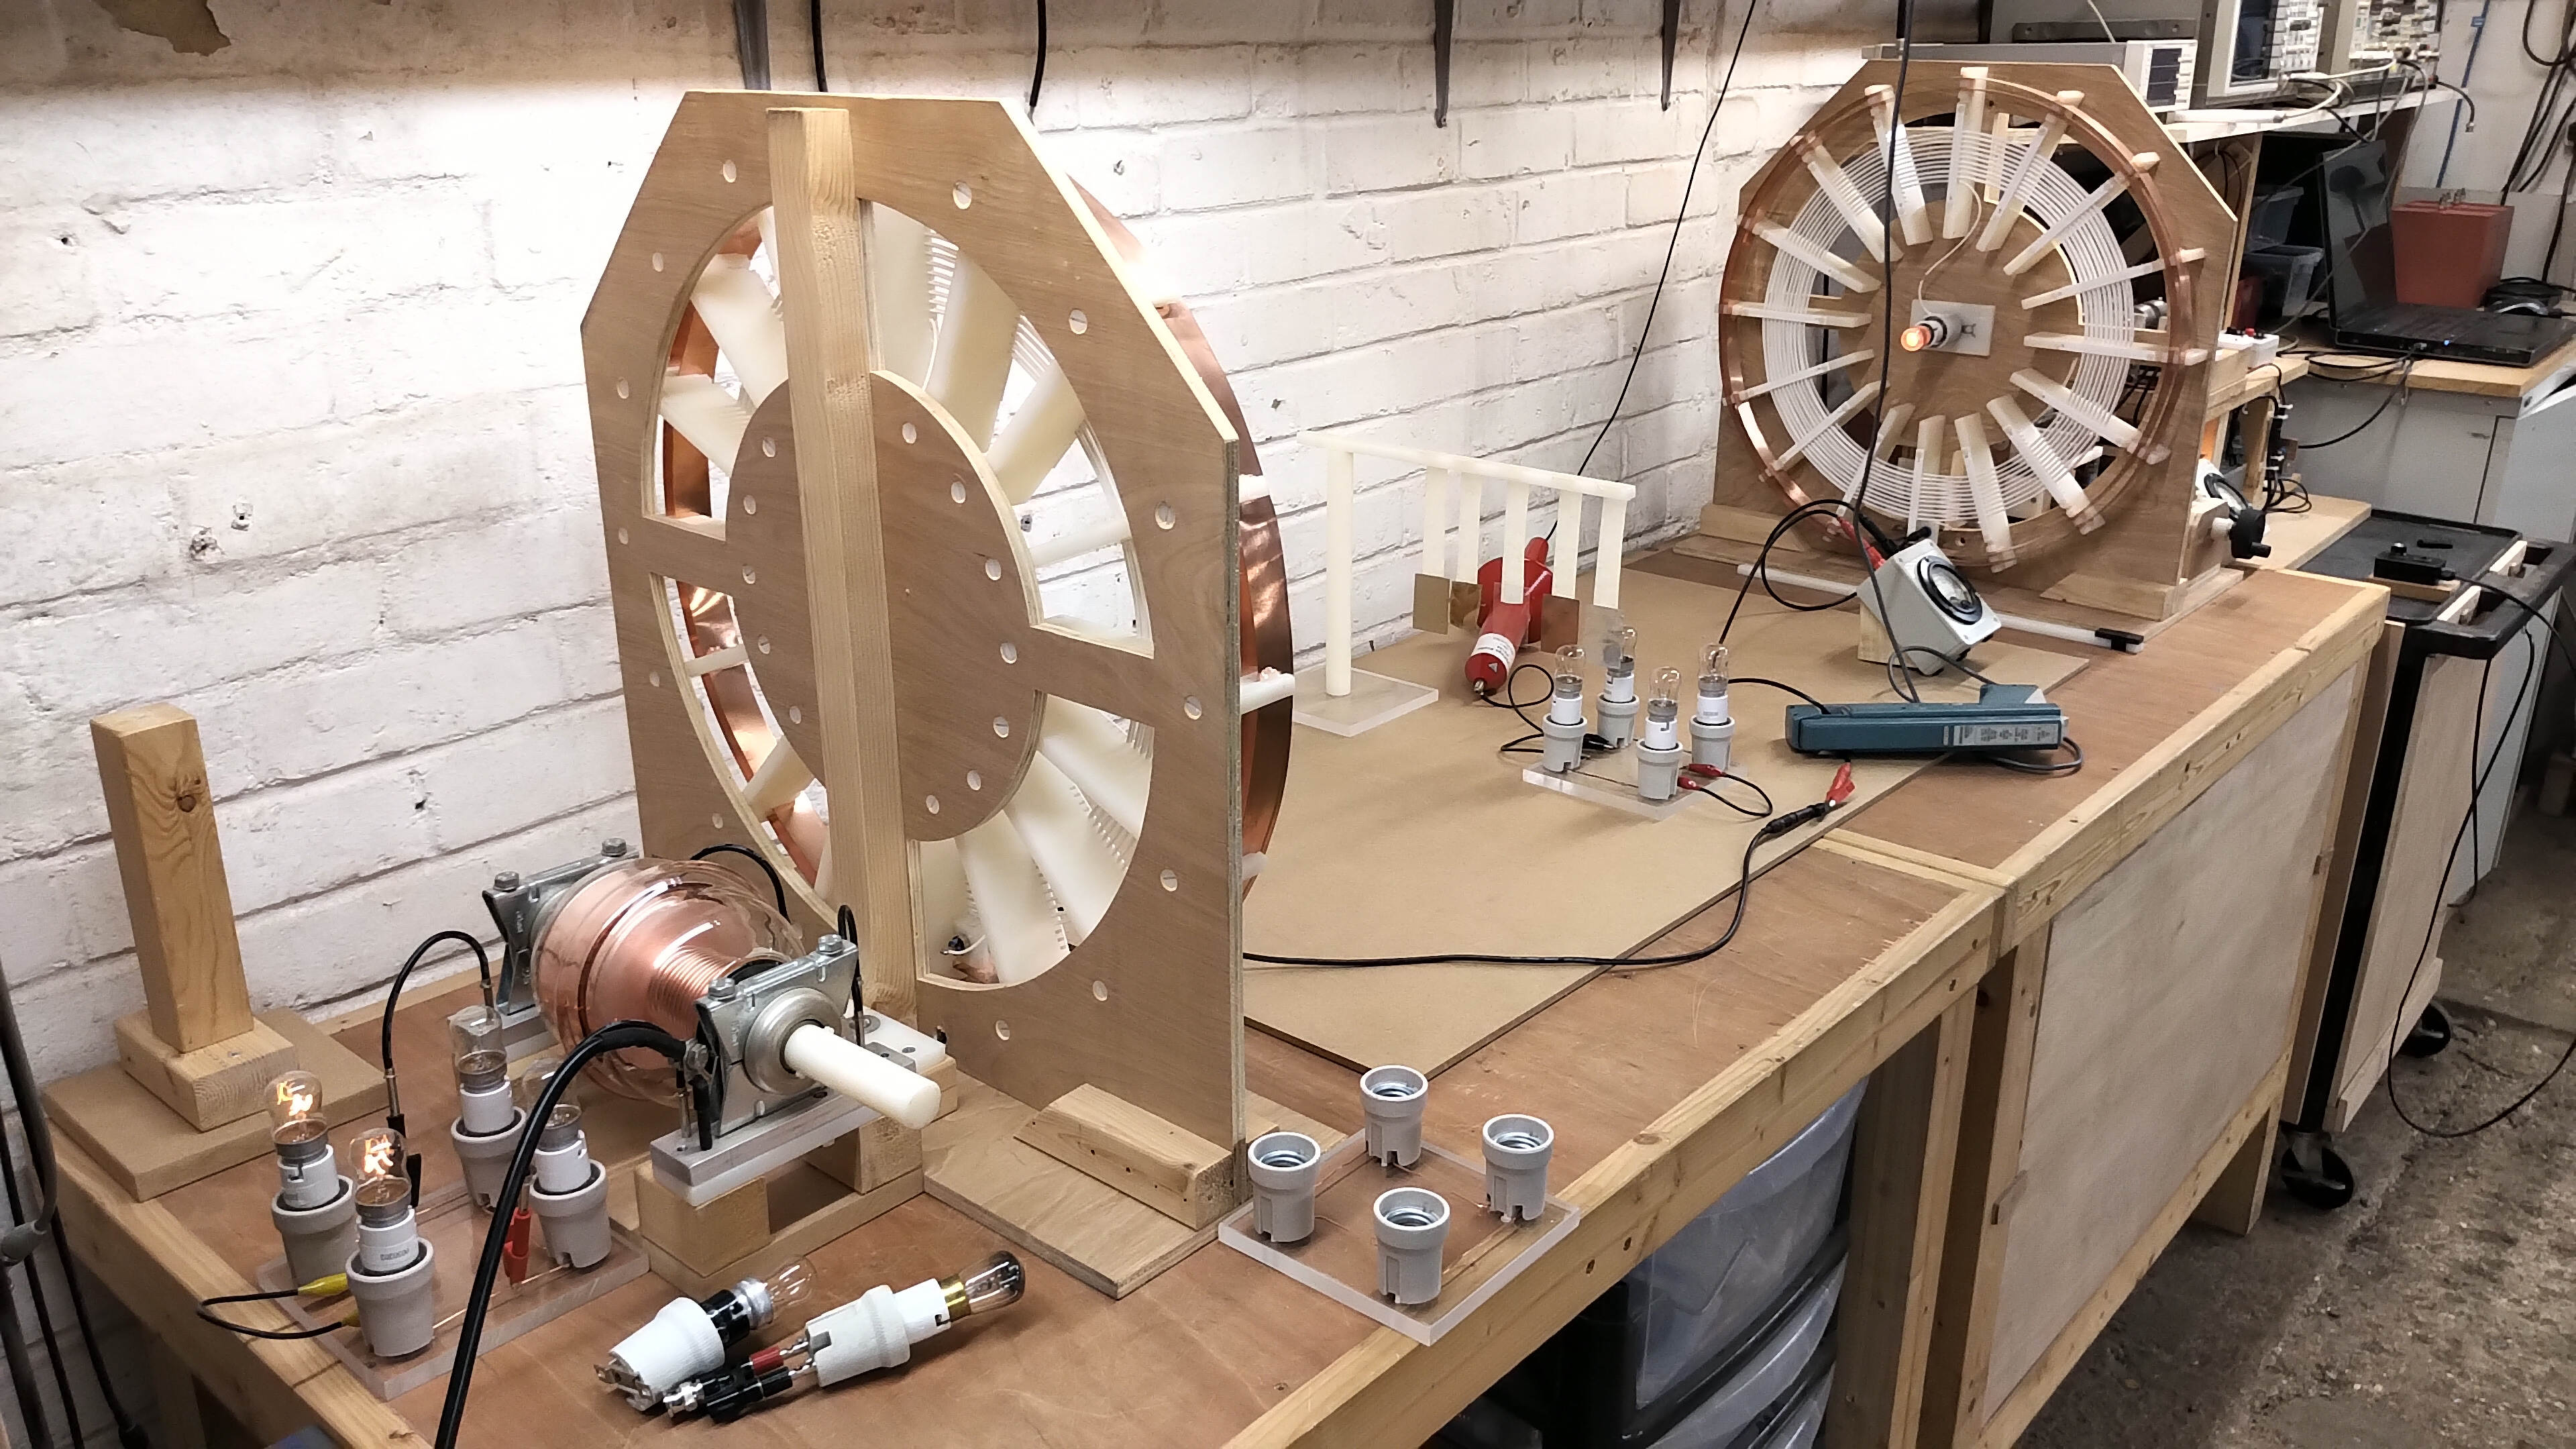
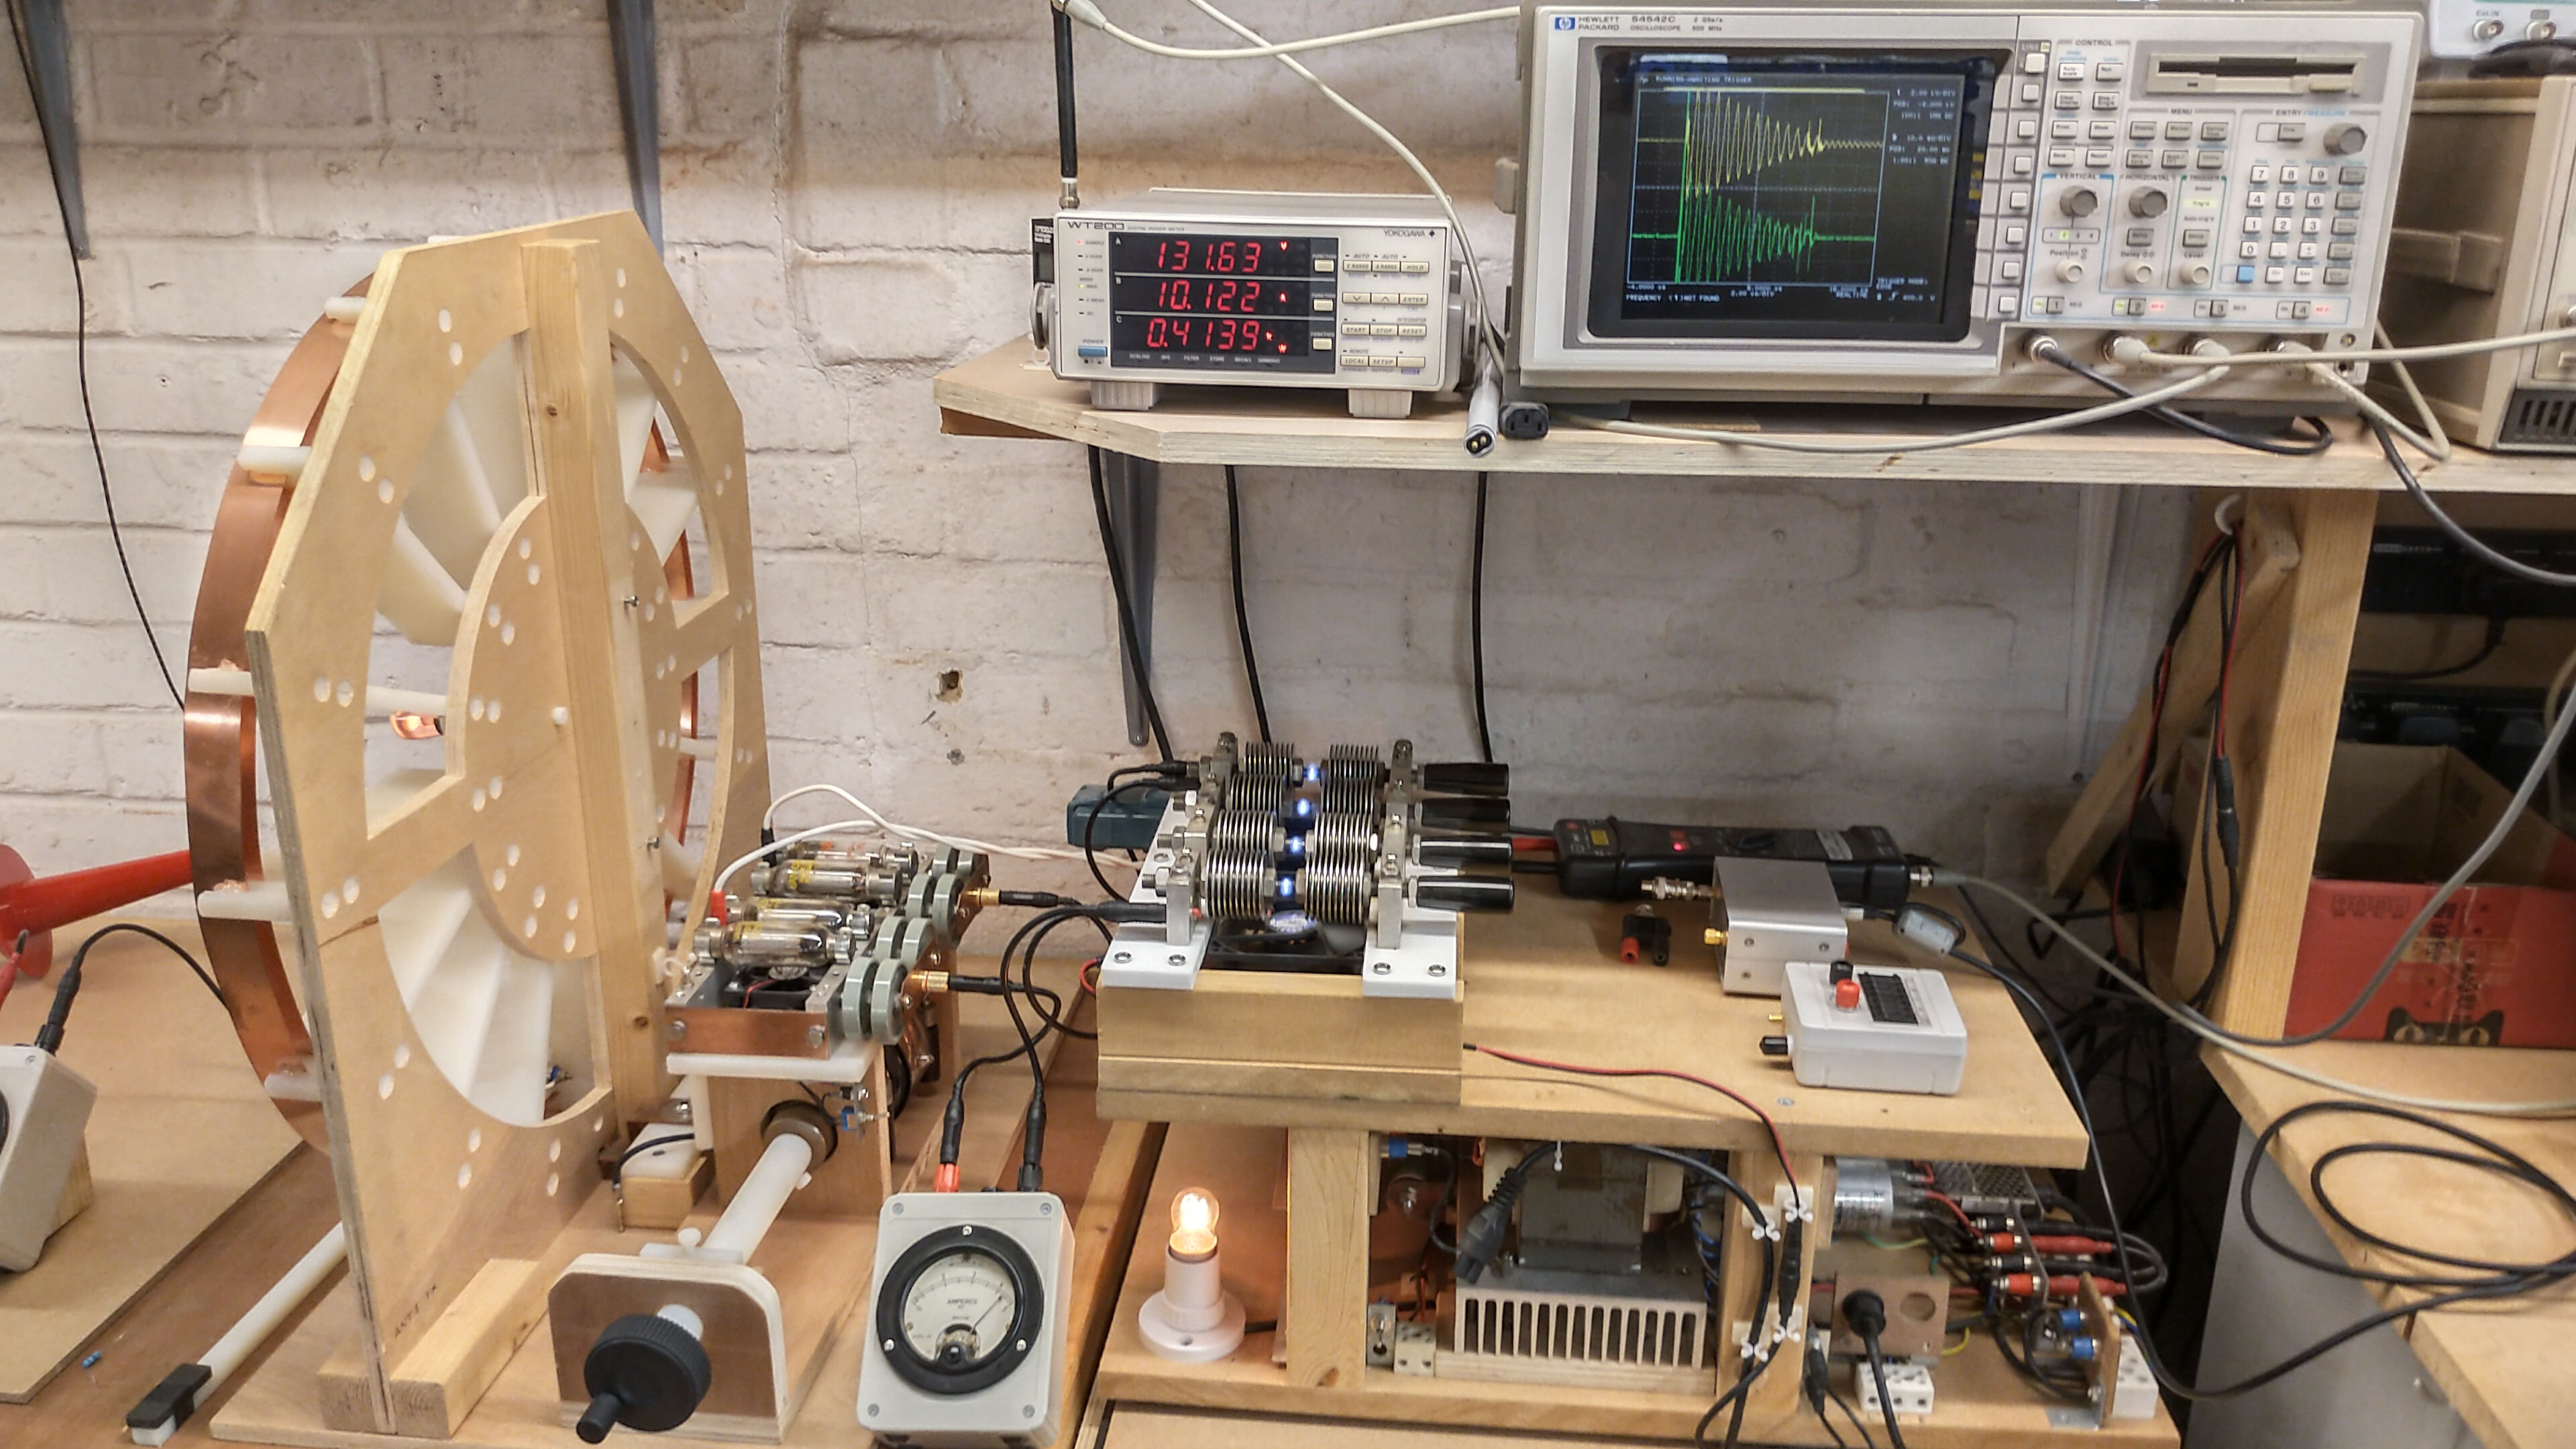
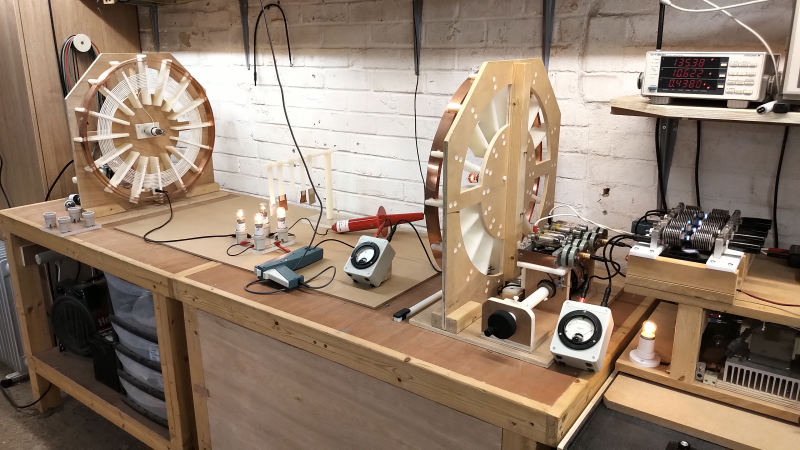
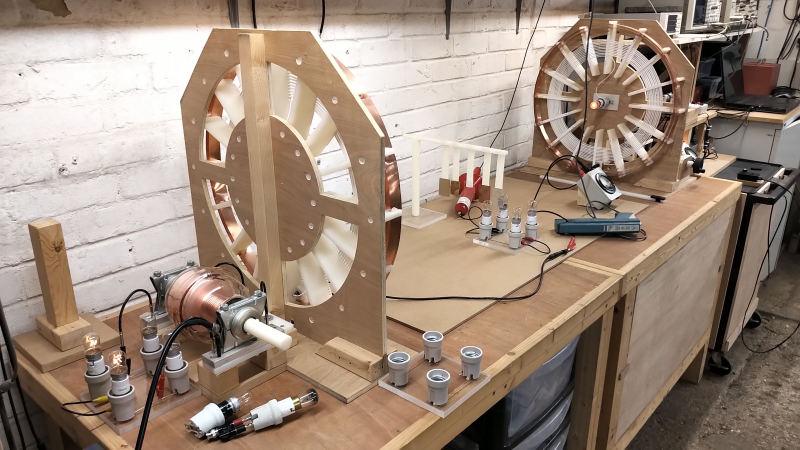
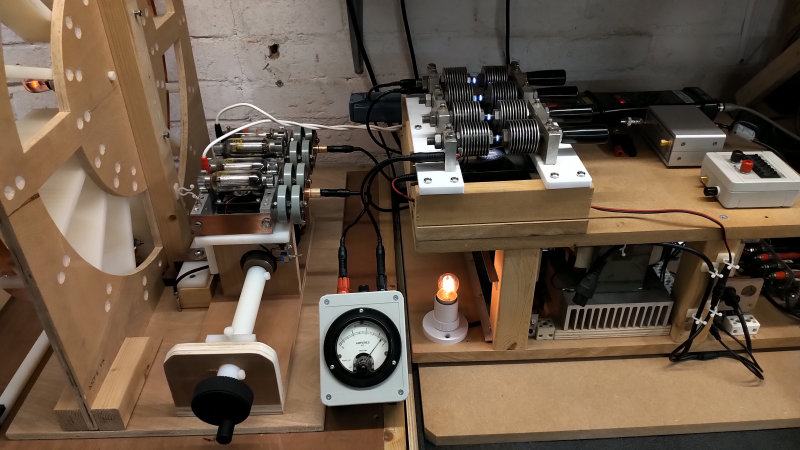
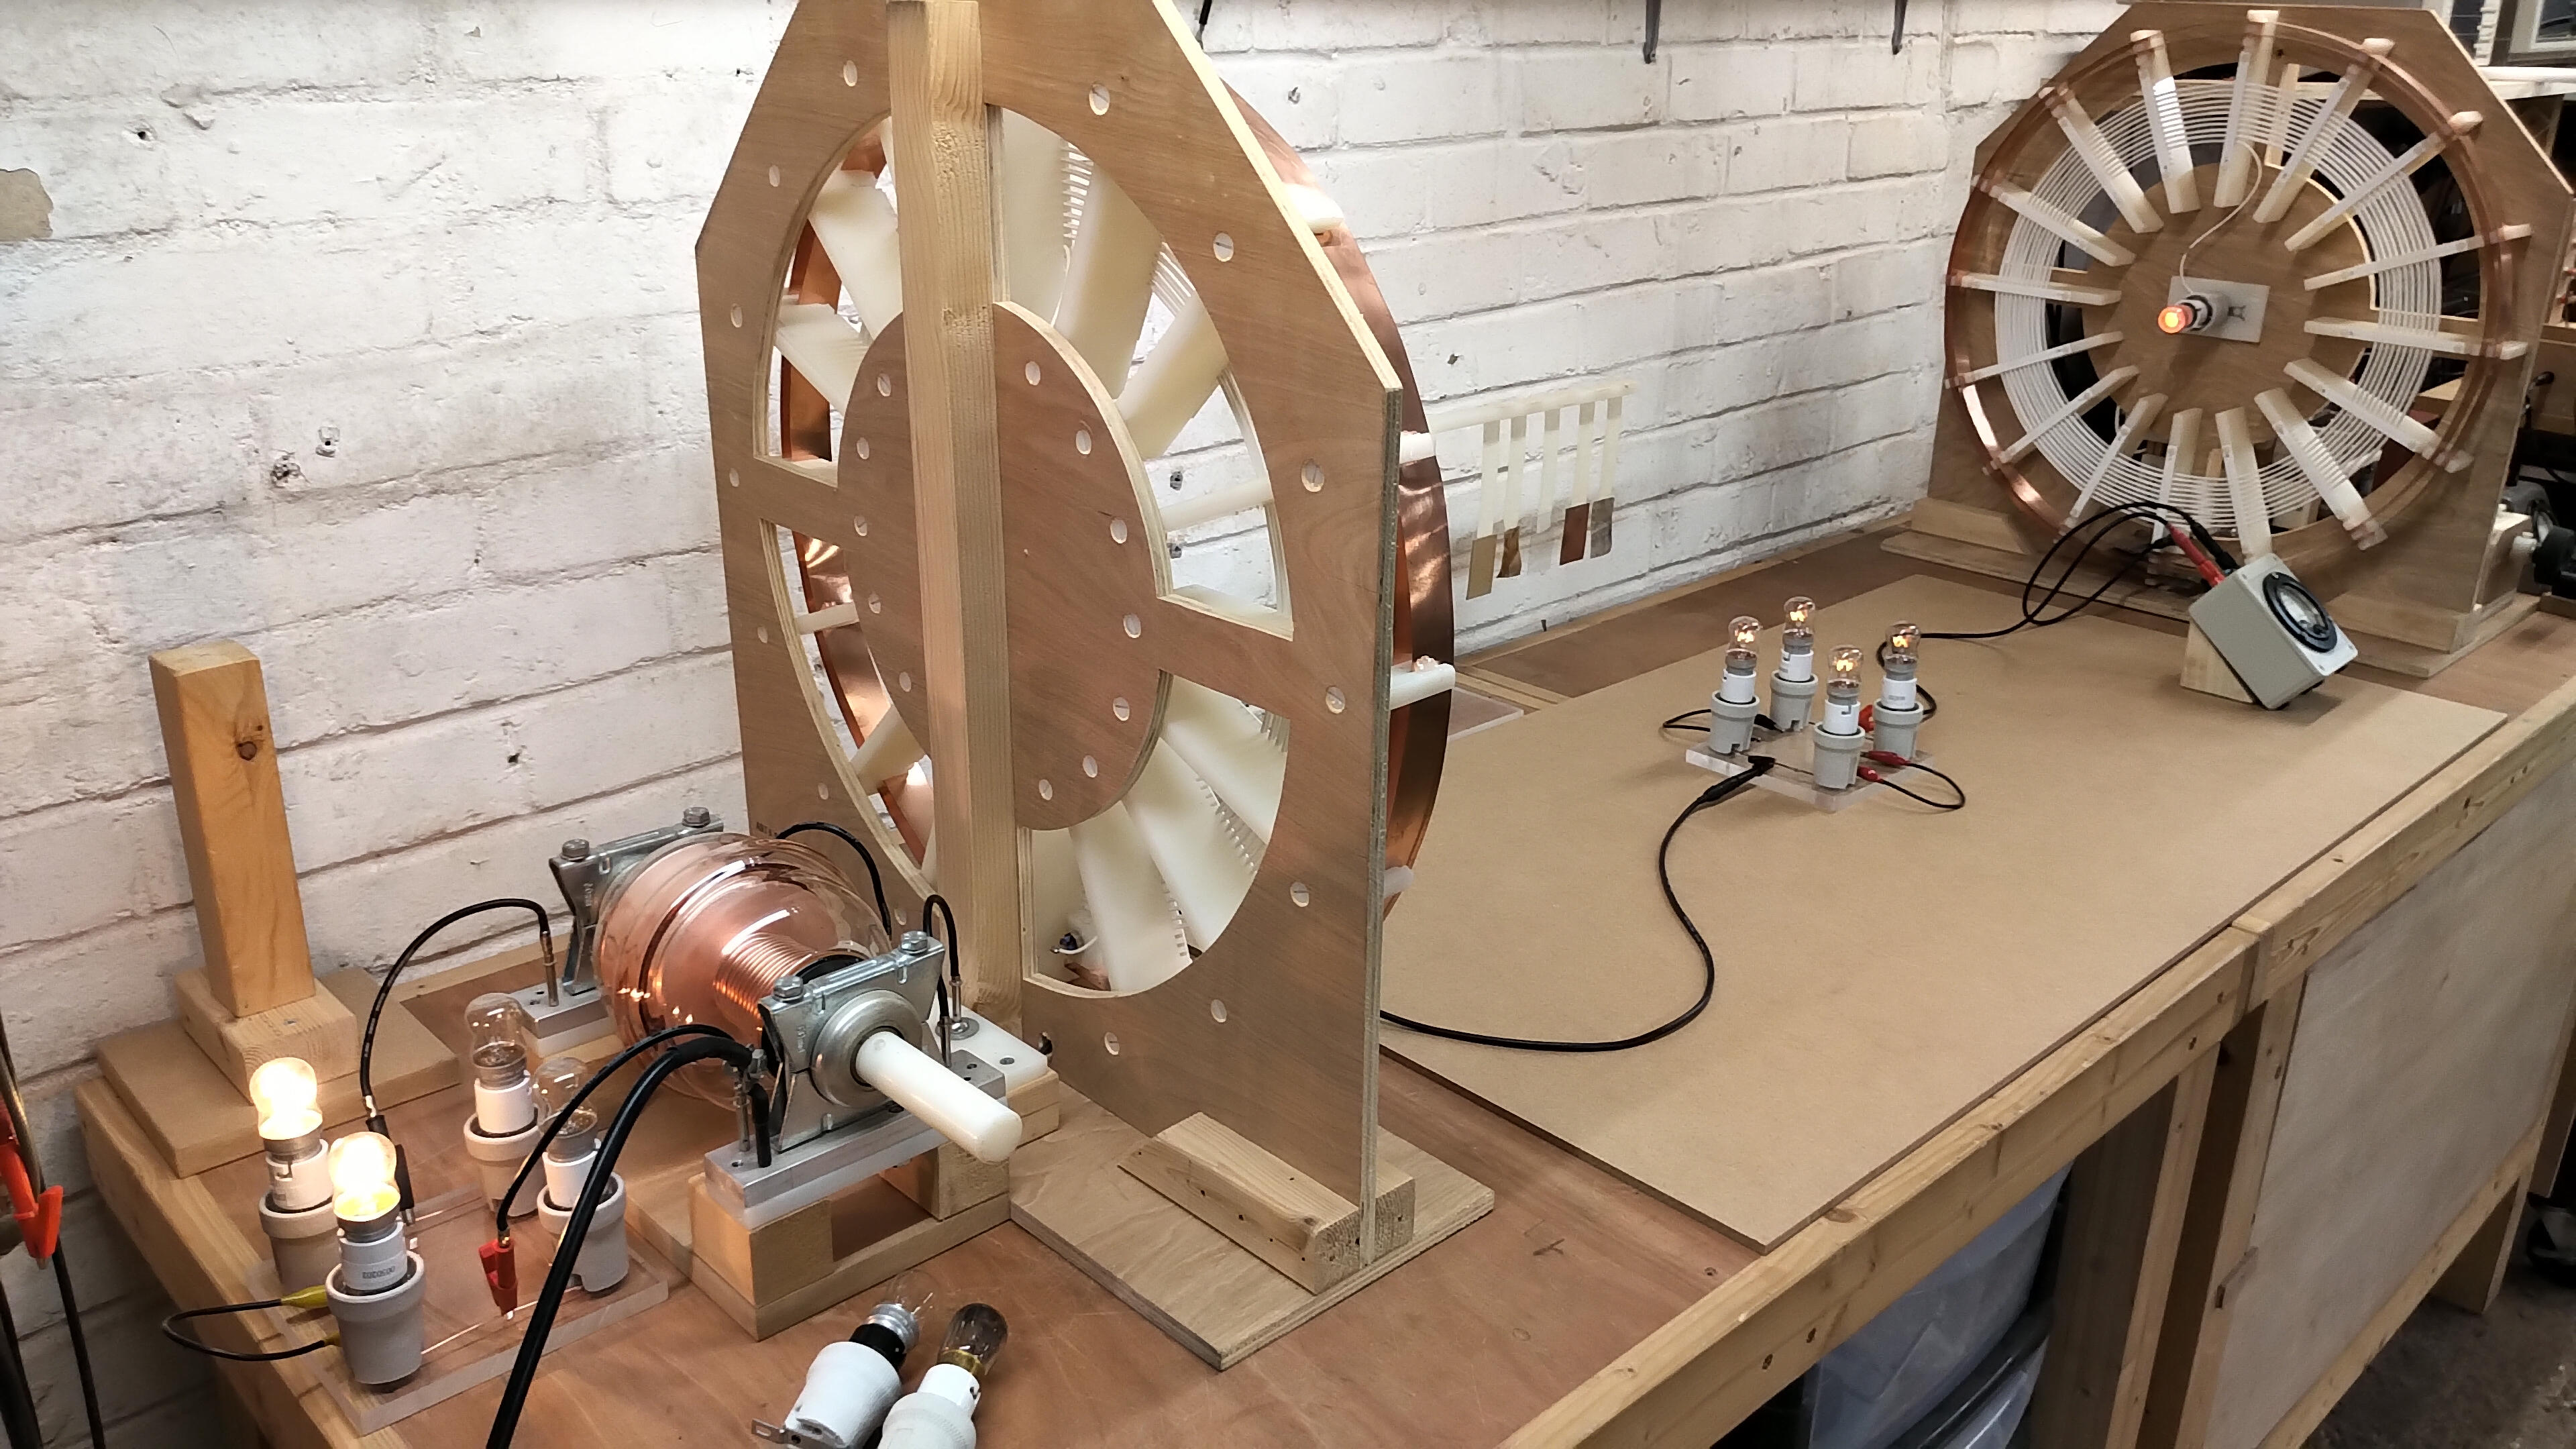
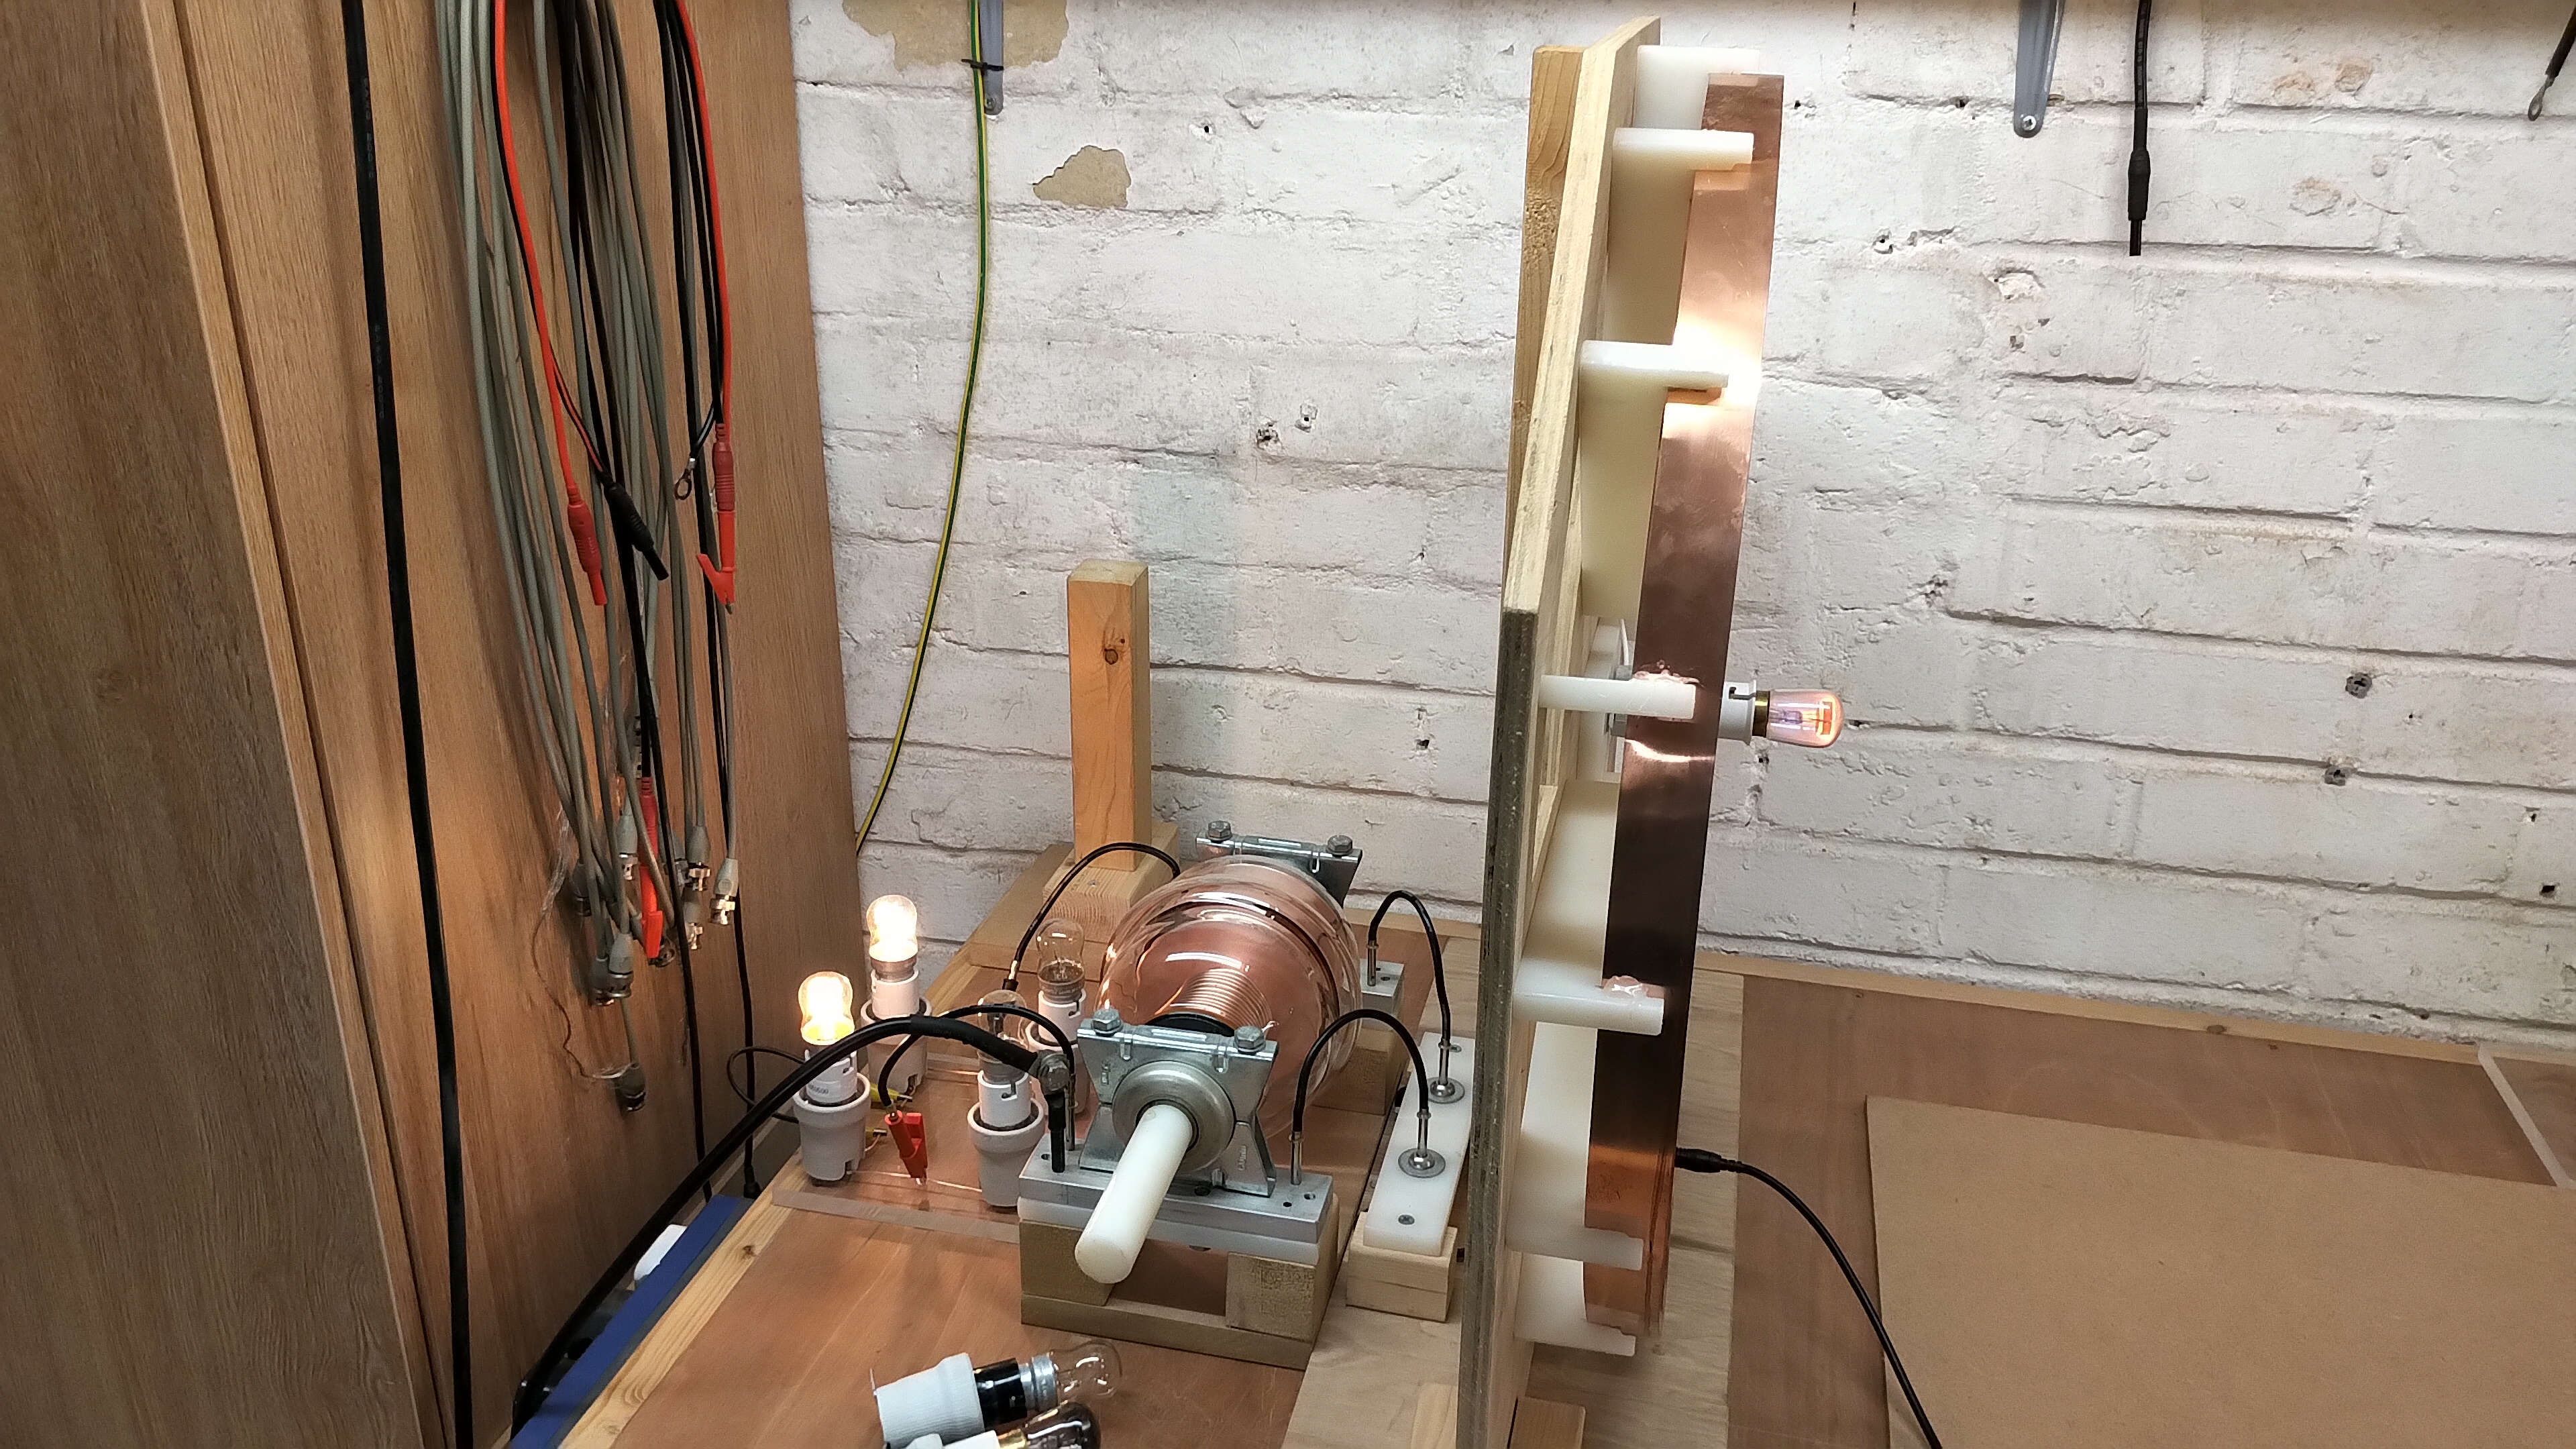
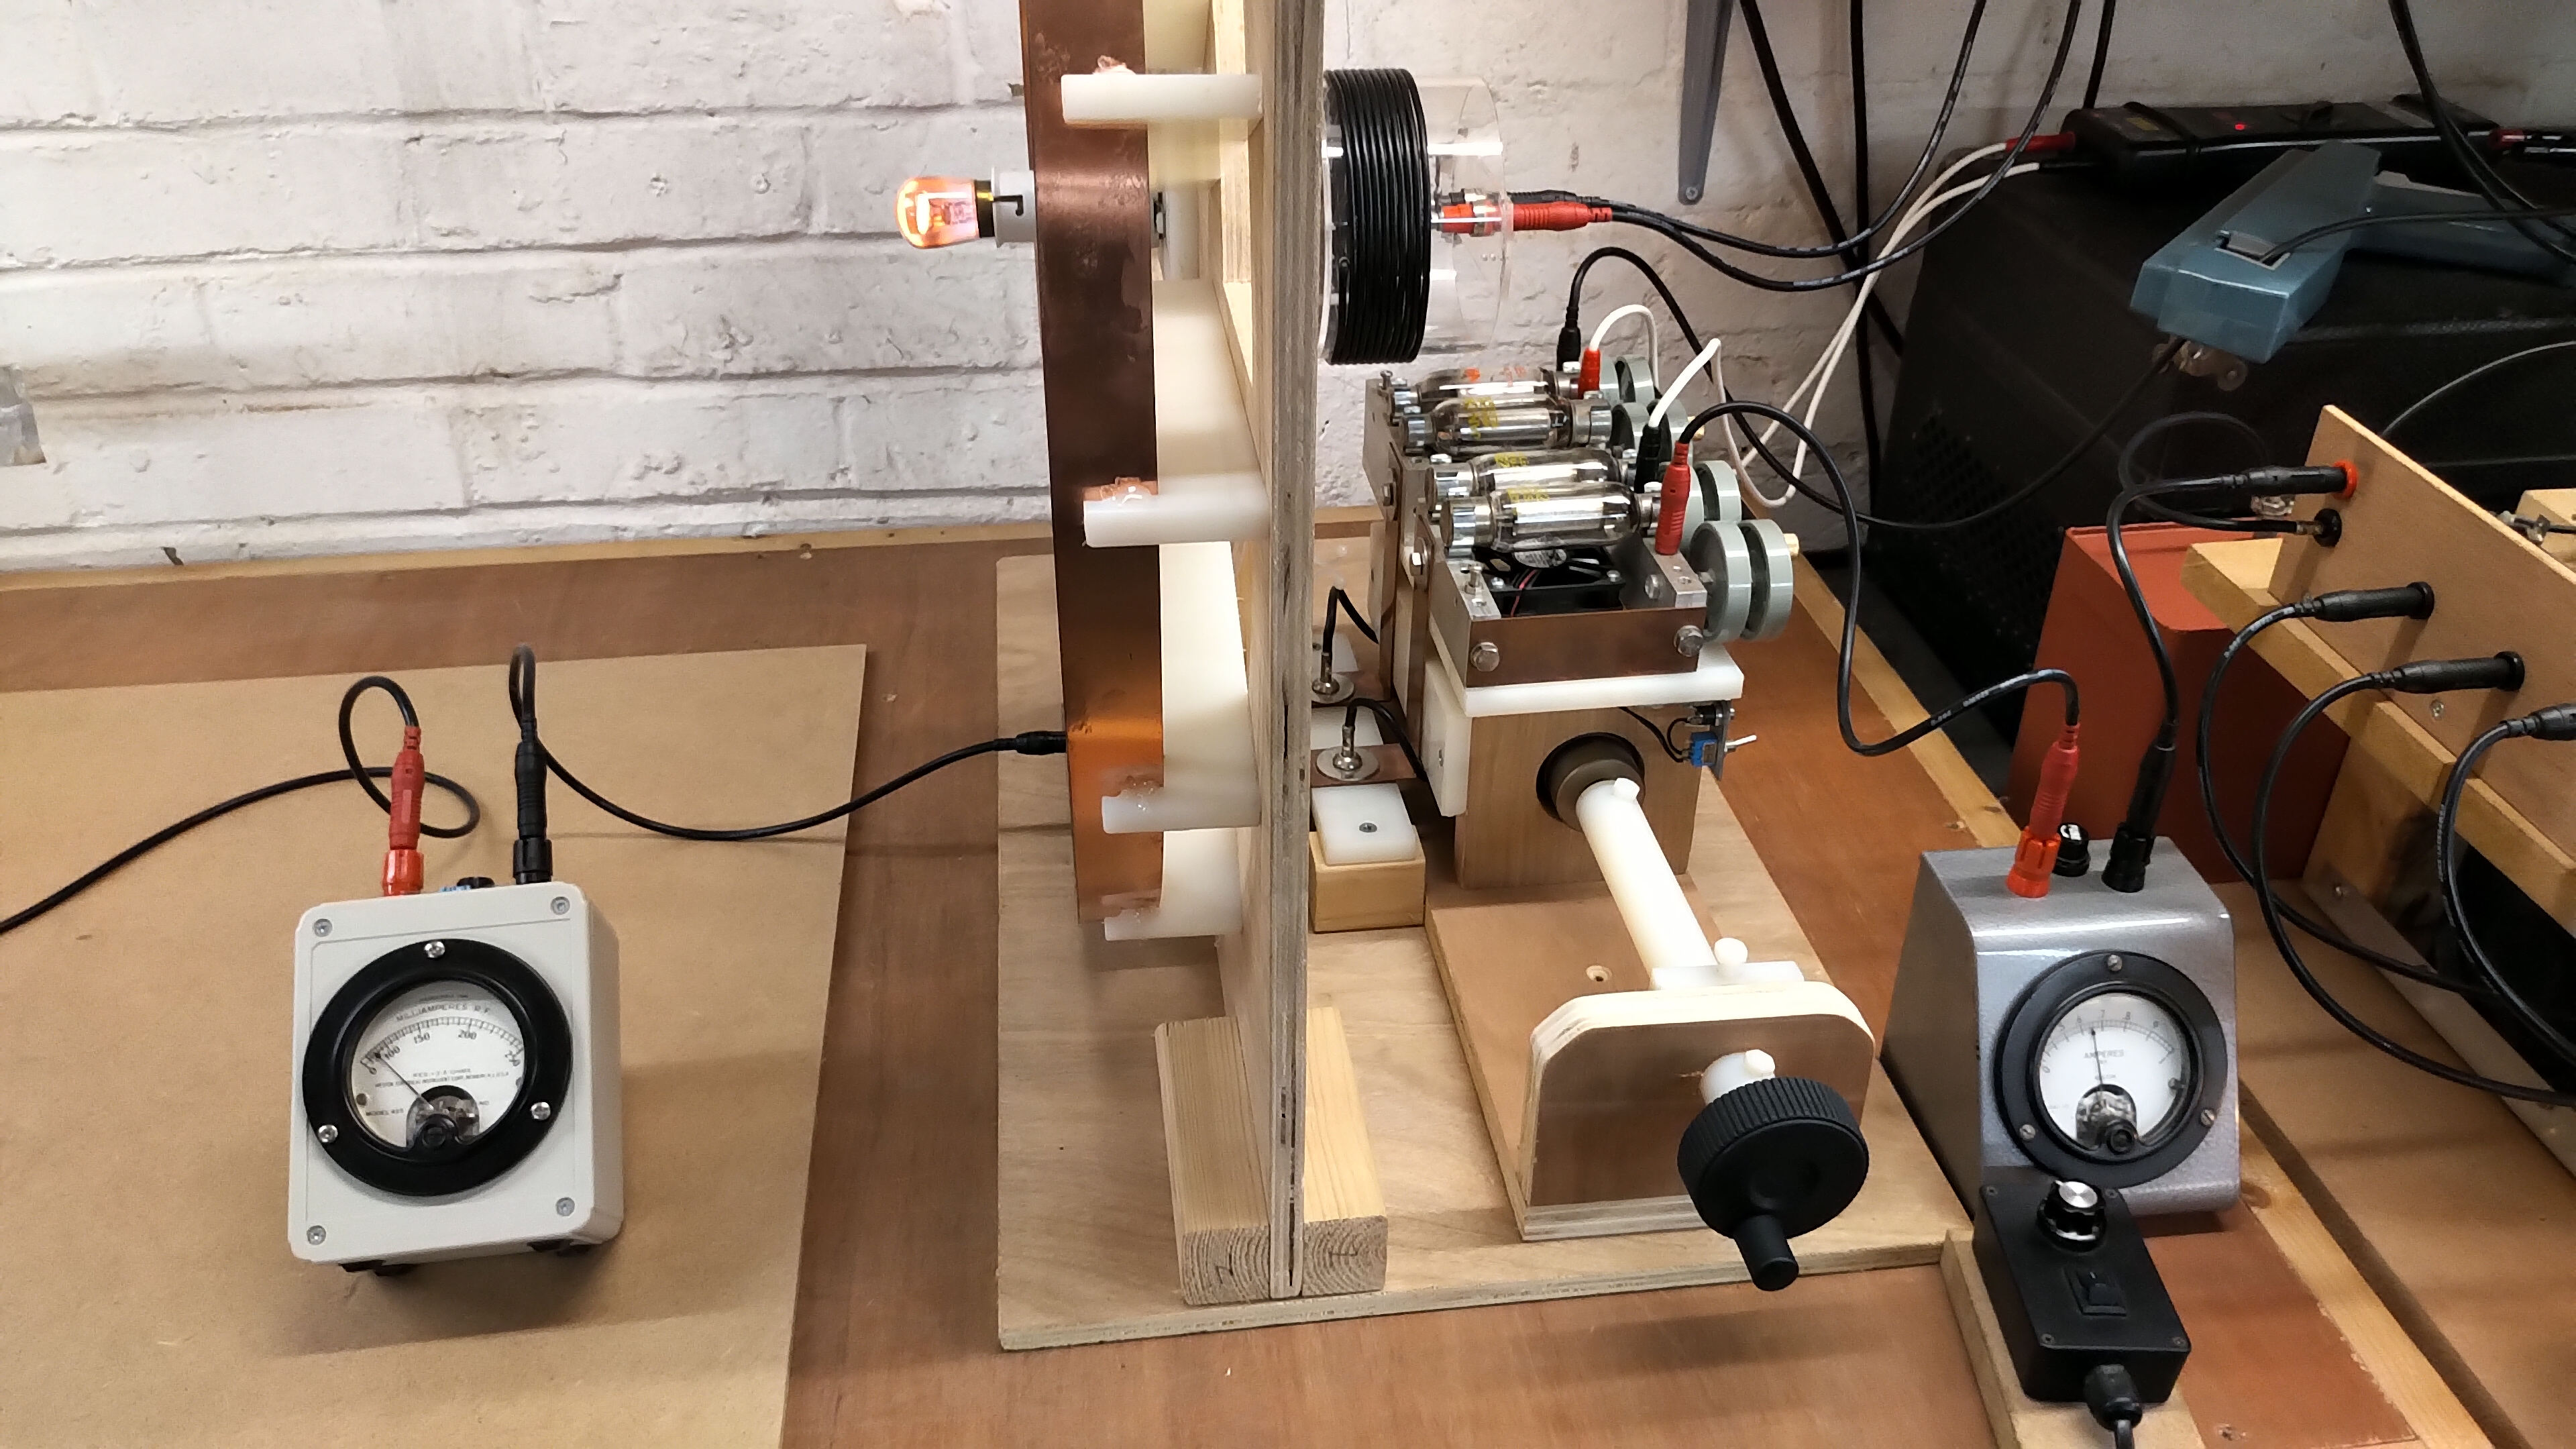
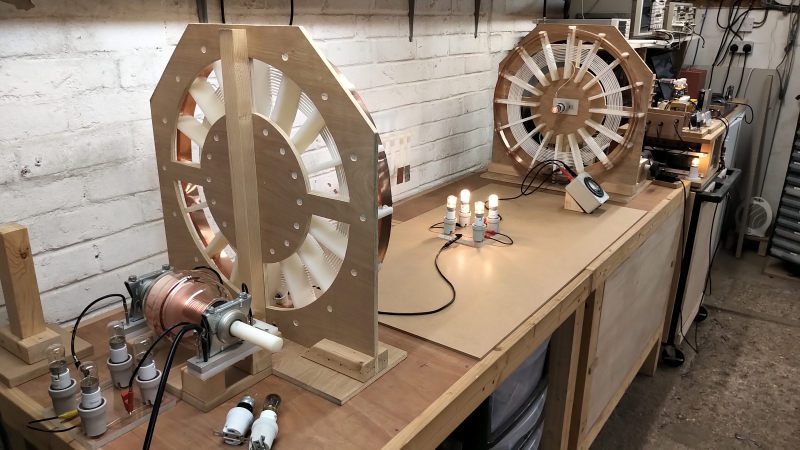
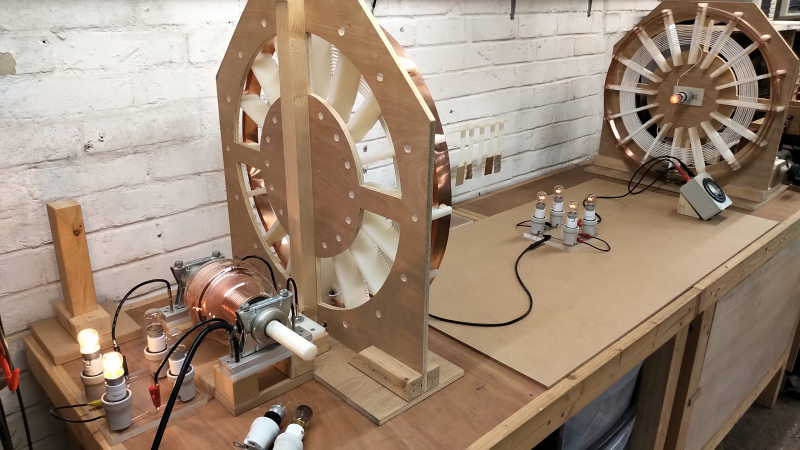
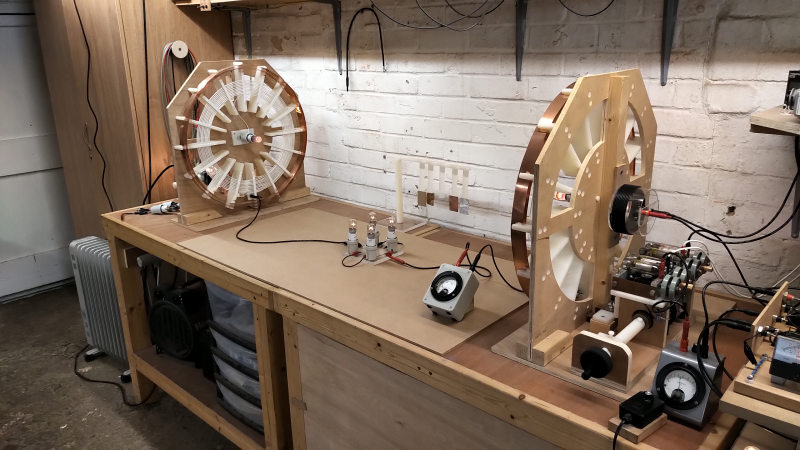
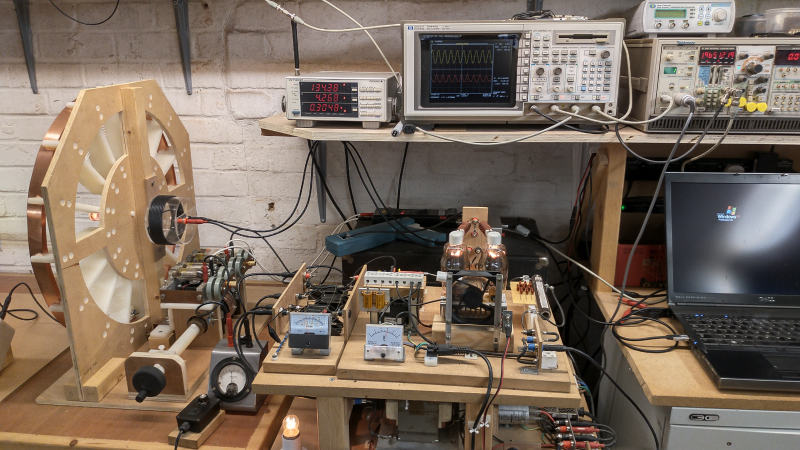
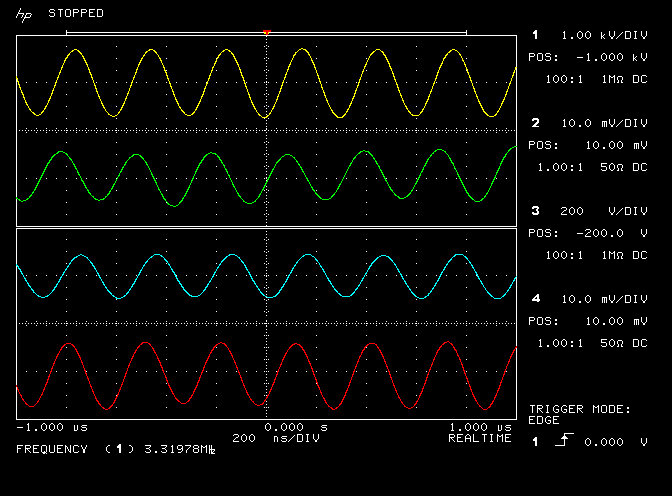
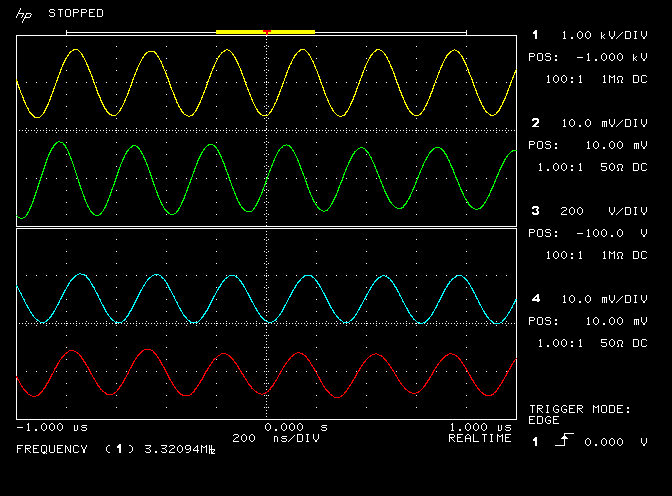
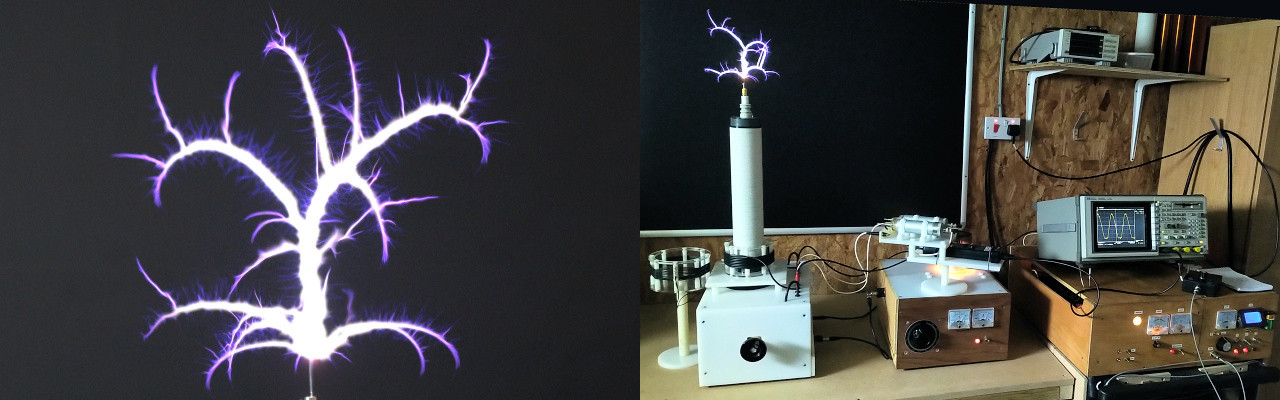
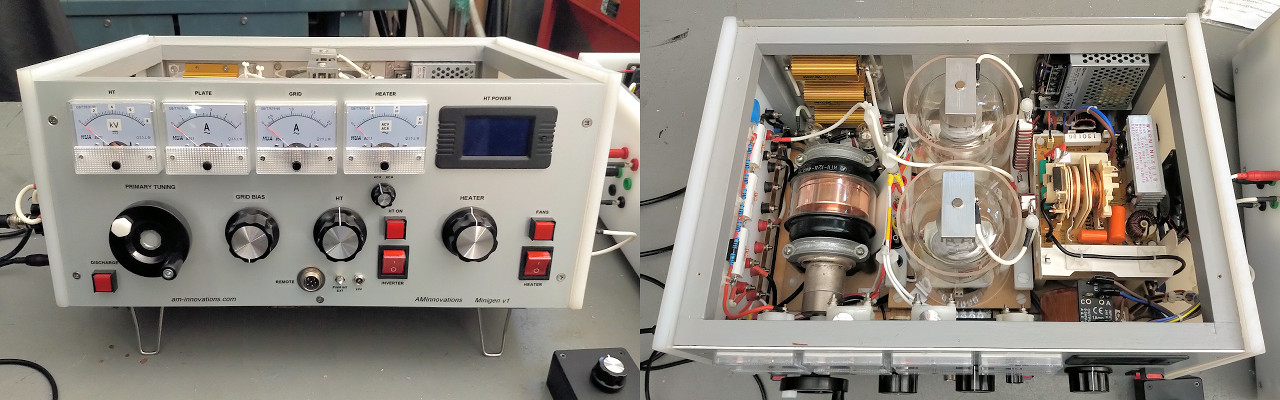
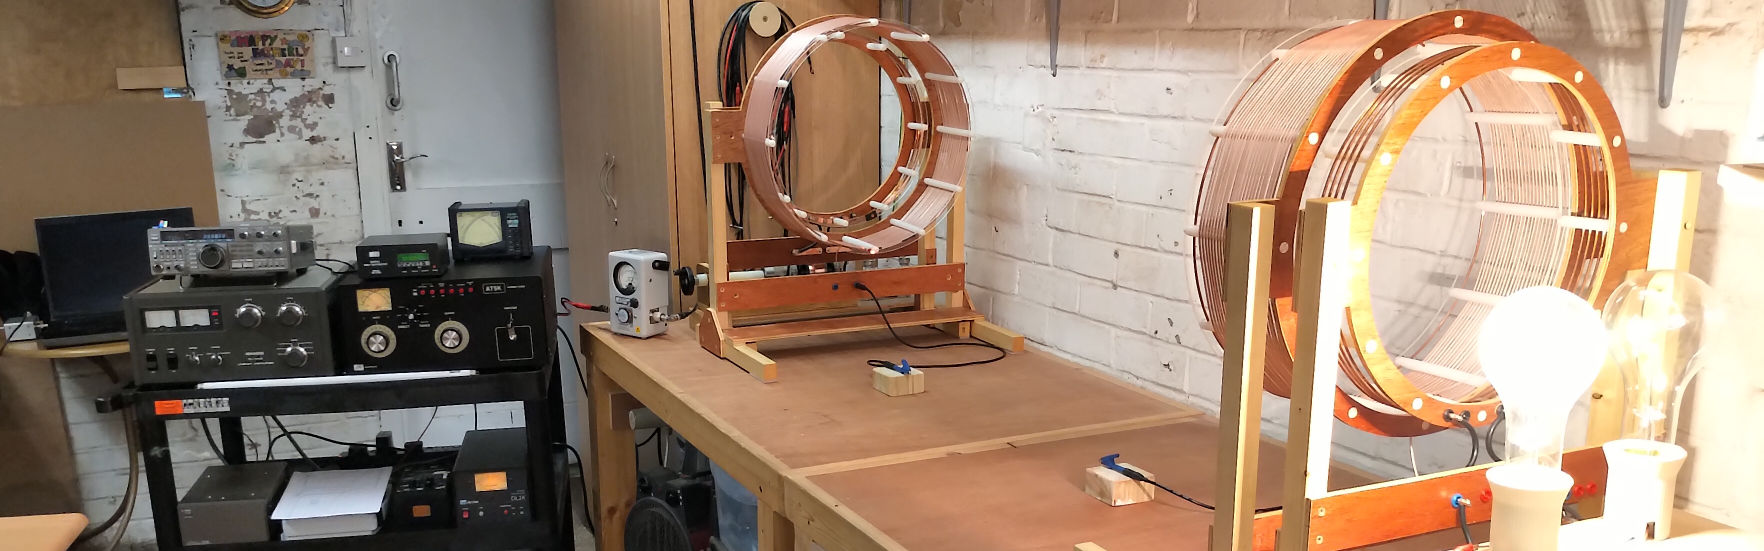
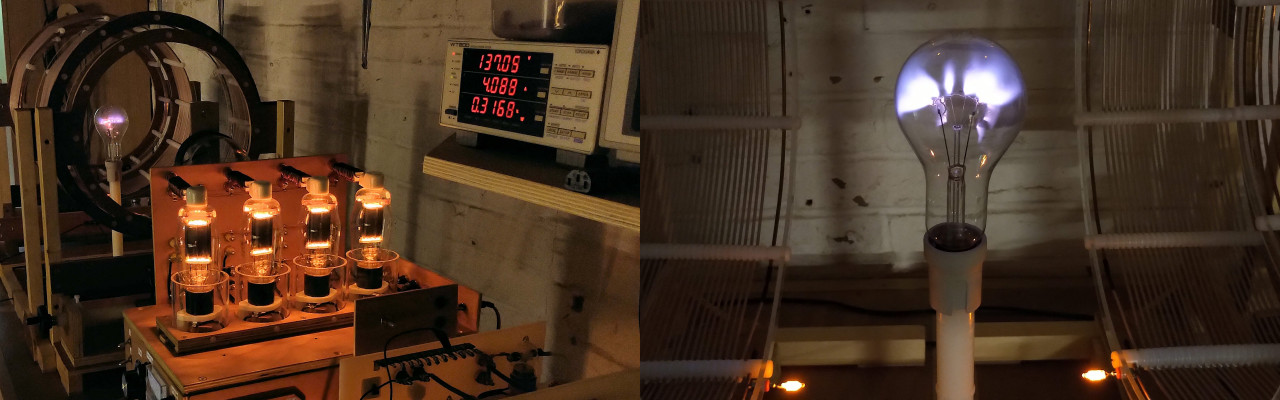
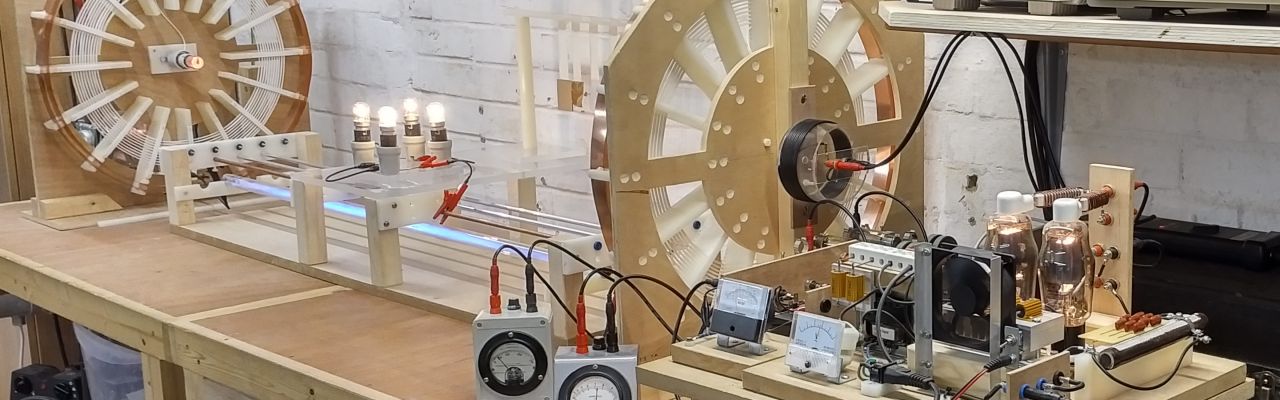
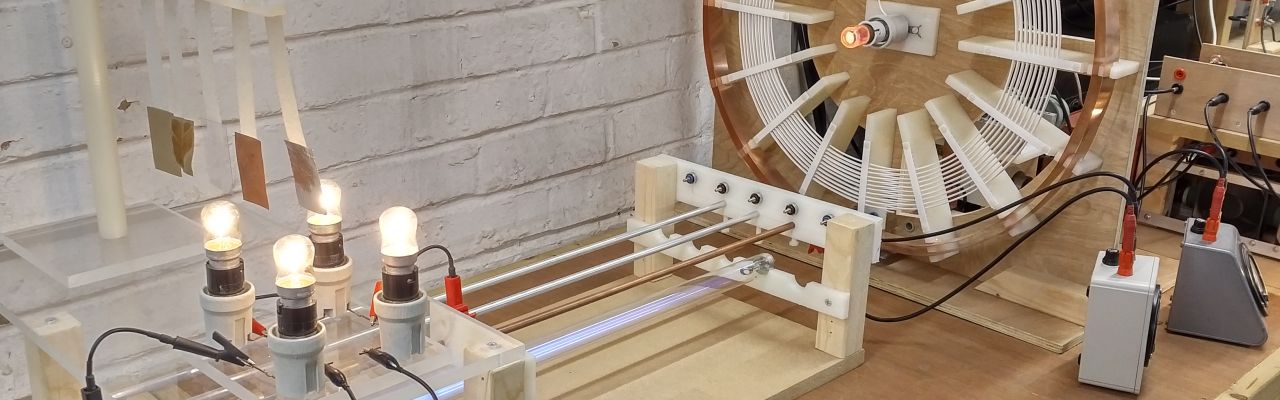
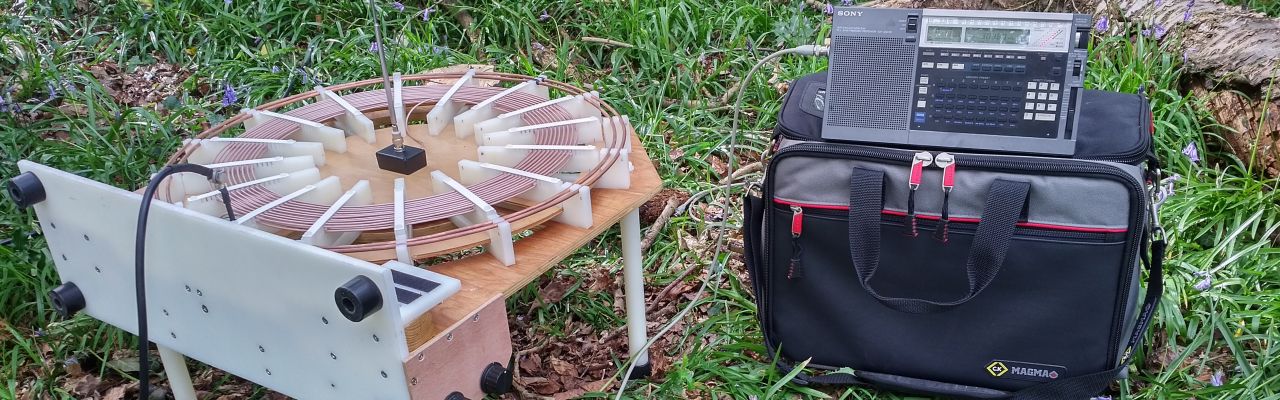
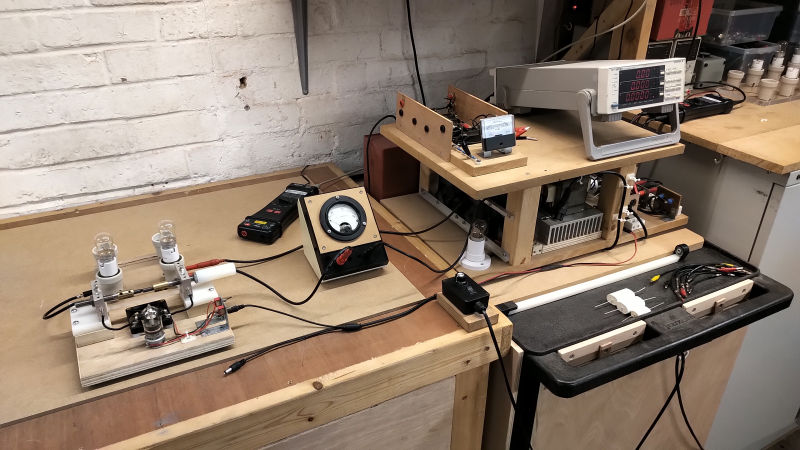
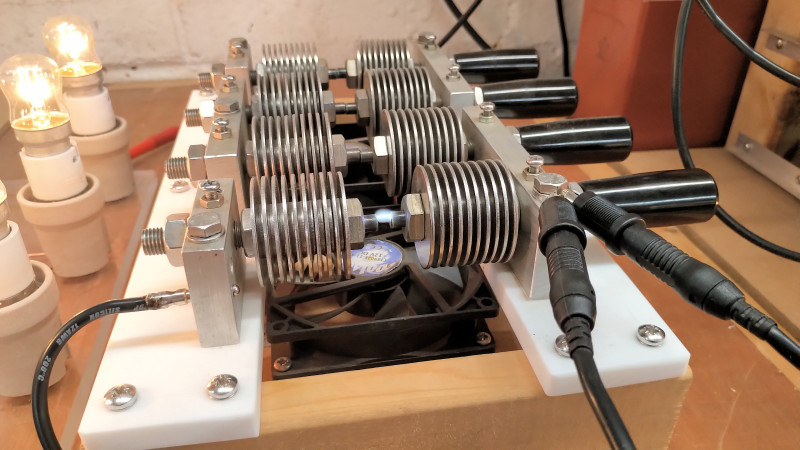
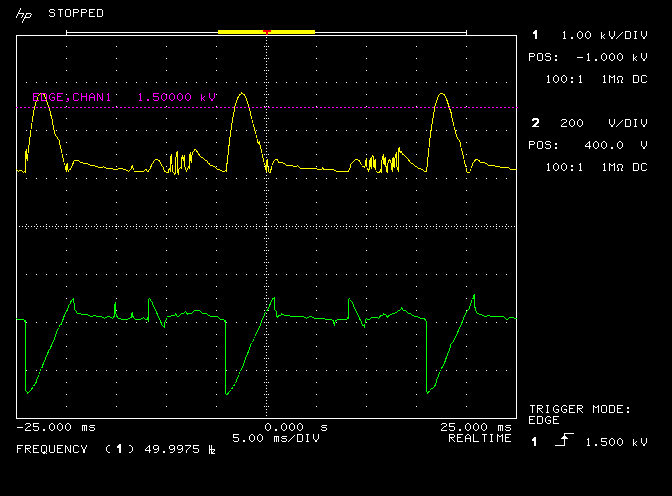
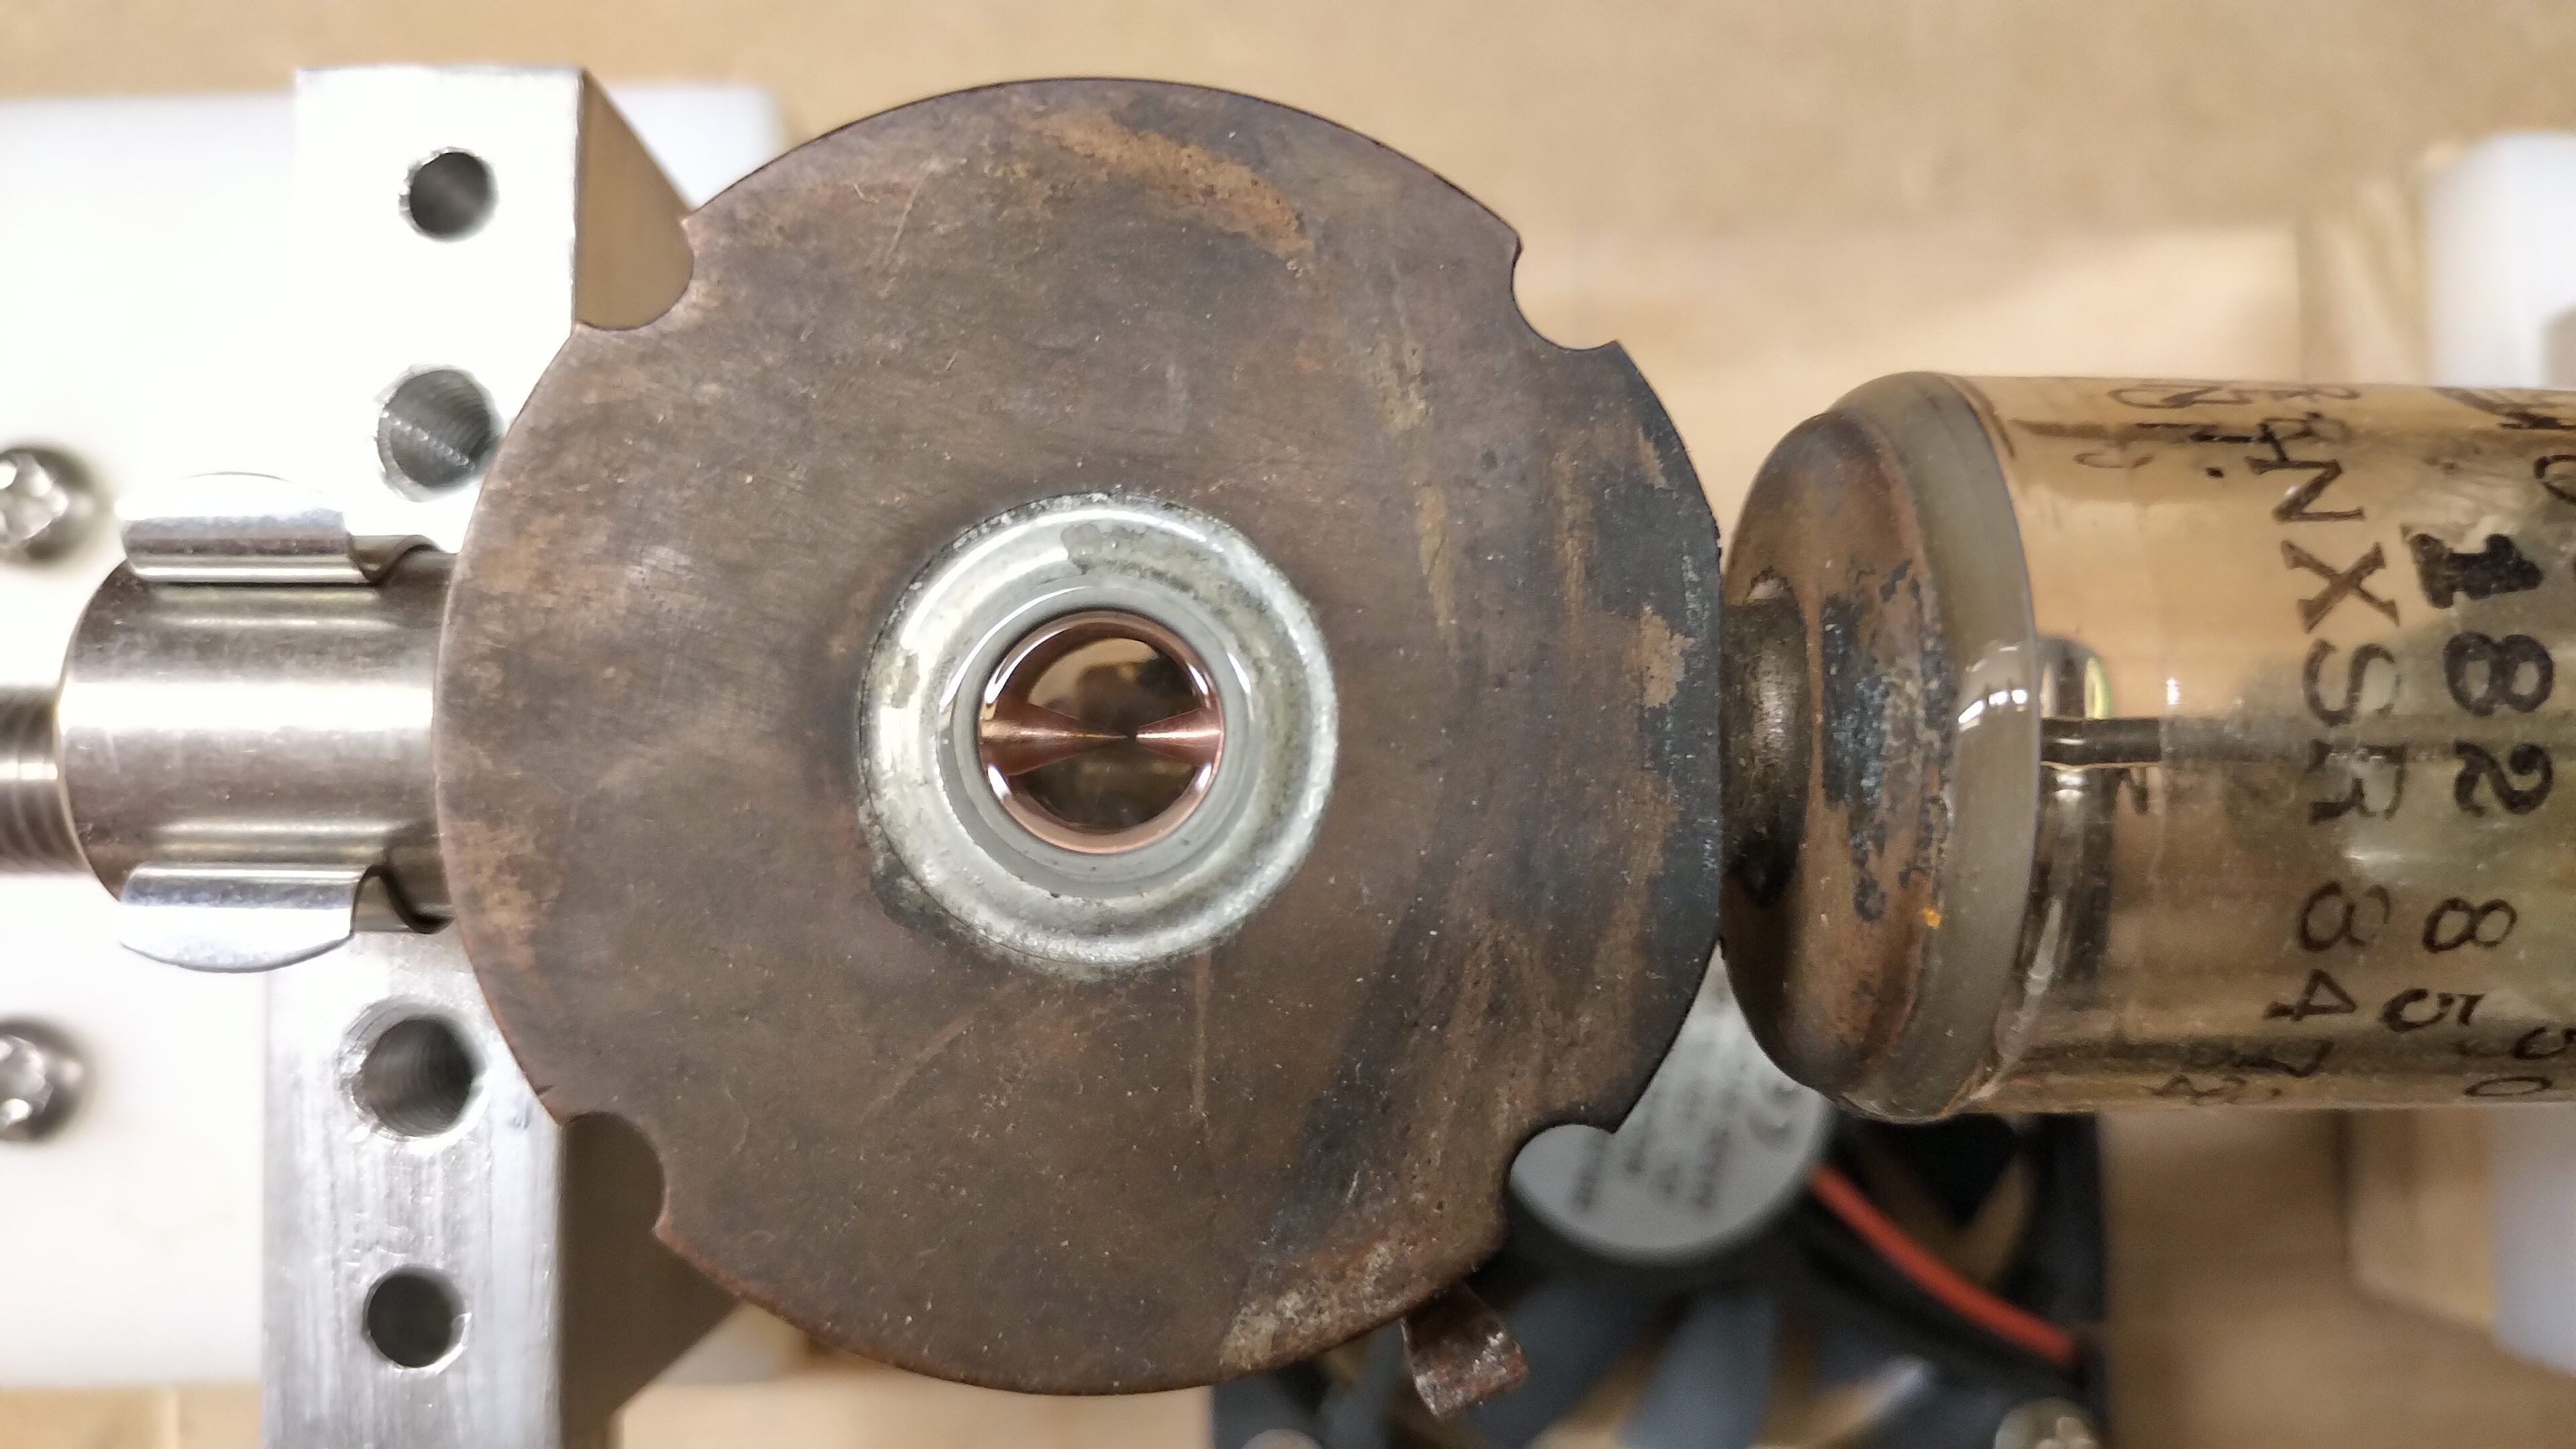
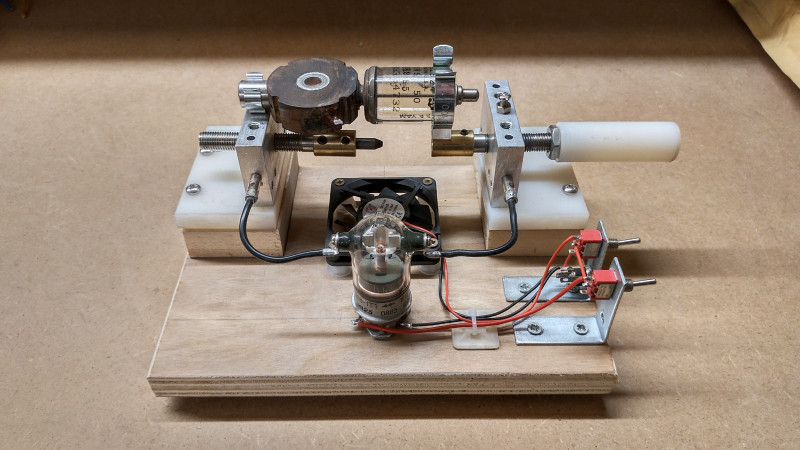
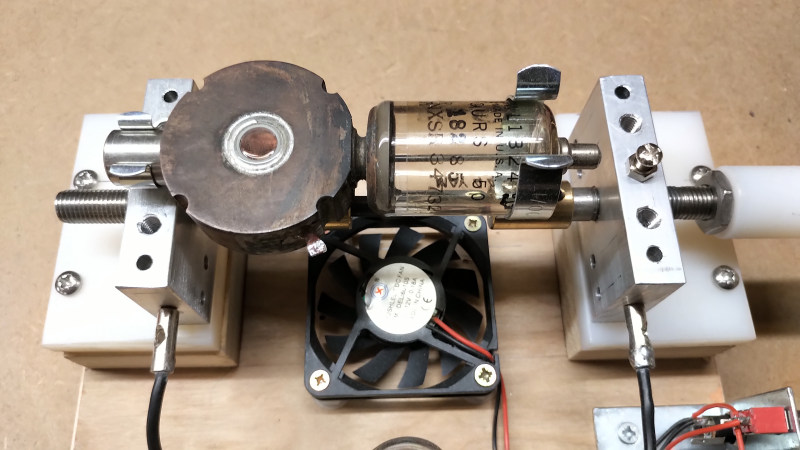
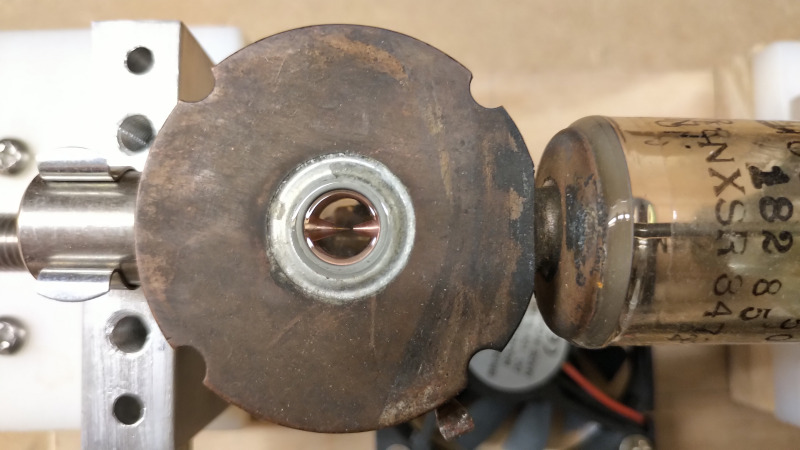
Figures 1 show the experimental apparatus and circuit, and some of the different types of measurements taken as part of the experiments.

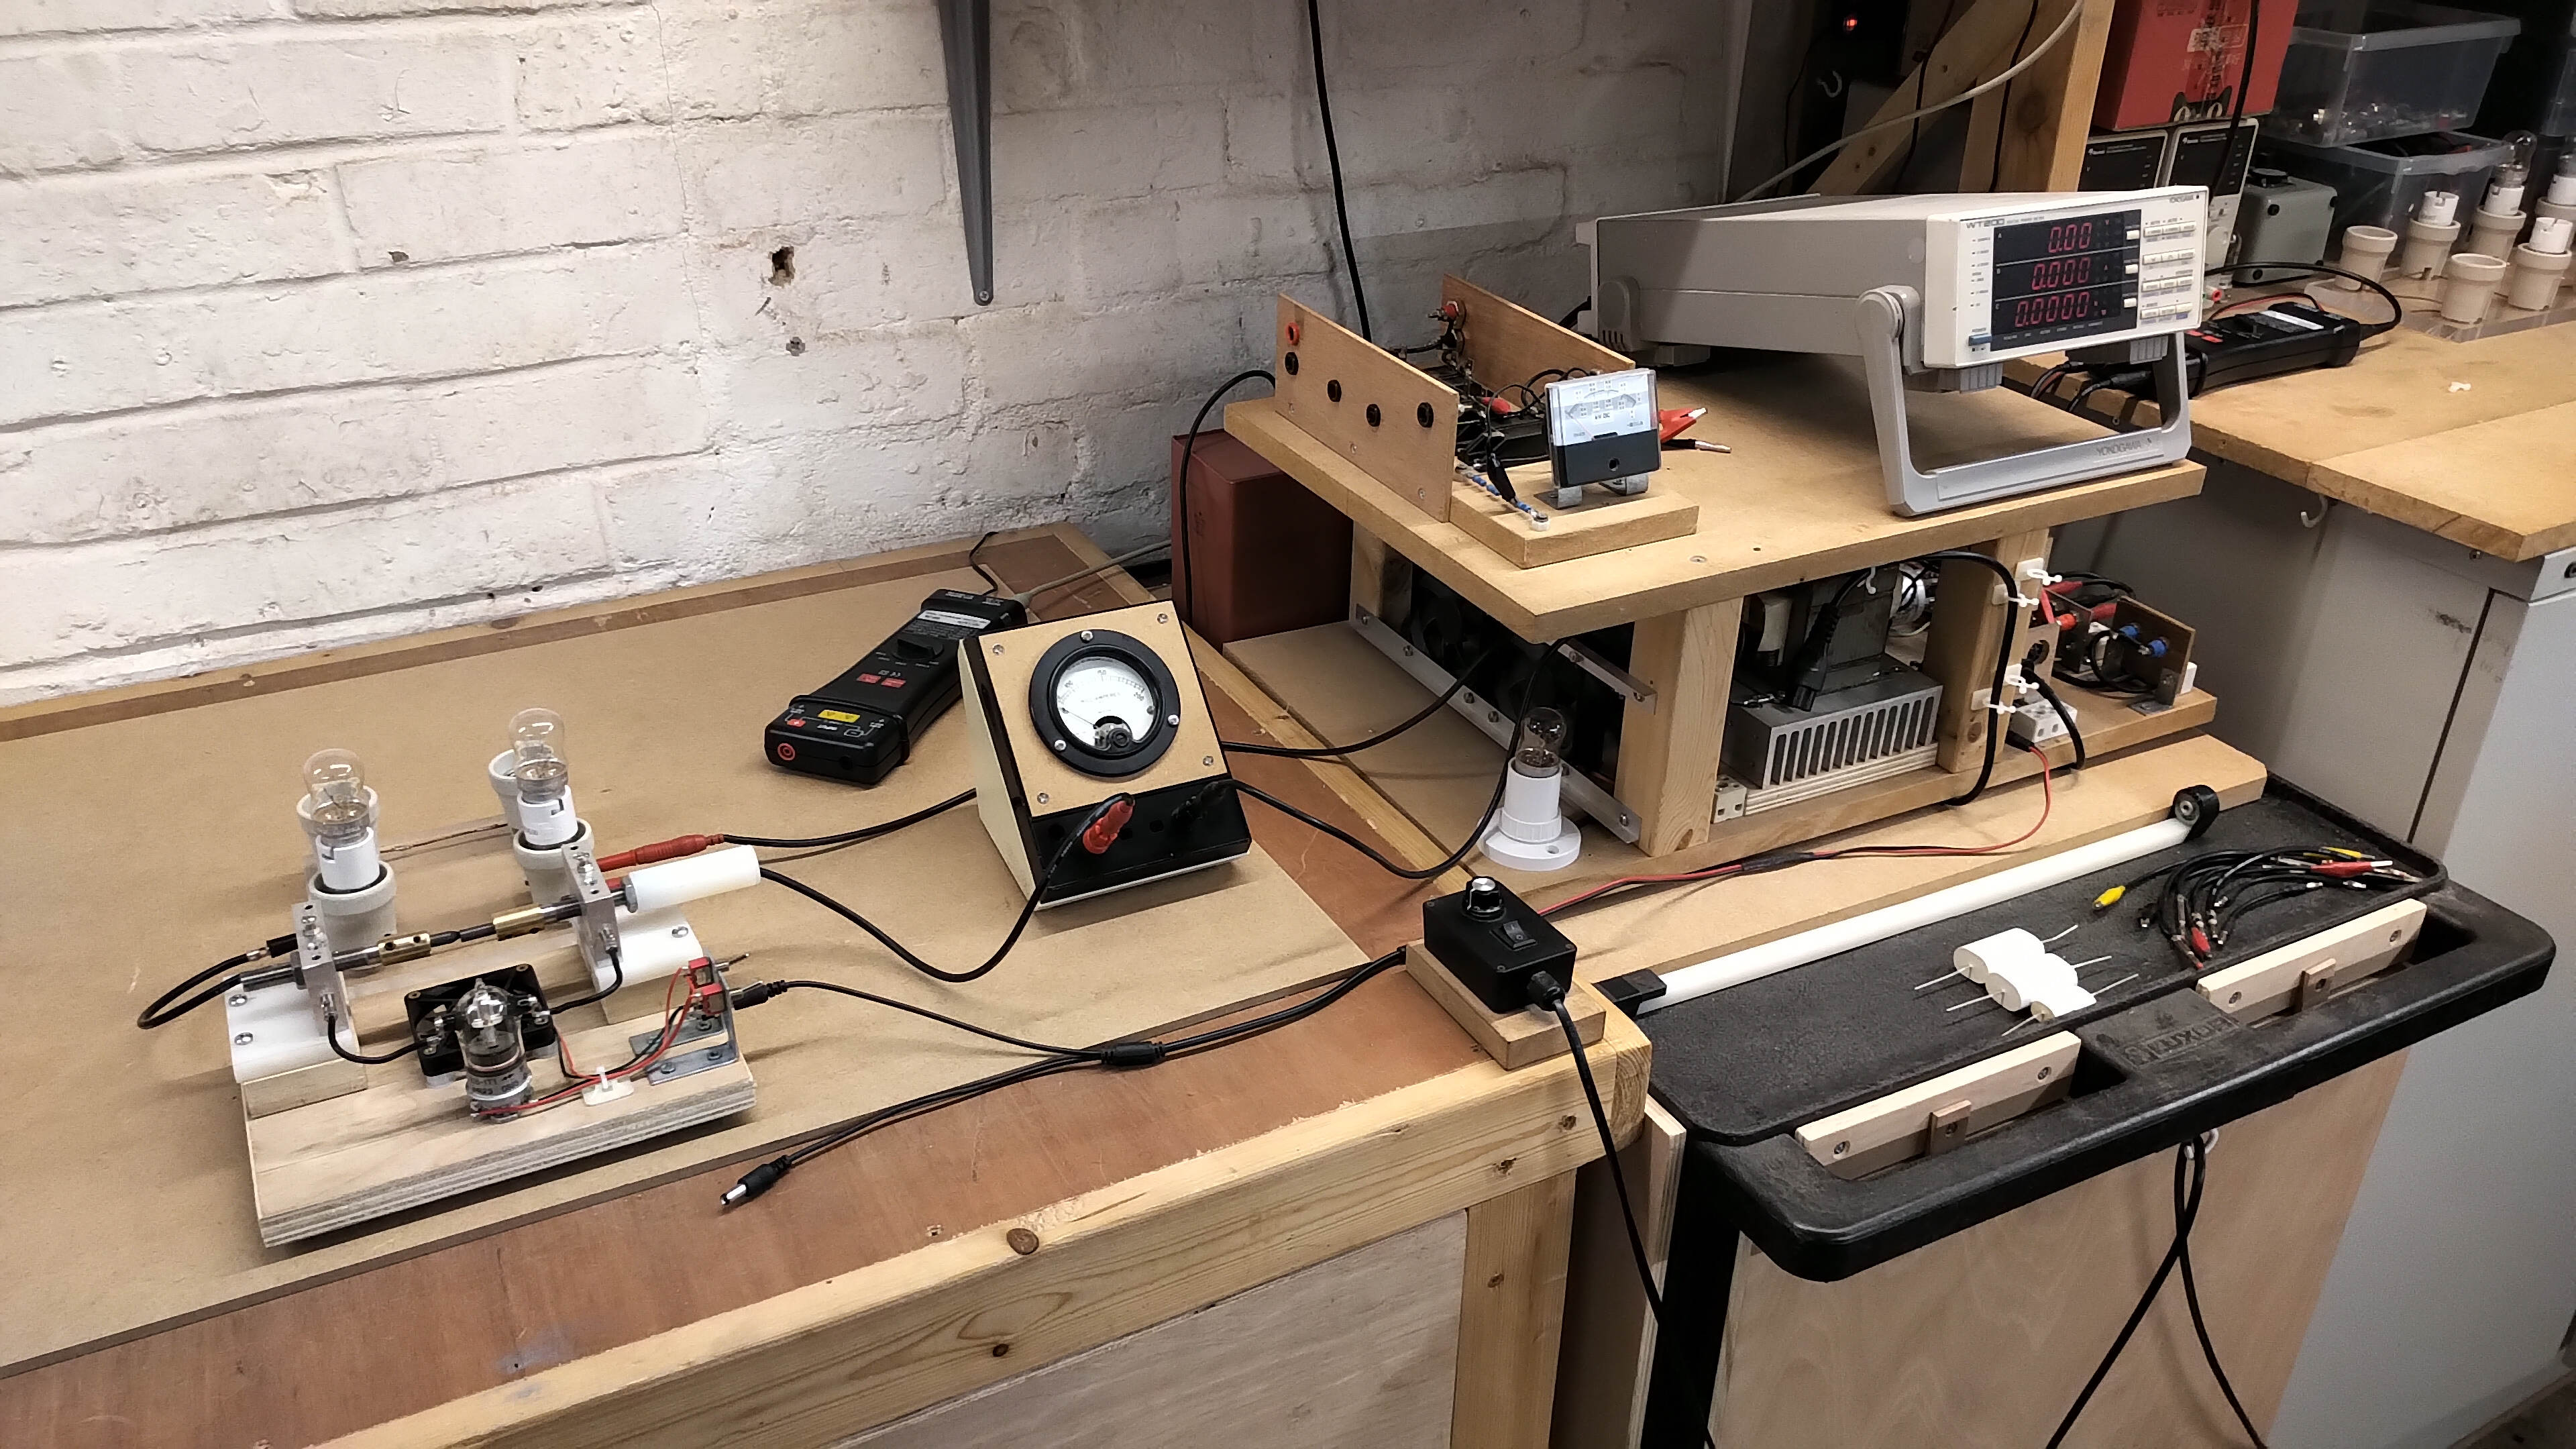
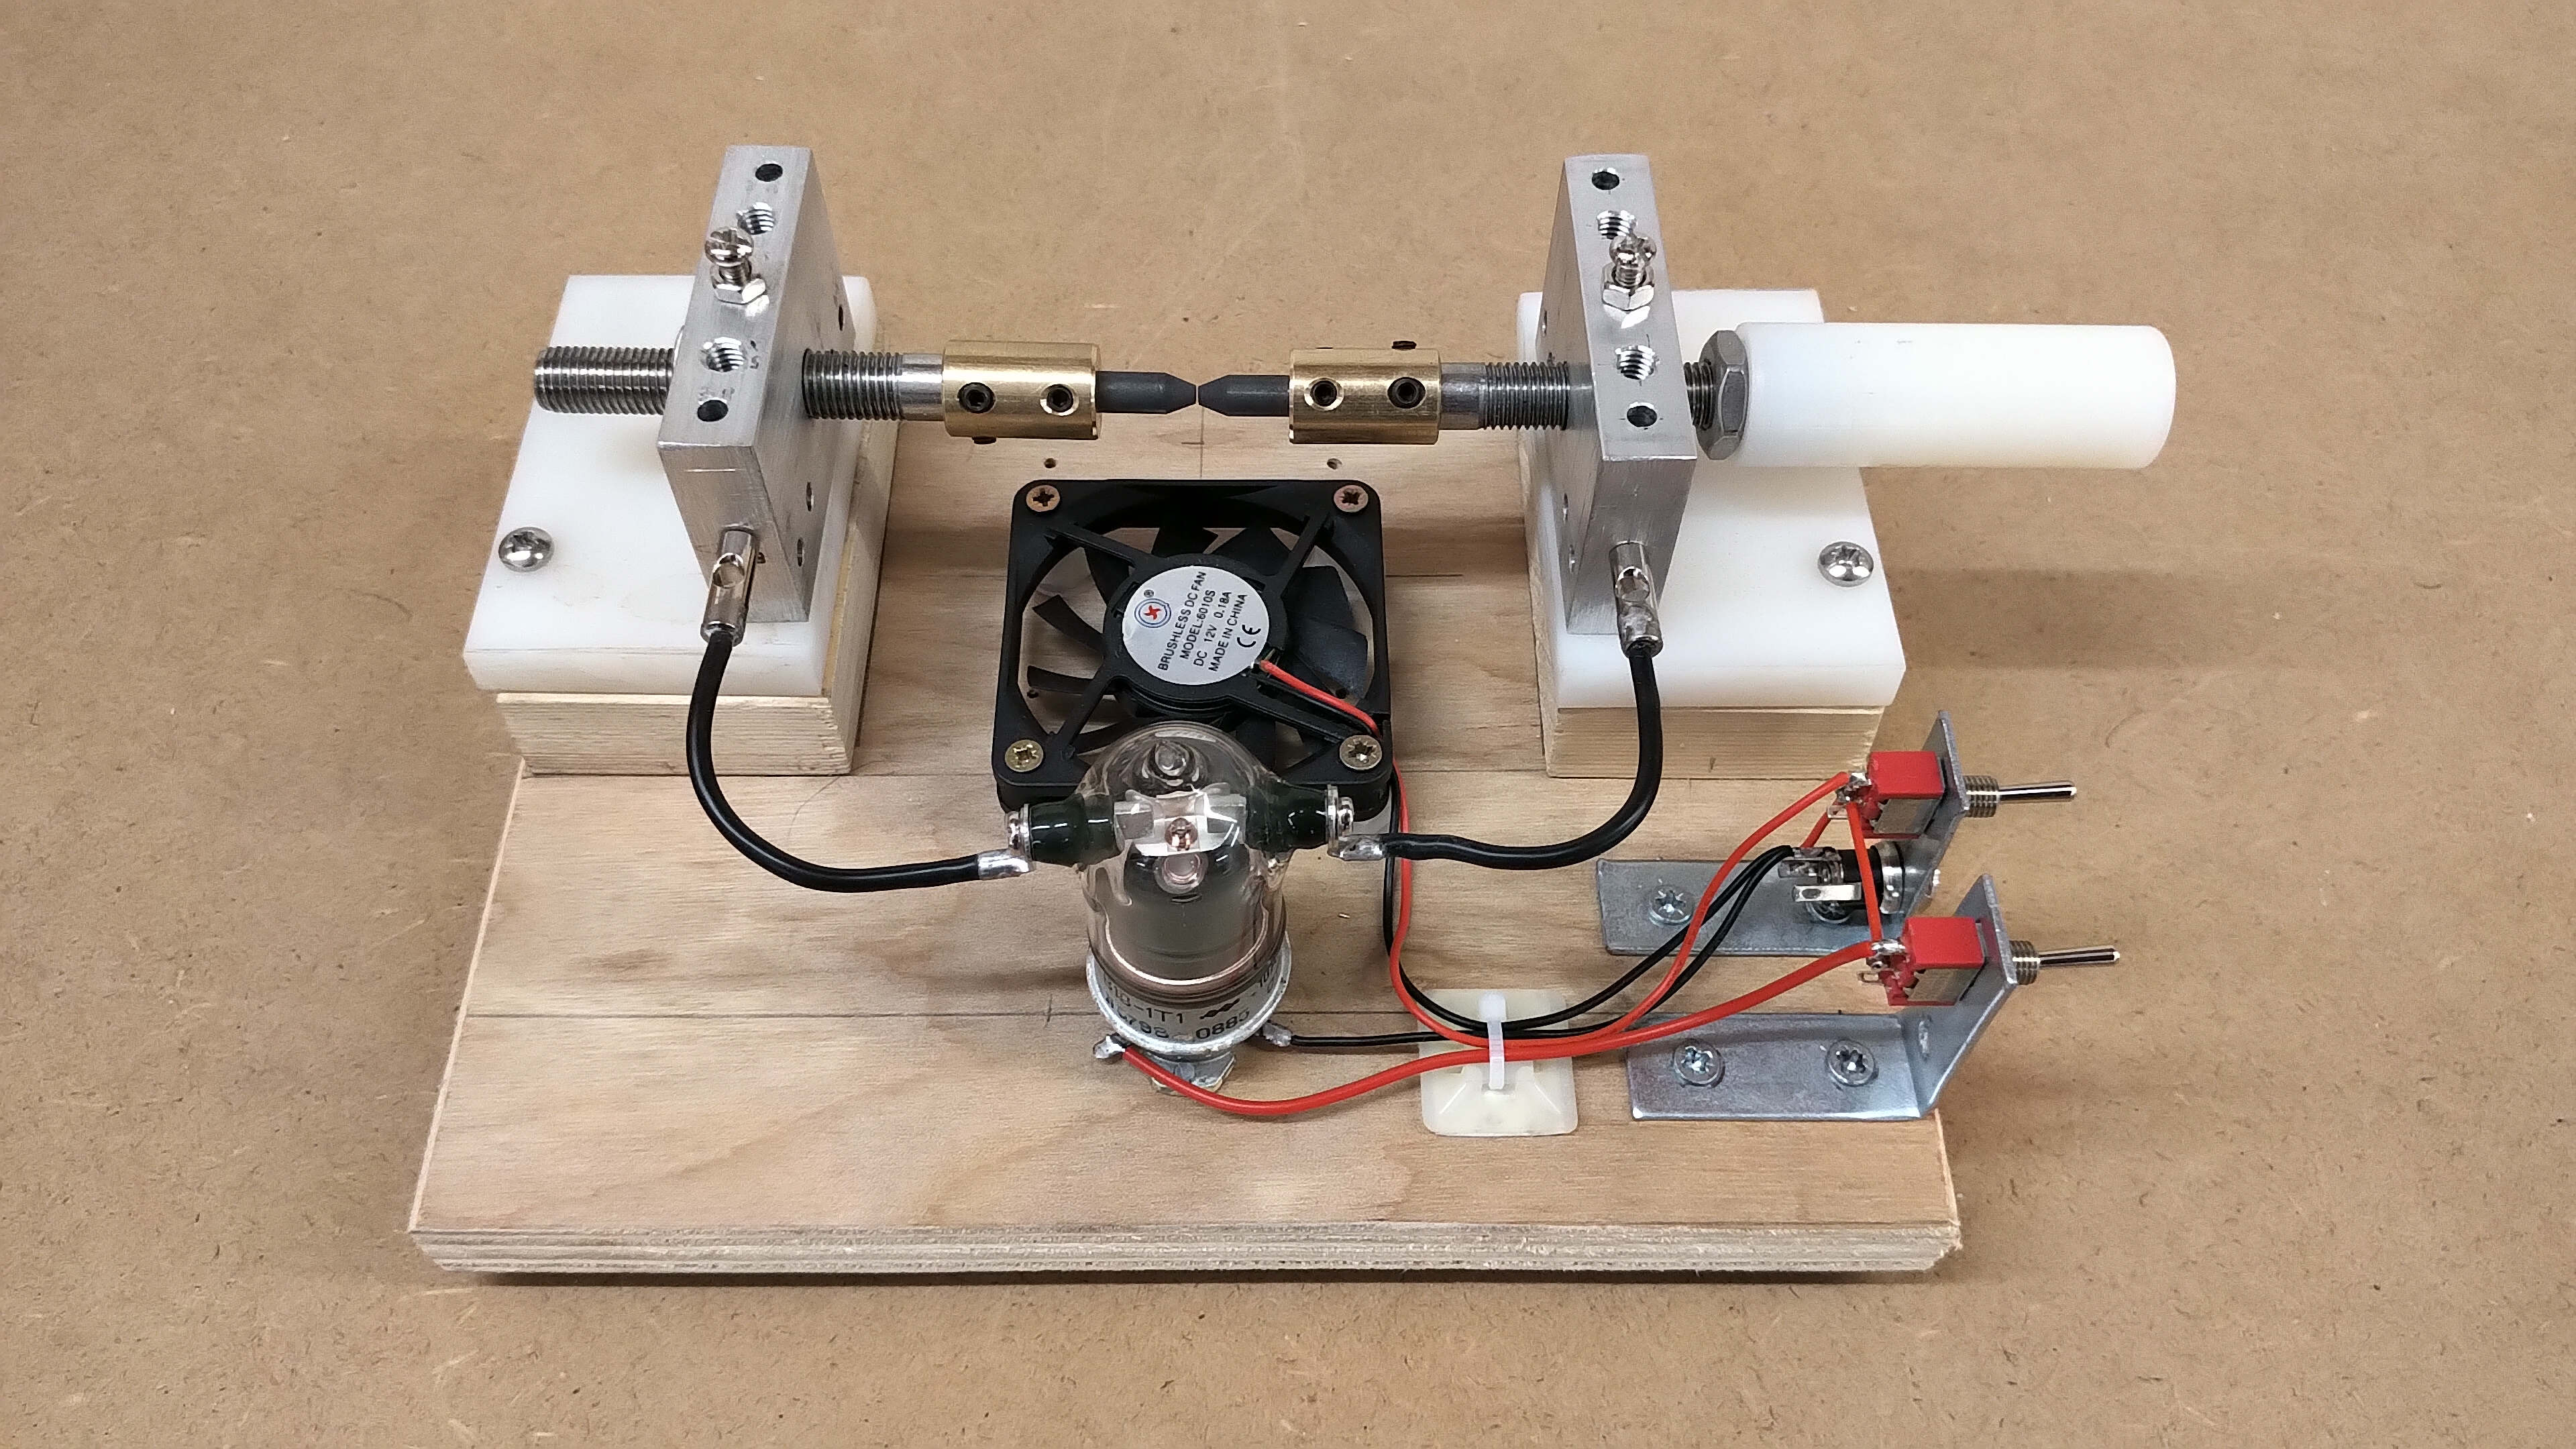
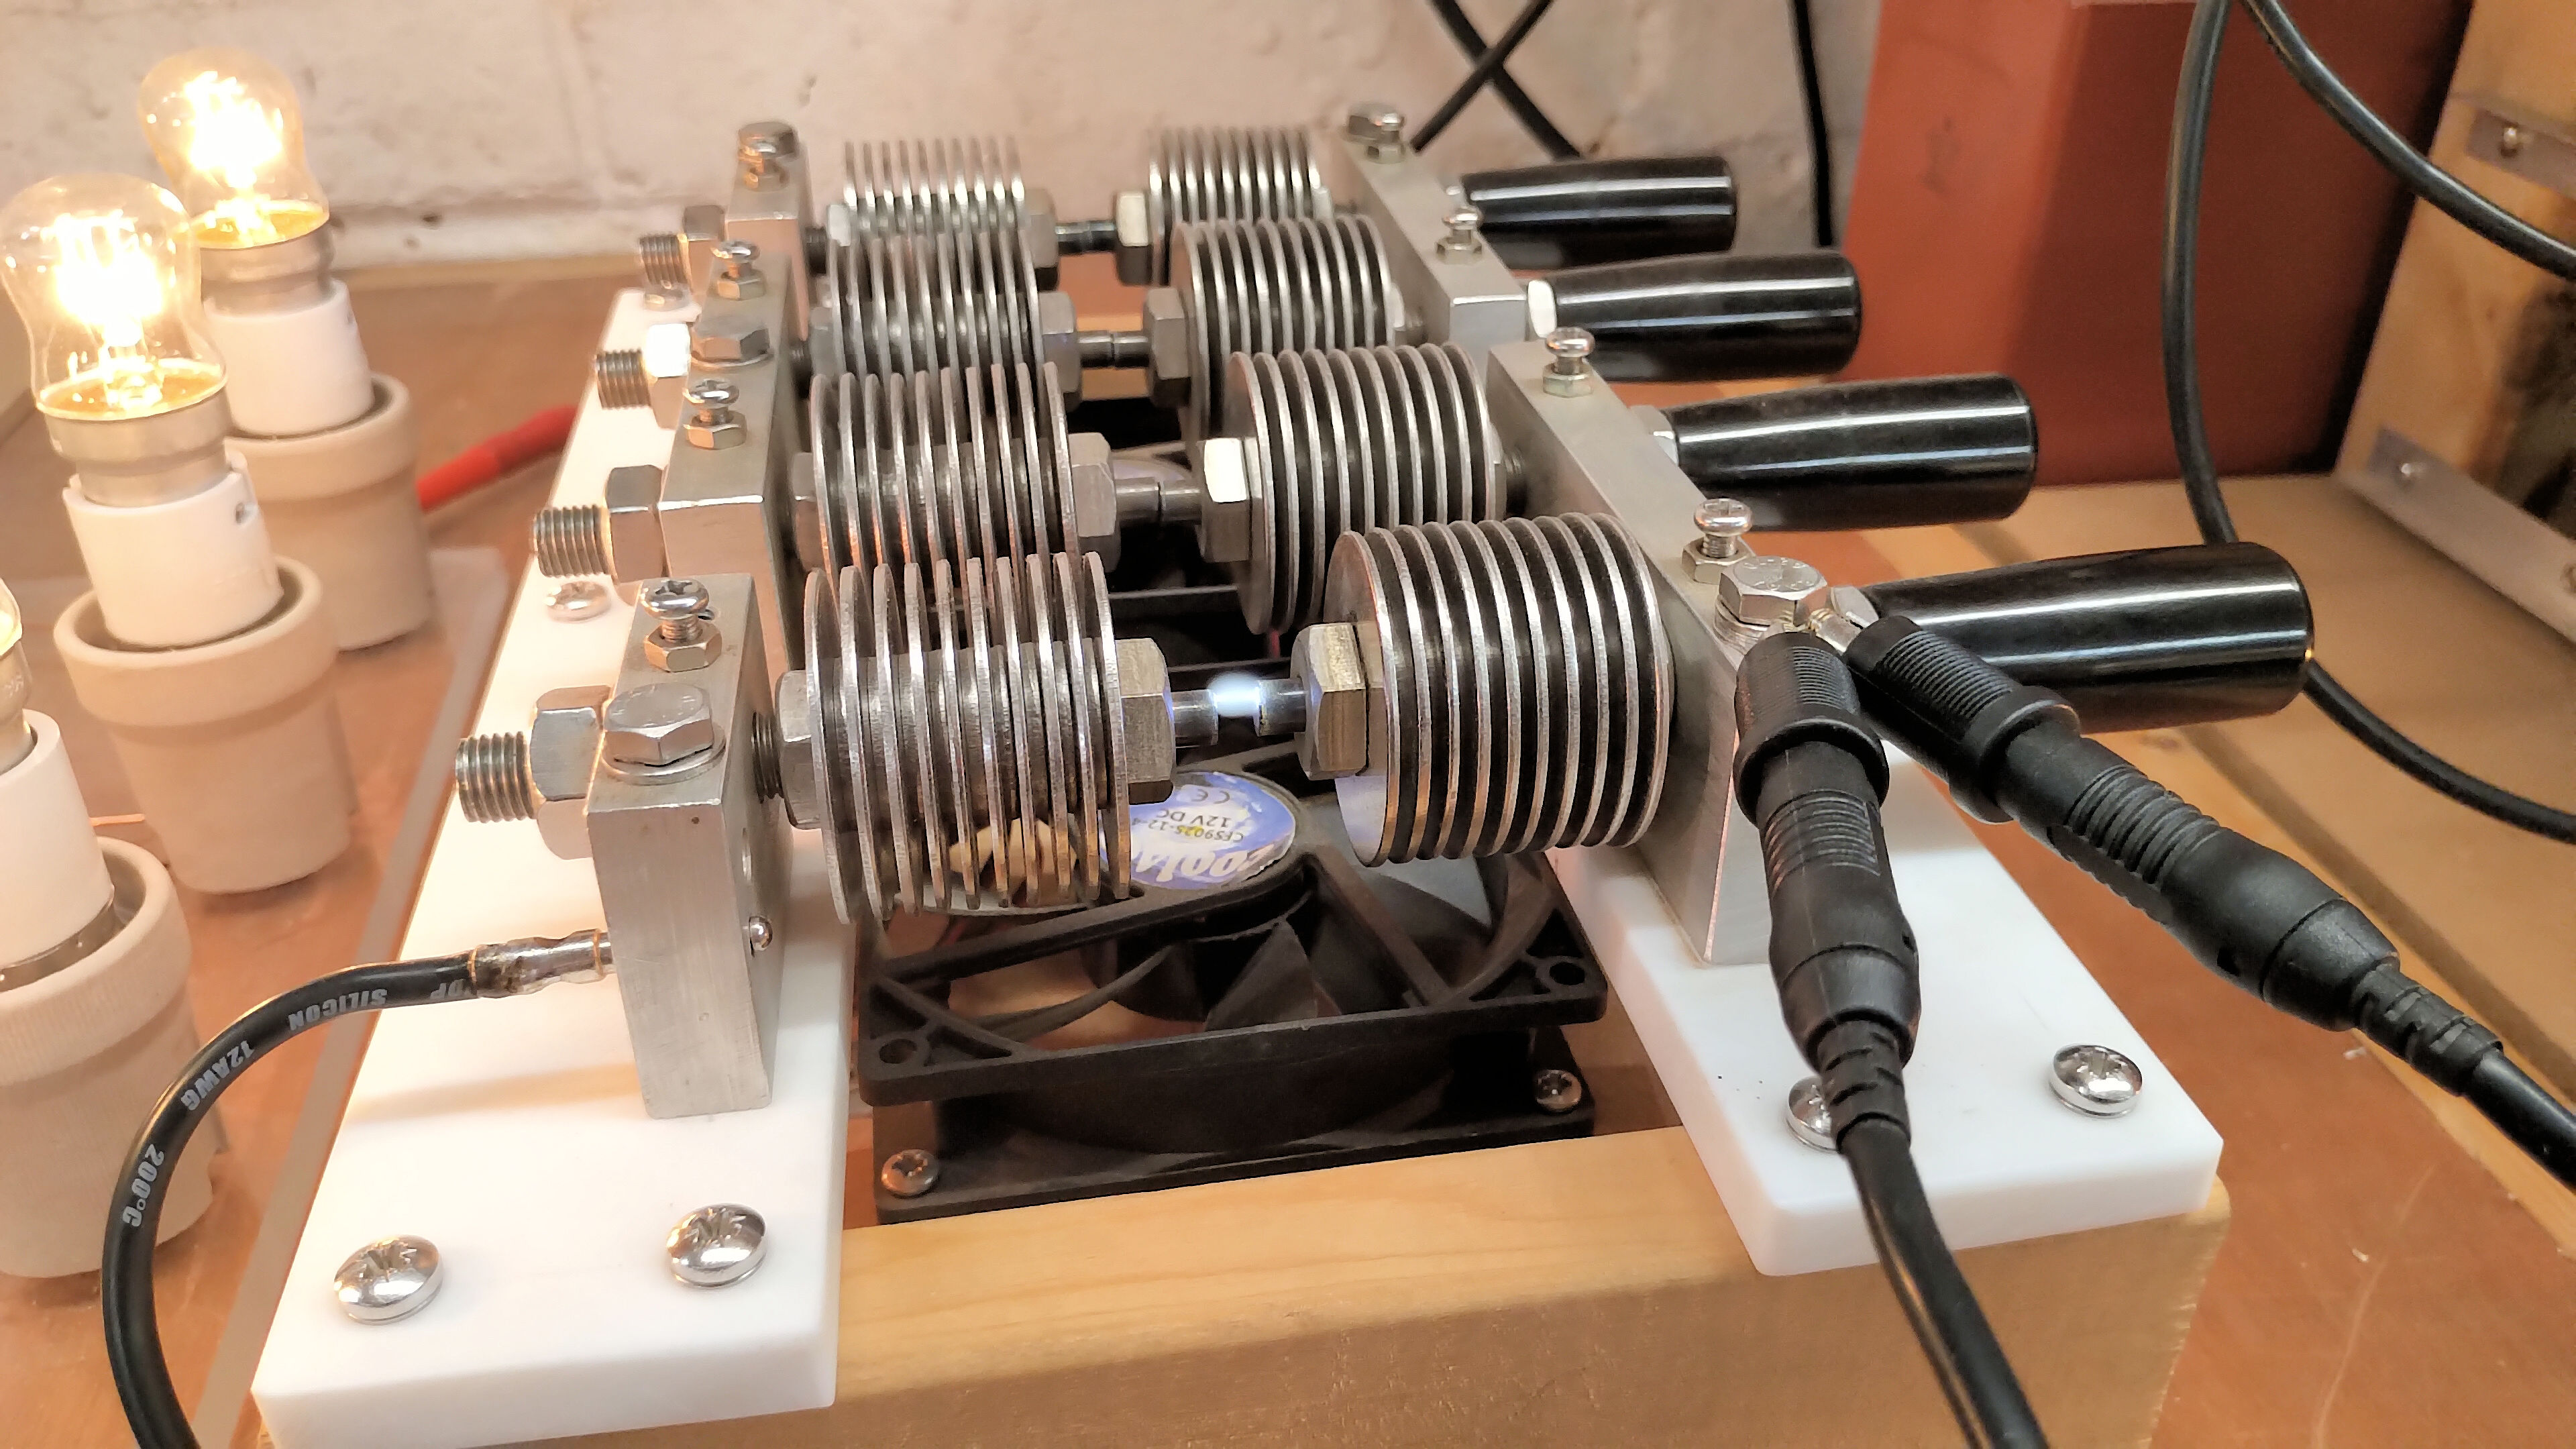
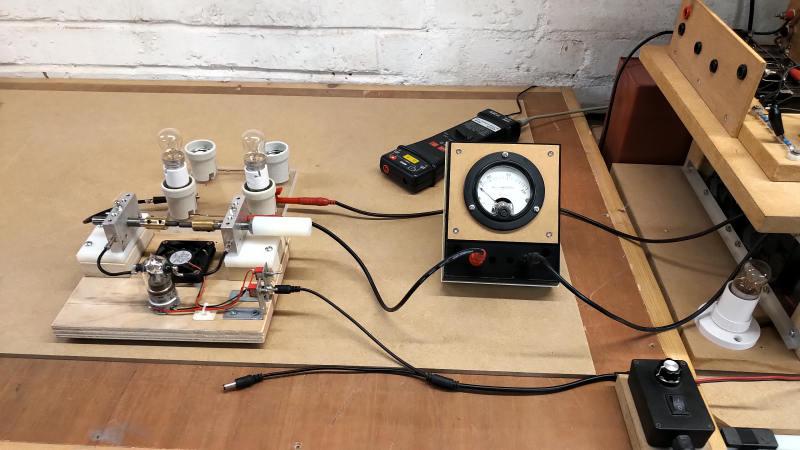
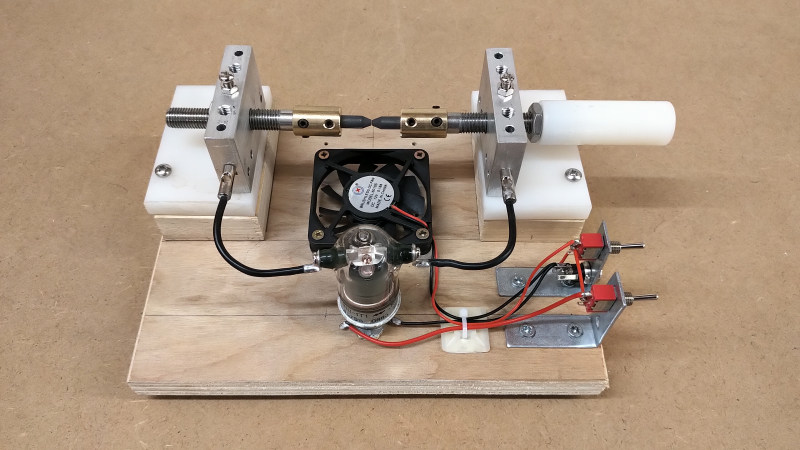
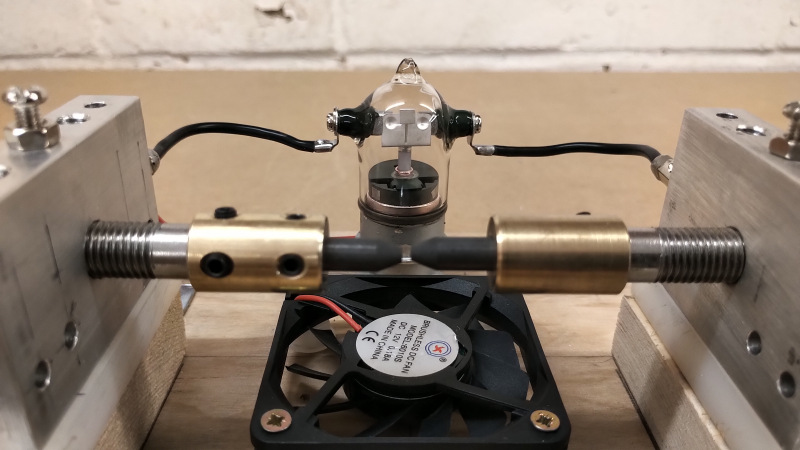
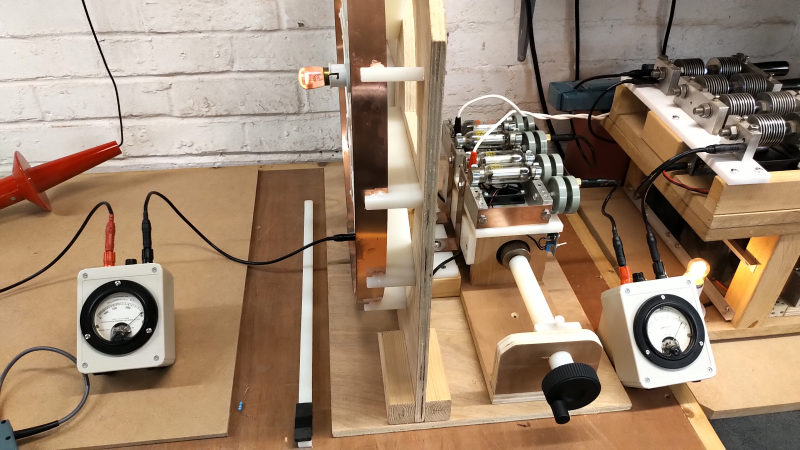
The generator for this experiment is a single HV transformer in the High Voltage Supply (HVS), the output is rectified and connected directly to one electrode of the CSG via an RF ammeter, (Weston 425 200mA FSD). The other electrode of the CSG is connected to a two lamp series incandescent load (2 x 25W = 50W) and then back to the other terminal of the HVS transformer. The CSG has fan assisted cooling, and is shunted in parallel by a 3kV 10A vacuum relay, which enables the CSG to be switched in and out of the circuit for impedance and load power comparisons. The fan and vacuum relay are driven by a low voltage 15V output provided again by the HVS. The input power to the HVS transformer is continuously measured using a Yokogawa WT200 Digital Power Meter.

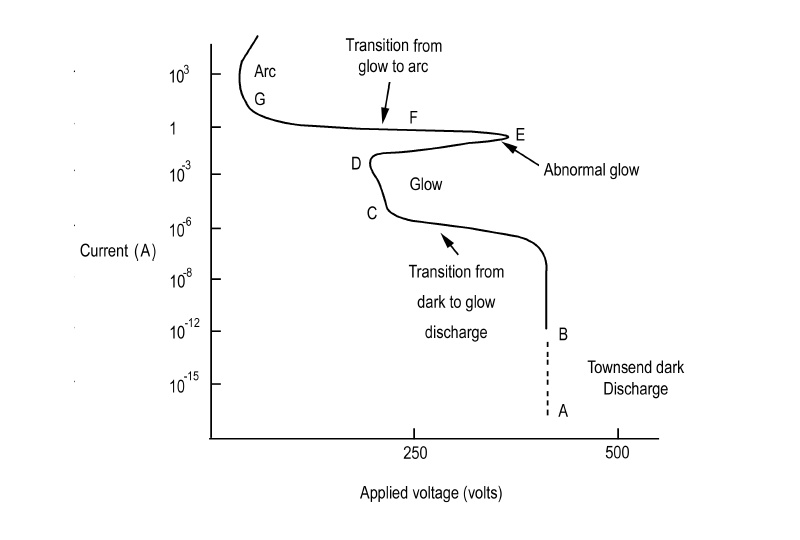
The process of ionisation in the region between two electrodes with a high electric field, is well studied in the prior art[5]. Liberated electrons within the discharge region are accelerated by the electric field between the electrodes, and in the process of moving towards the anode cause further ionisation of atoms, leading to an electron avalanche effect known as a Townsend discharge.  Figure 2 below shows the typical current-voltage (I-V) characteristics for a Townsend discharge transposed from Abdelrahman et al.[6]. The negative resistance characteristics utilised in this experiment result from biasing the CSG to the correct region of this I-V curve, around the abnormal glow region between points D-E-F-G . The interesting and unusual phenomena presented in this experiment result from the reduction in circuit impedance, when the biased CSG is combined with a suitable load circuit (incandescent lamps), and driven from a non-linear transient high voltage generator at the line frequency.

The following video introduces the apparatus, experiments, and phenomena associated with the negative resistance of a CSG, and demonstrates aspects of the following:

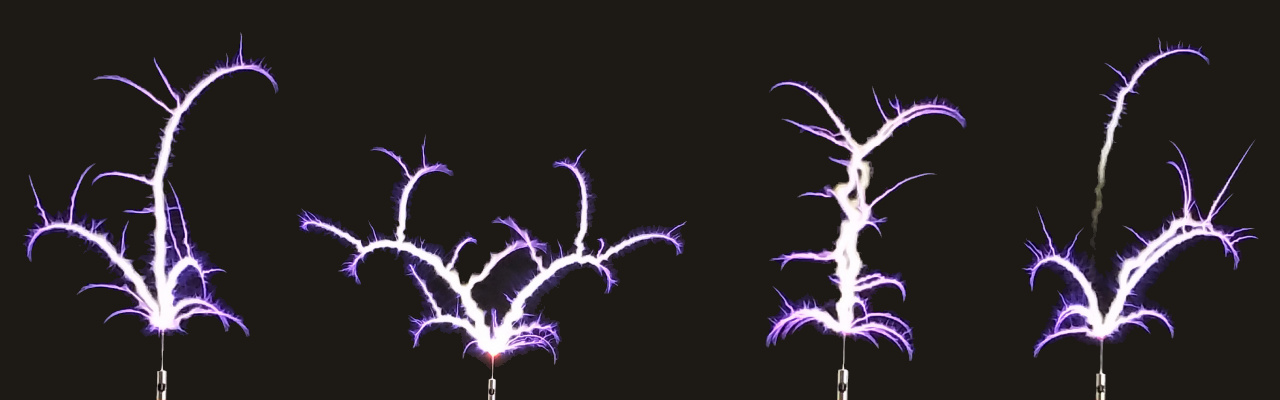
1. A qualitative observation of the discharge produced in the CSG when biased into different regions of the I-V characteristic, including open-circuit, short-circuit, abnormal glow (D-E-F), and arc discharge (G) regions.

2. Adjusting and biasing the spark gap into the abnormal glow region to utilise the negative resistance properties within the electrical circuit.

3. The change in impedance of the circuit when switched between short-circuit conduction and spark gap discharge.

4. The change in circuit current and dissipated power in the load with switched impedance, and the effect on the input power to the generator from the line supply.

5. A comparison of adjusting and biasing the circuit when driven from a non-linear transient input, and a linear sinusoidal.

6. Measurement of the generator output using an oscilloscope both in the non-linear and sinusoidal cases, and showing the switching transients generated when the CSG is biased into the negative resistance region.

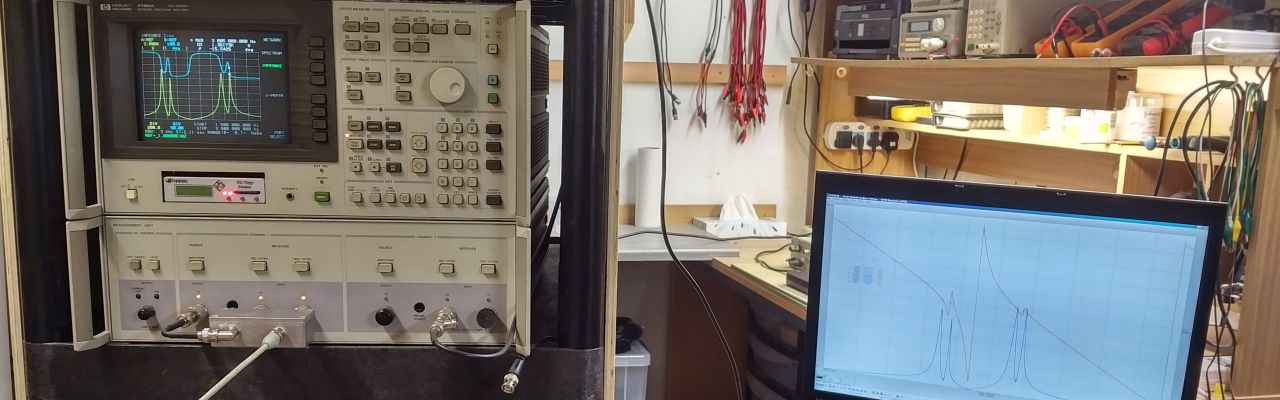
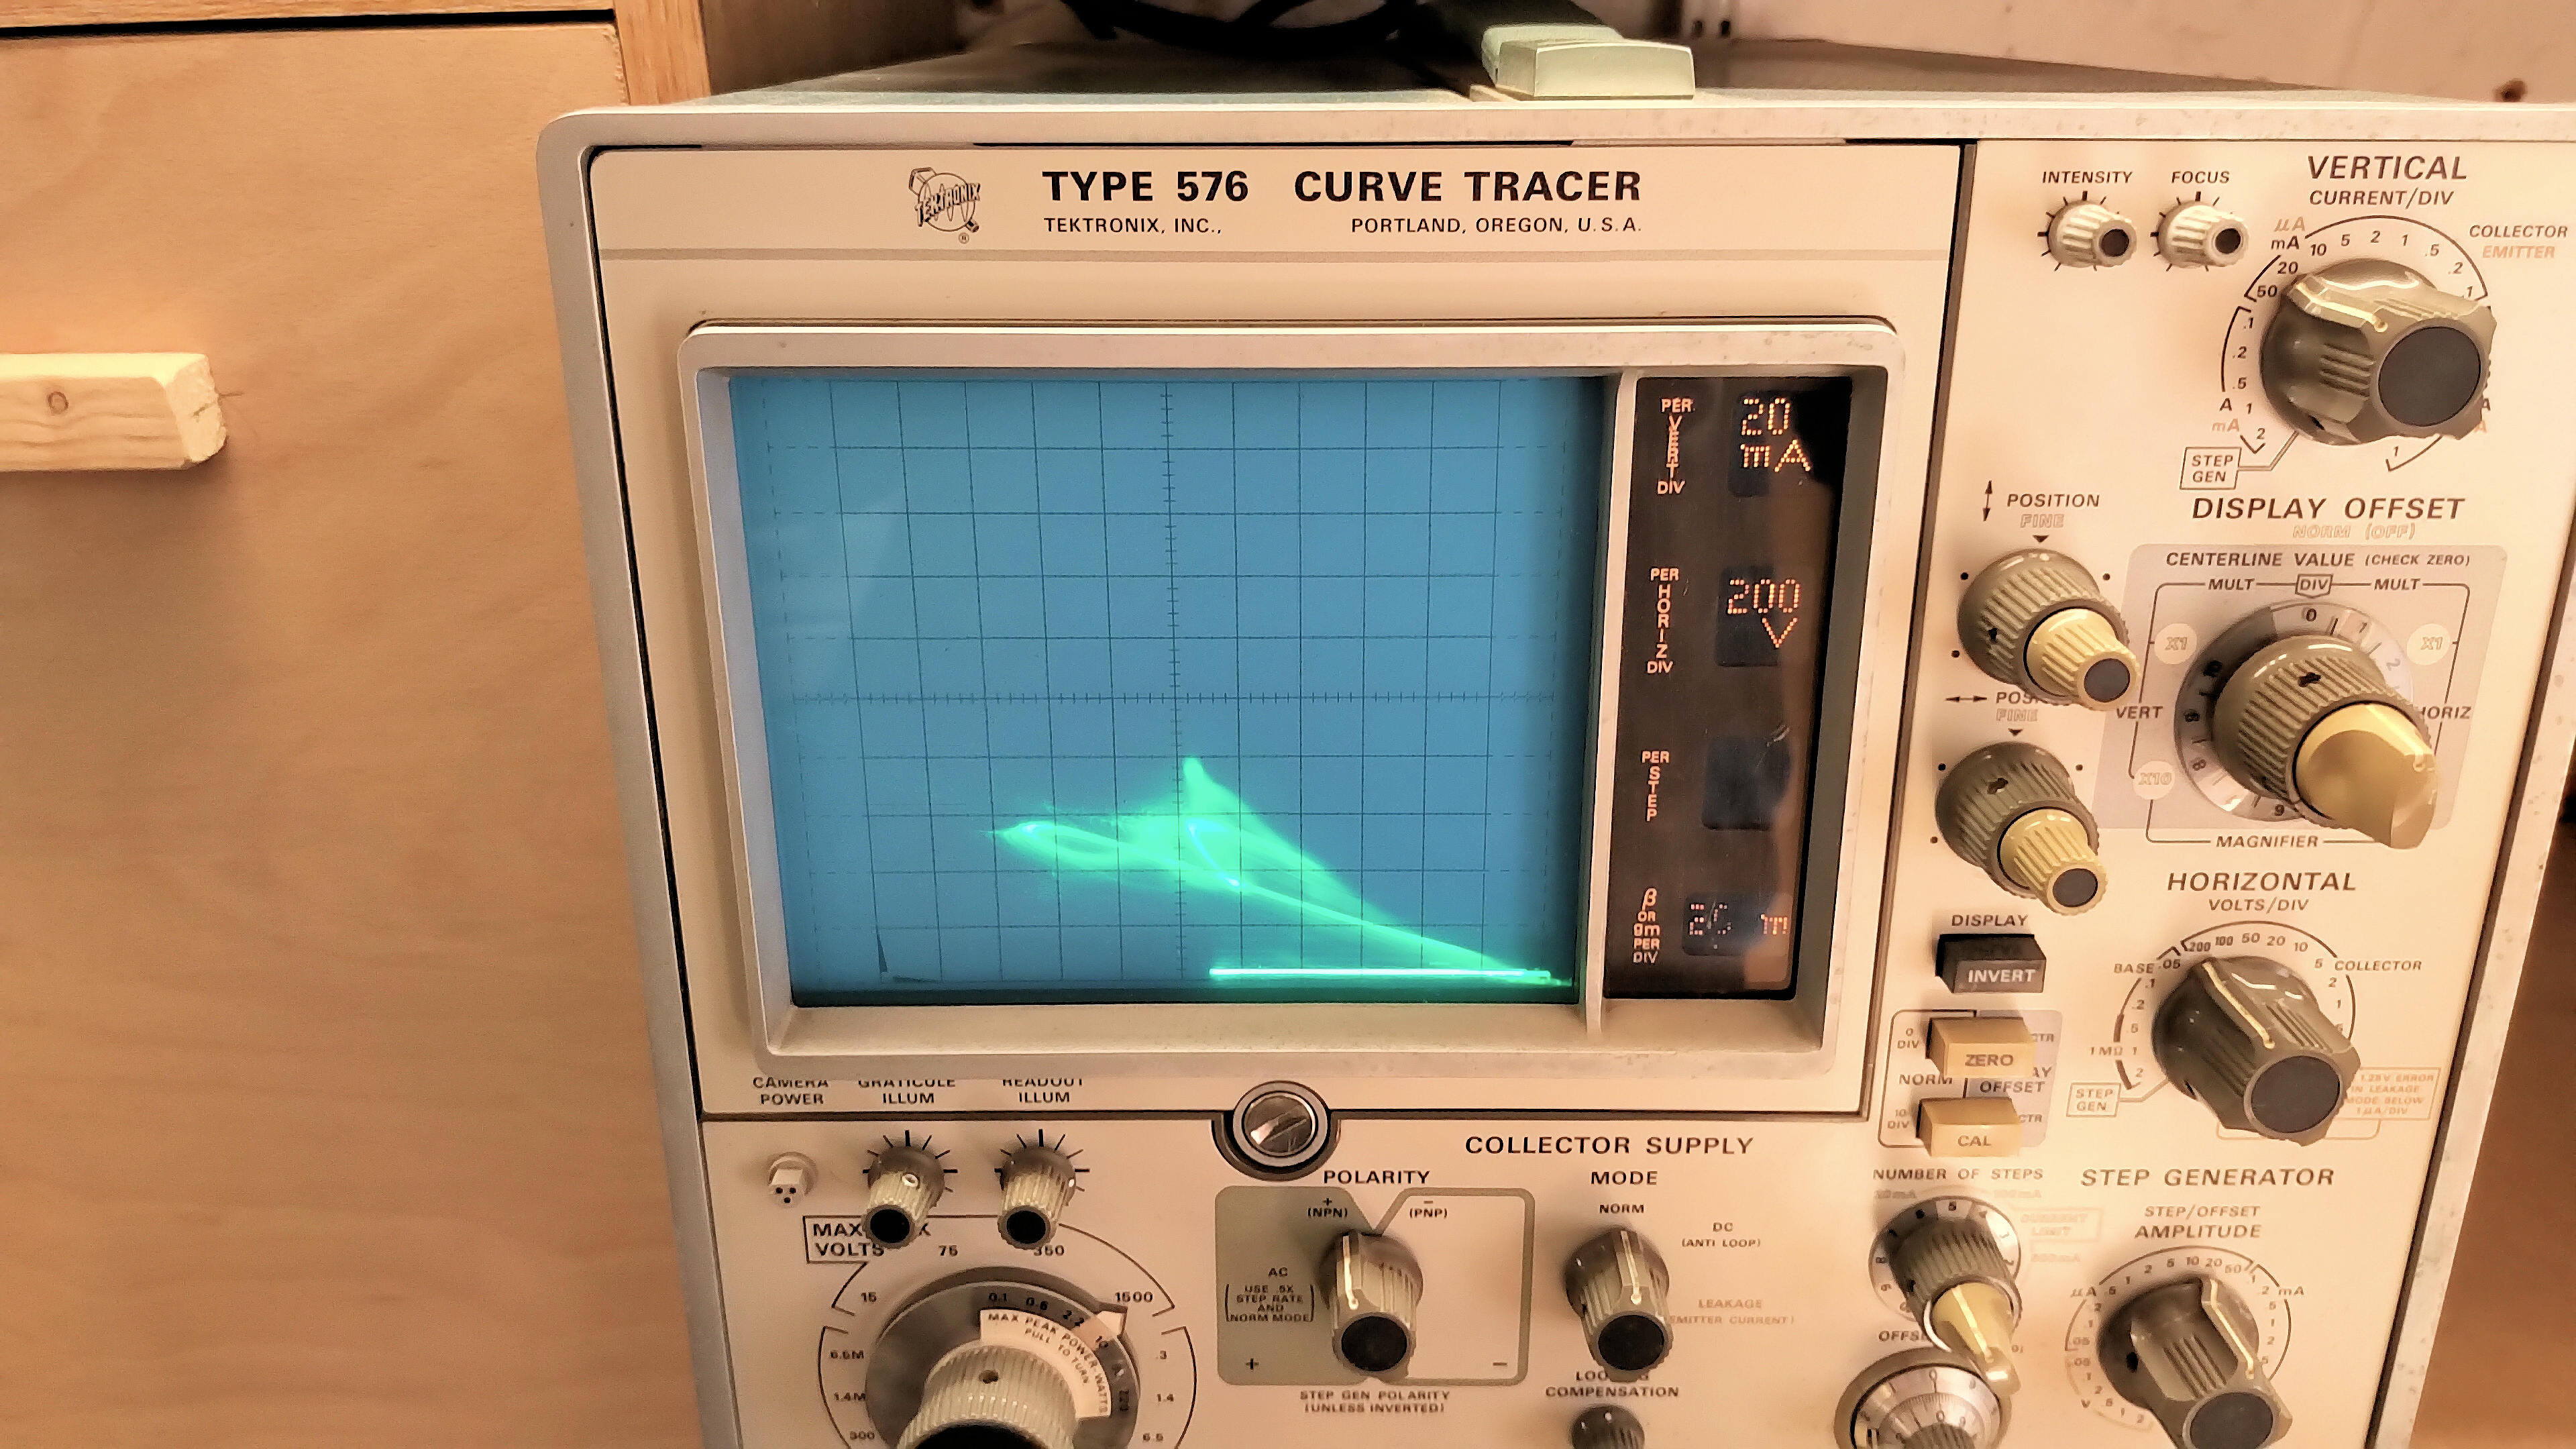
7. An experimental investigation of the I-V characteristics of the CSG using a Tektronix 576 curve tracer.

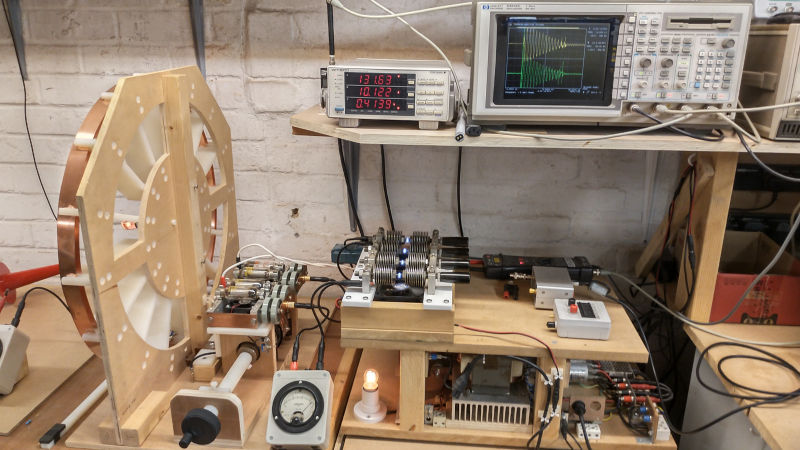
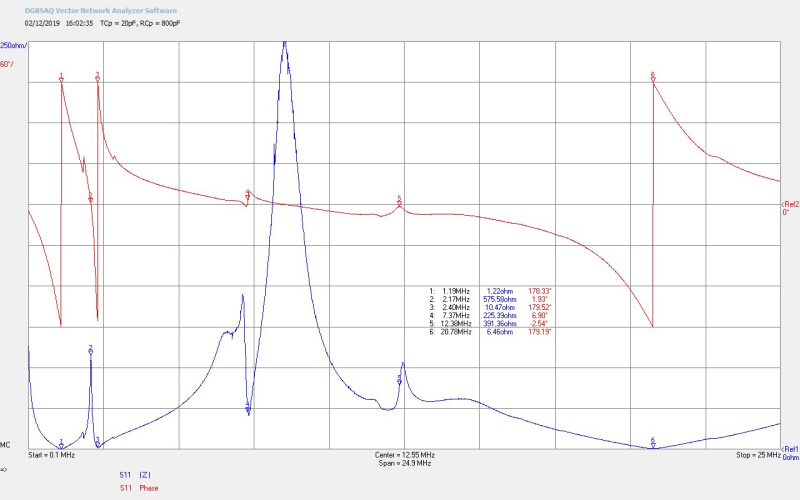
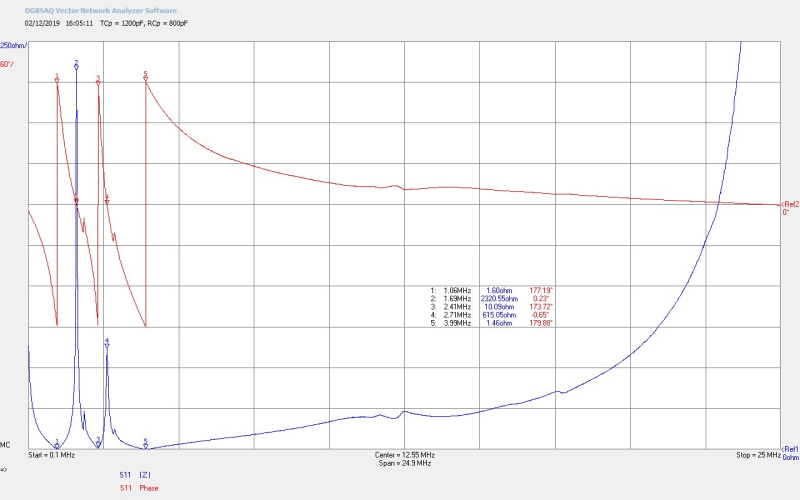
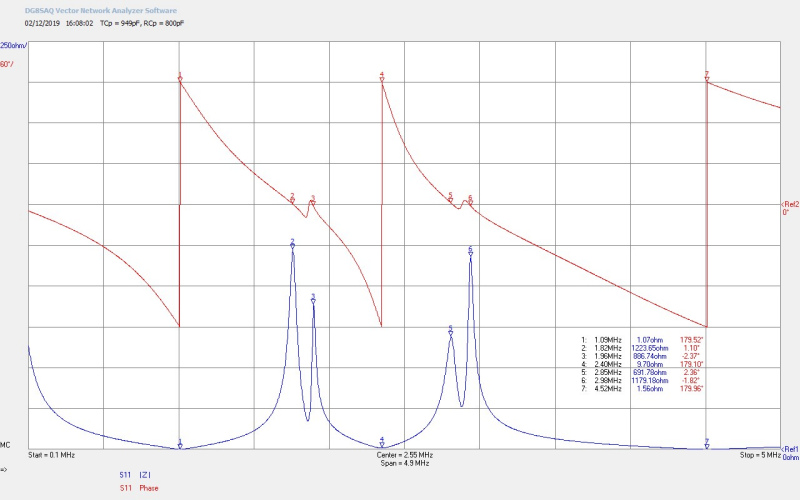
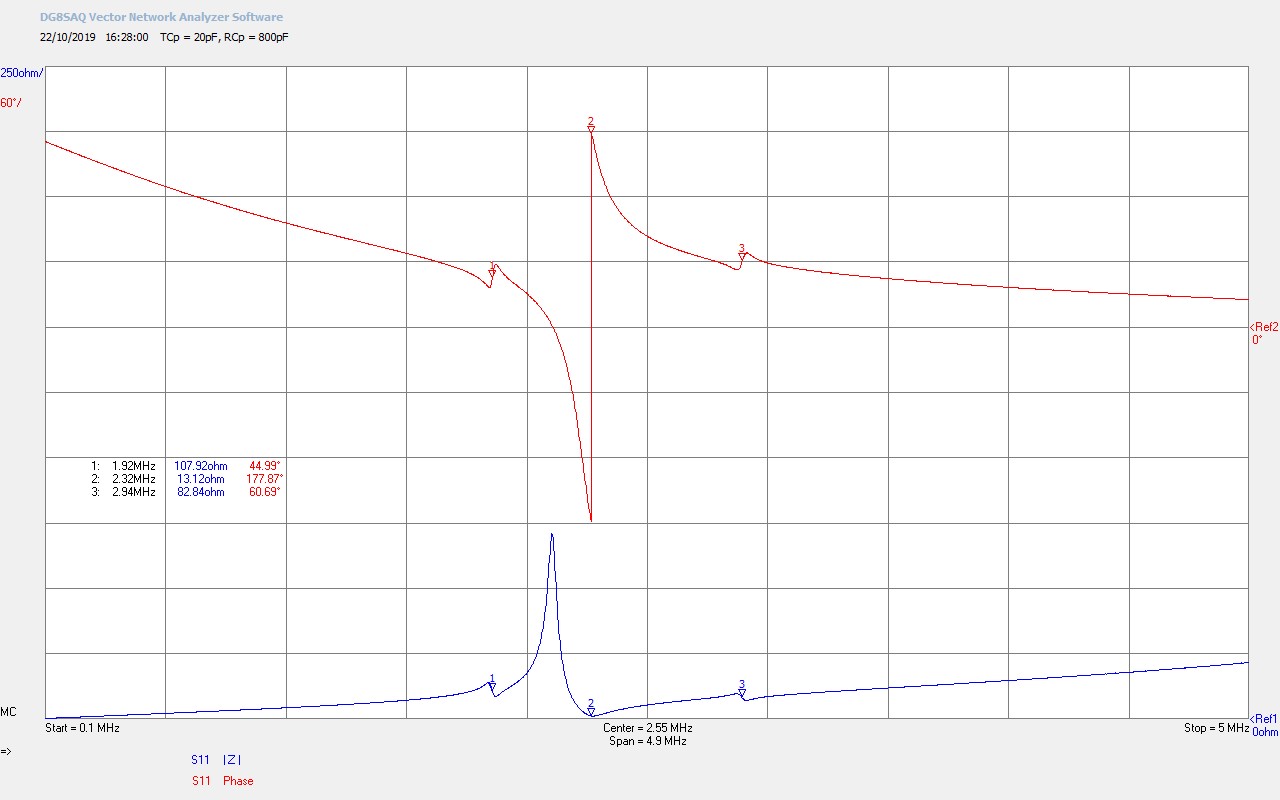
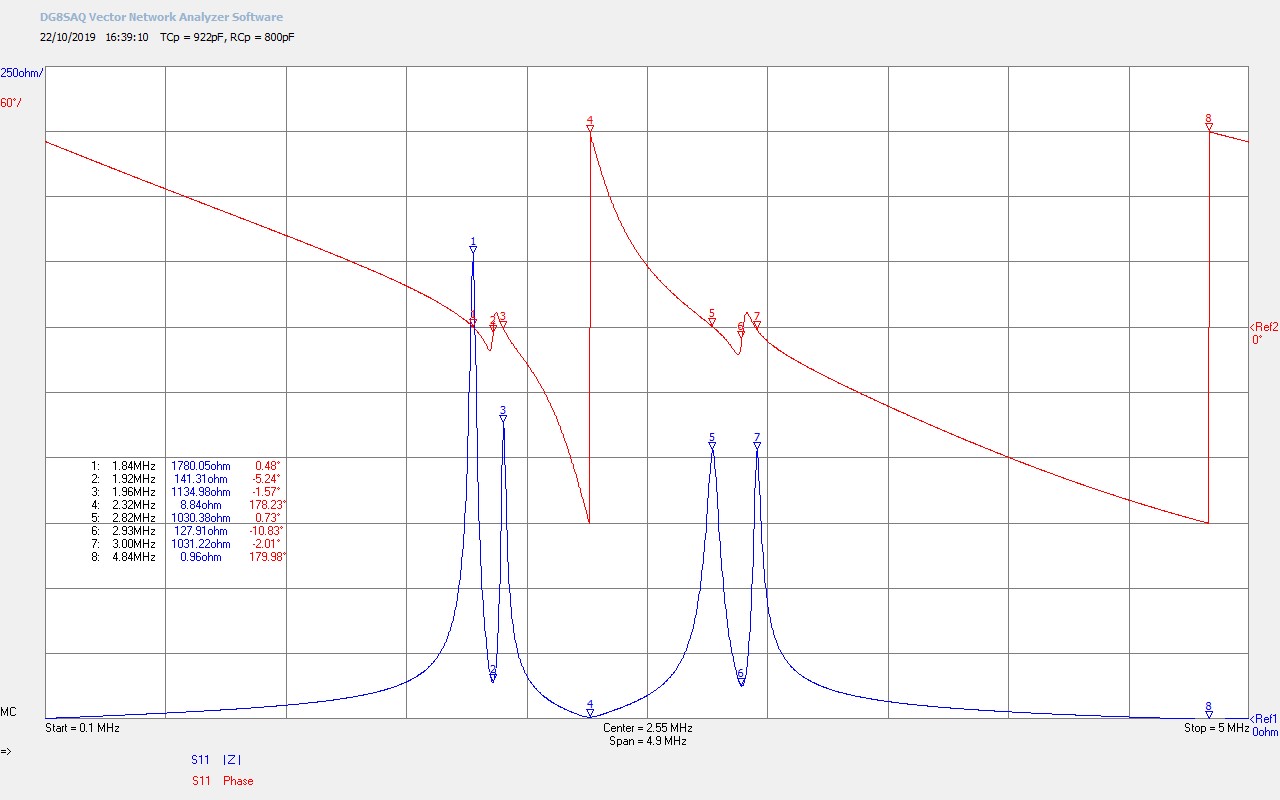
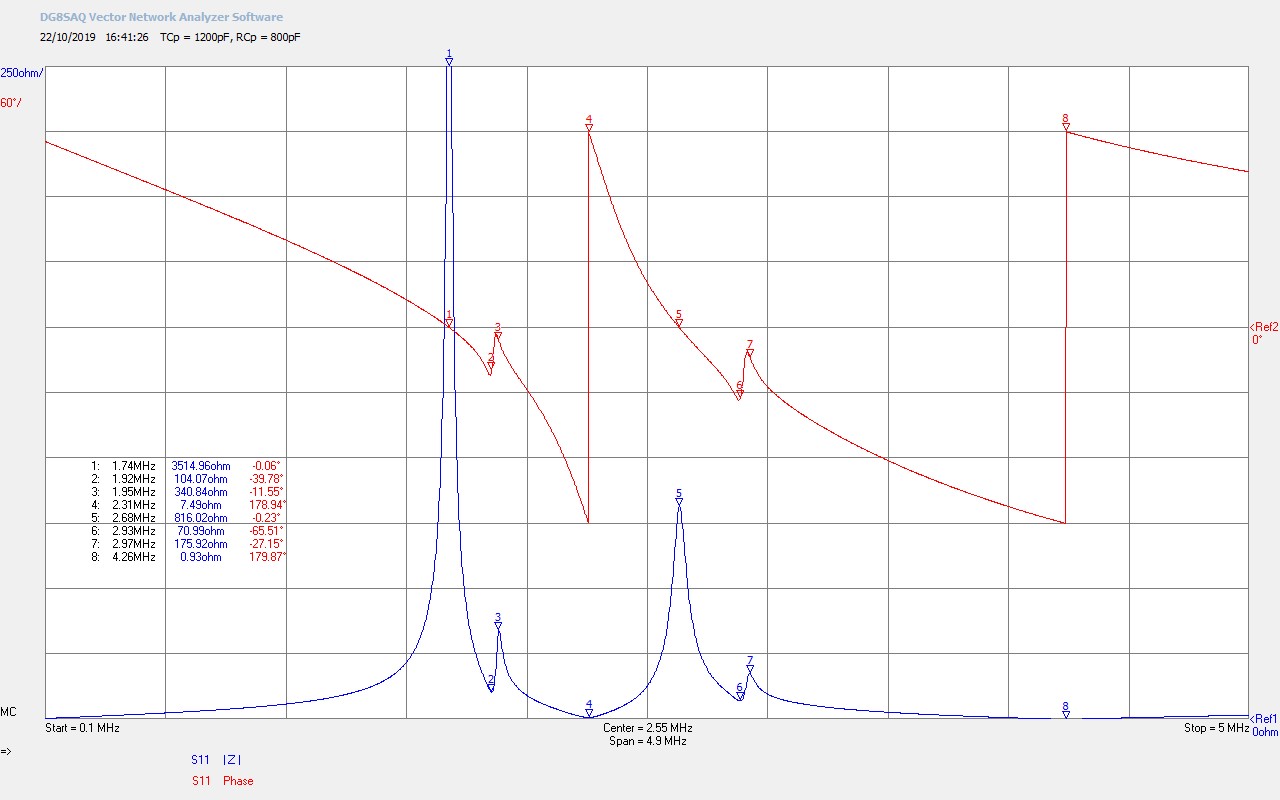
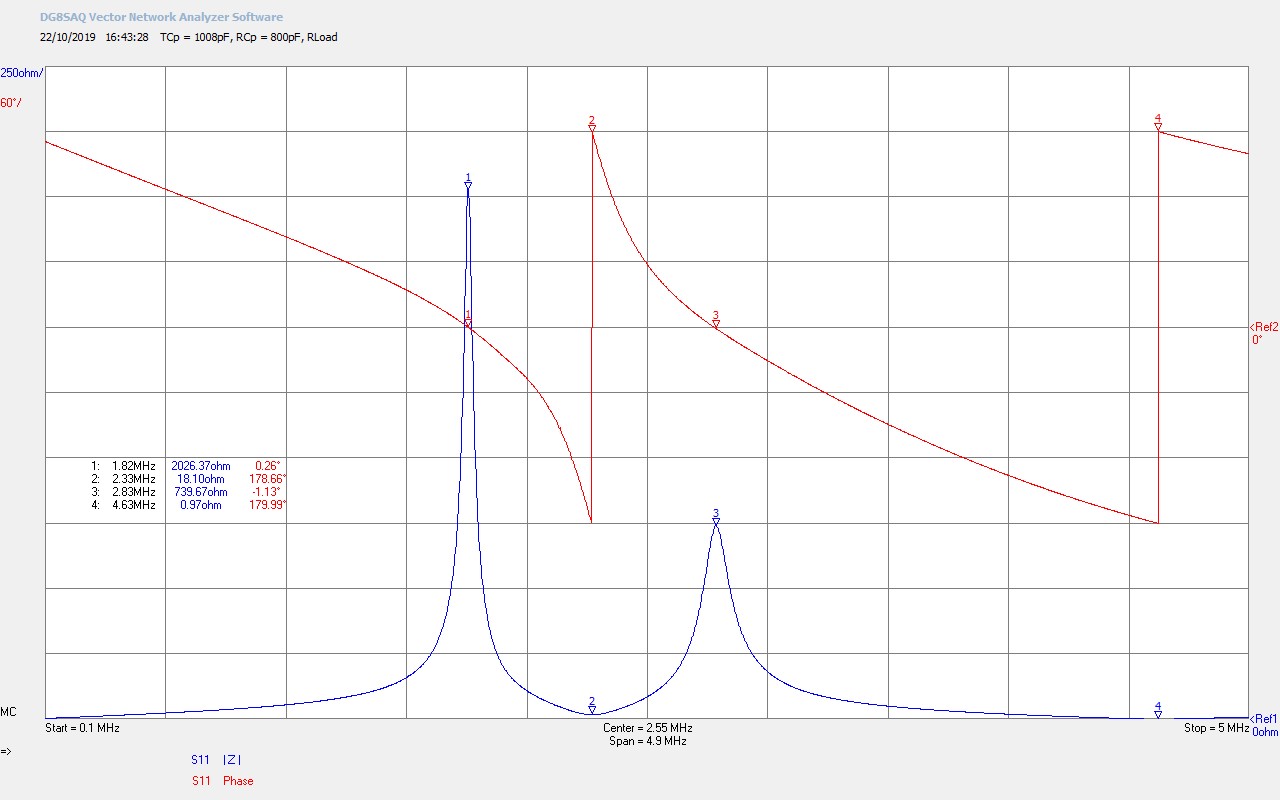
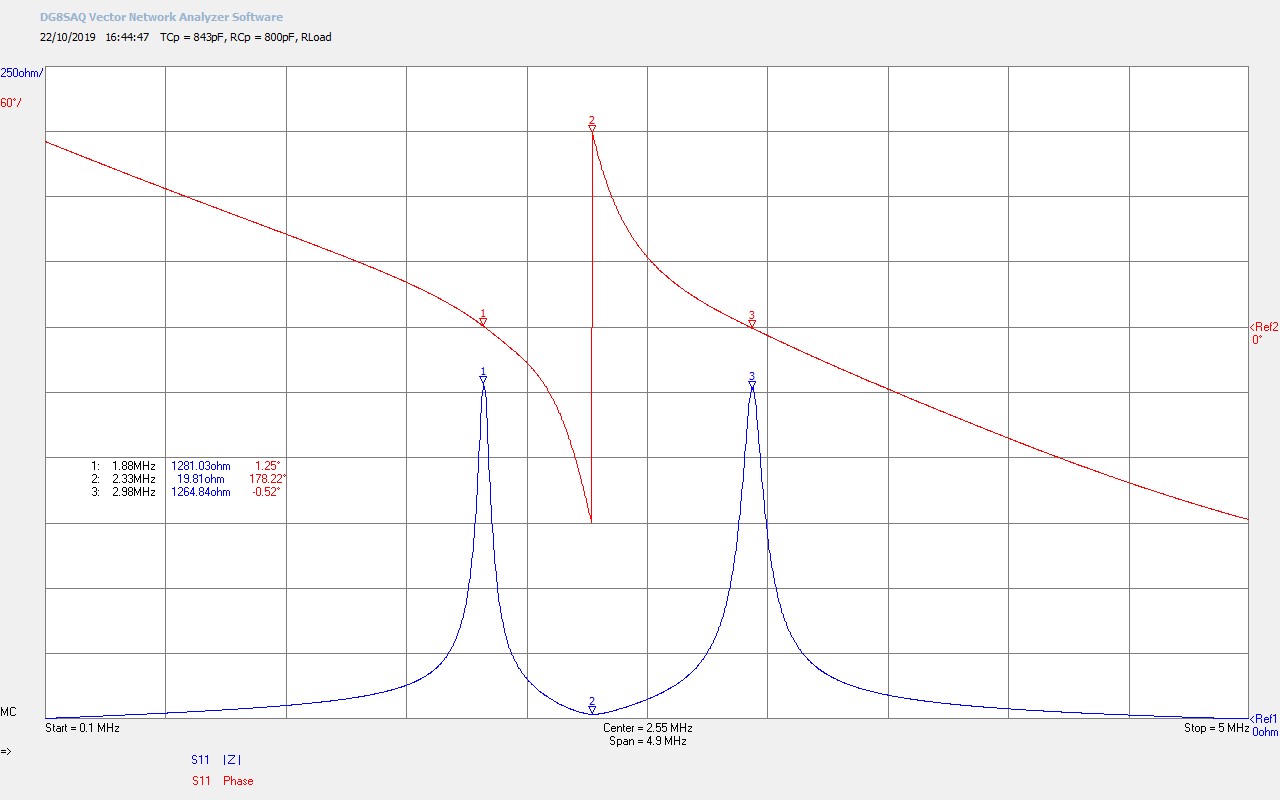
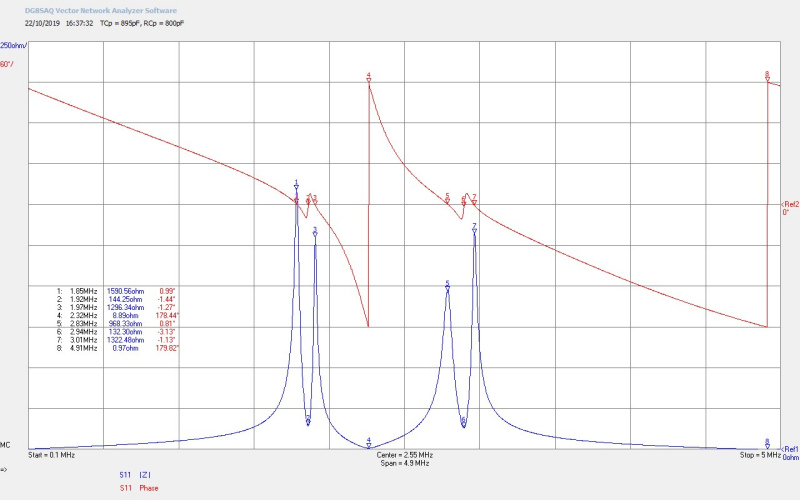
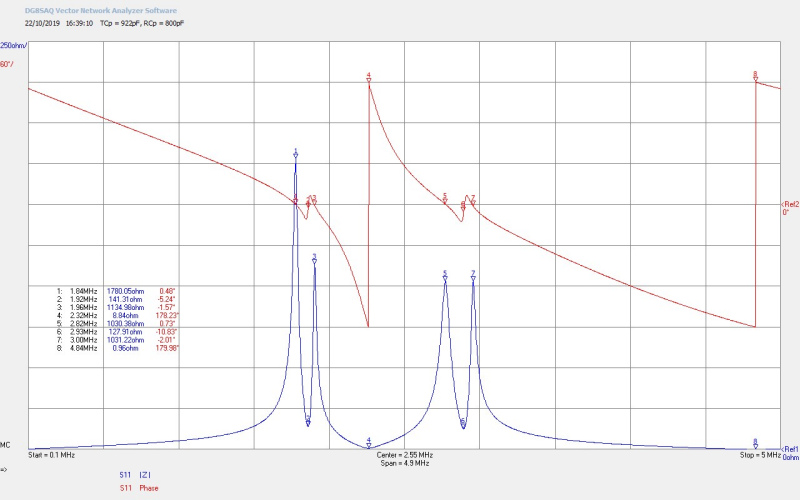
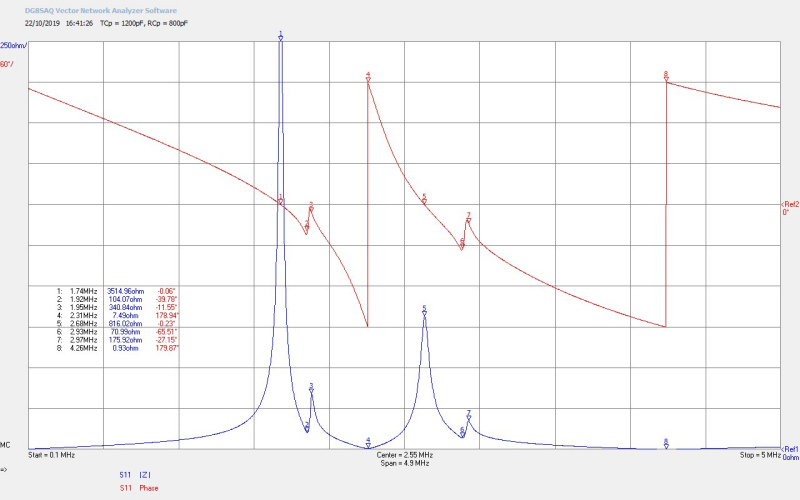
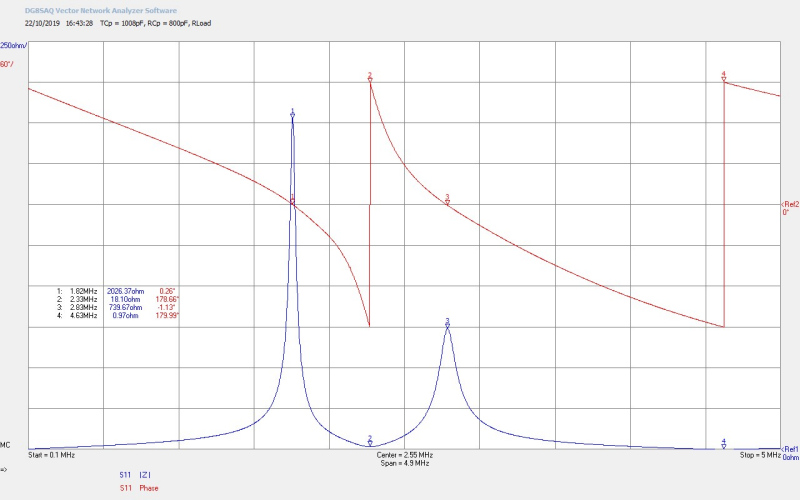
Figures 2 below show in detail some of the additional measurements made during the experiment including the overall impedance properties Z11 of the experimental circuit from the perspective of the generator, the different drive conditions applied from the generator, and the NR characteristics of the CSG measured on the Tektronix 576 I-V curve tracer.

To view the large images in a new window whilst reading the explanations click on the figure numbers below:

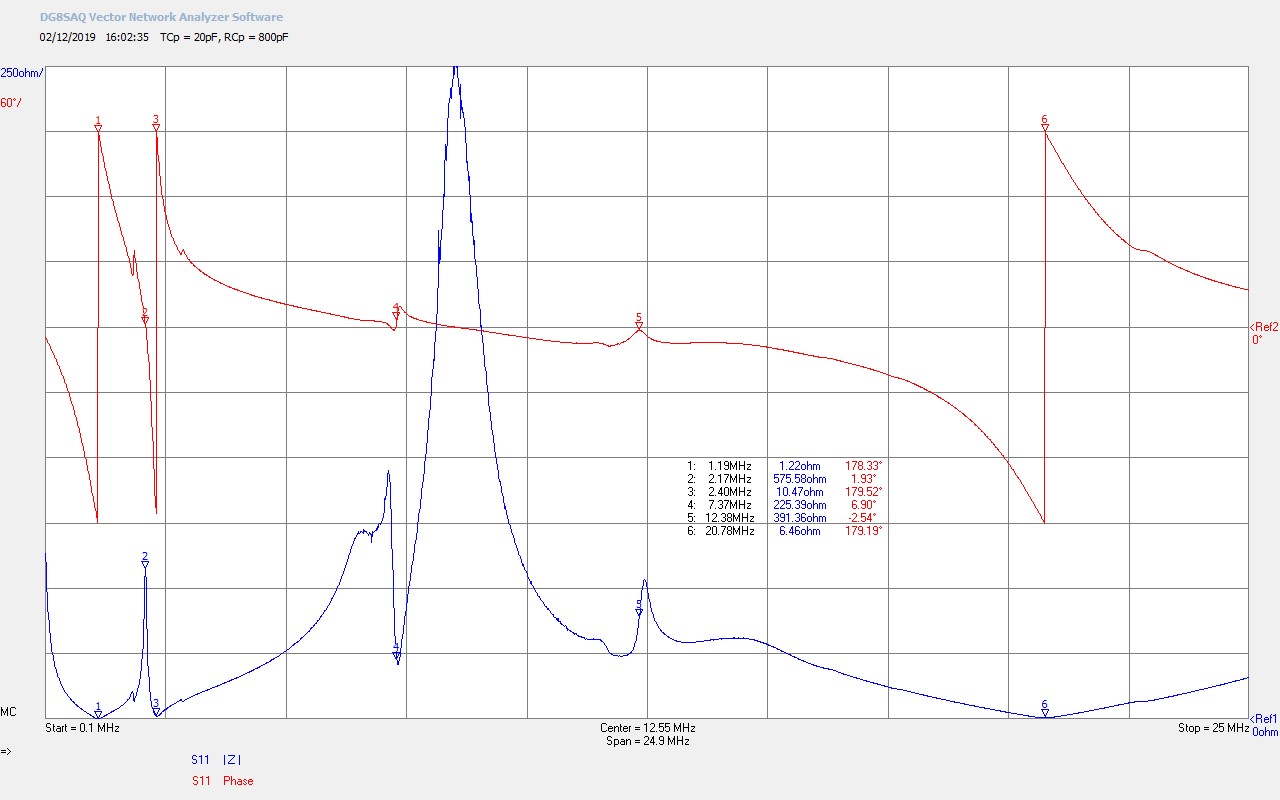
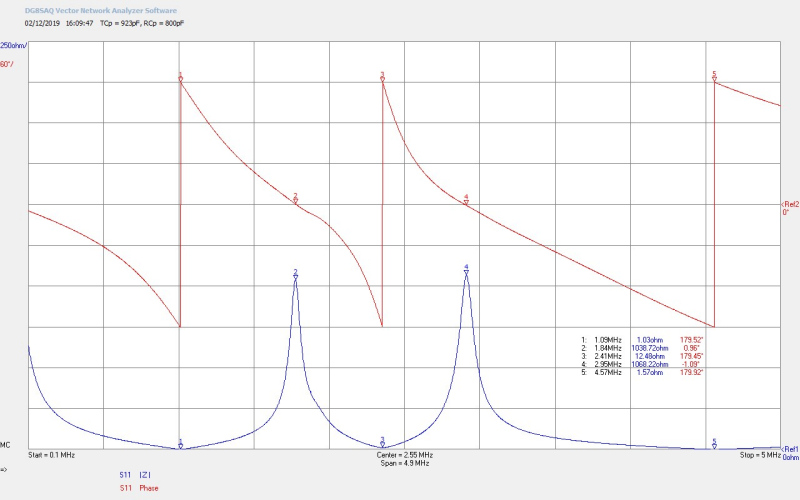
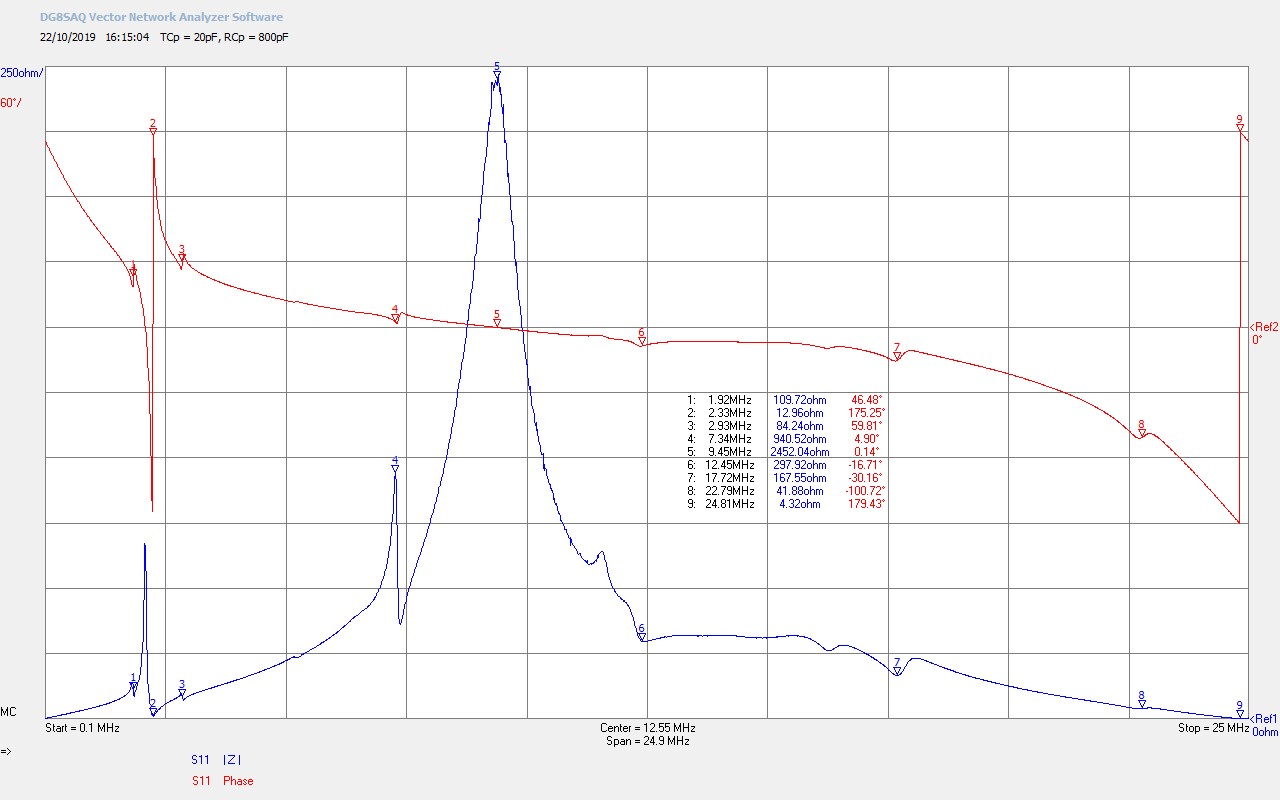
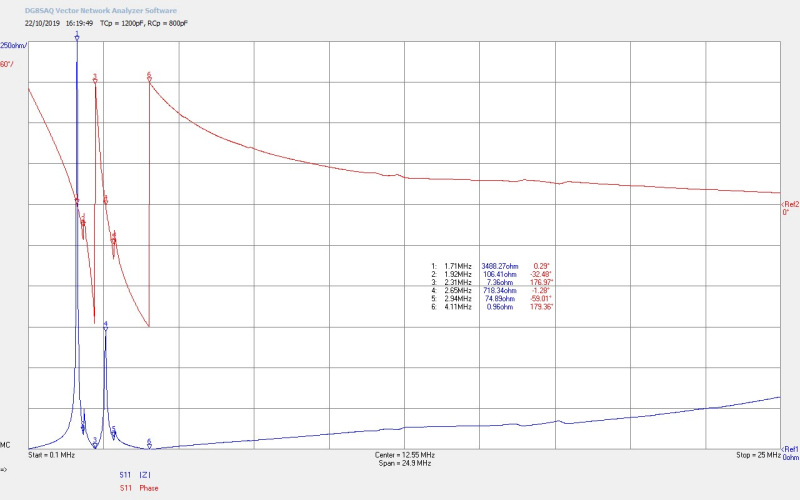
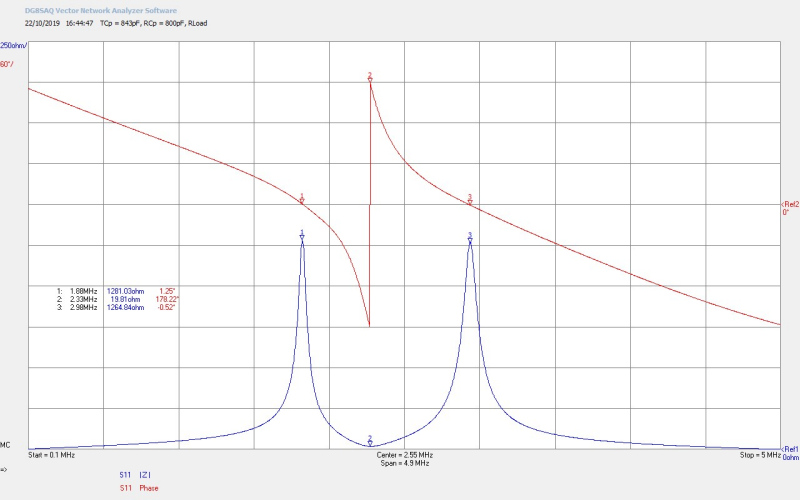
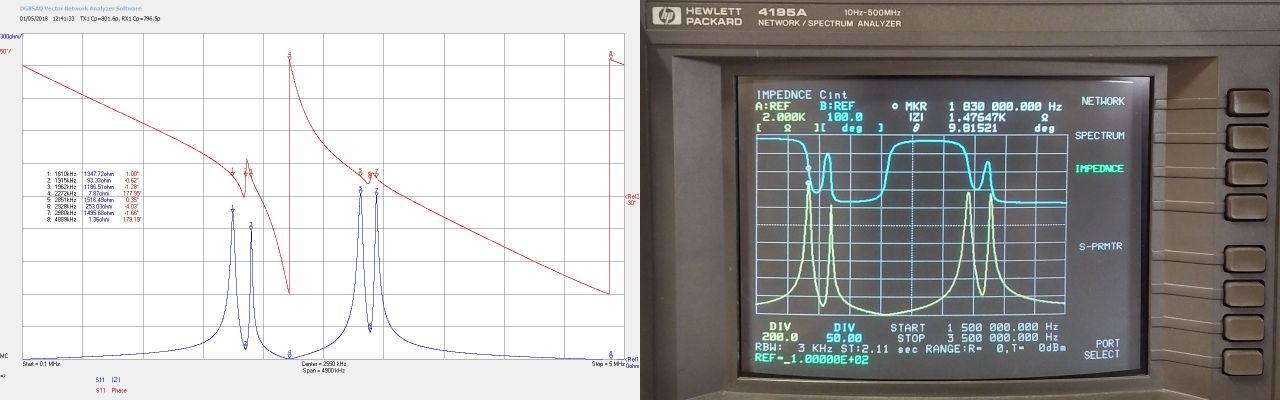
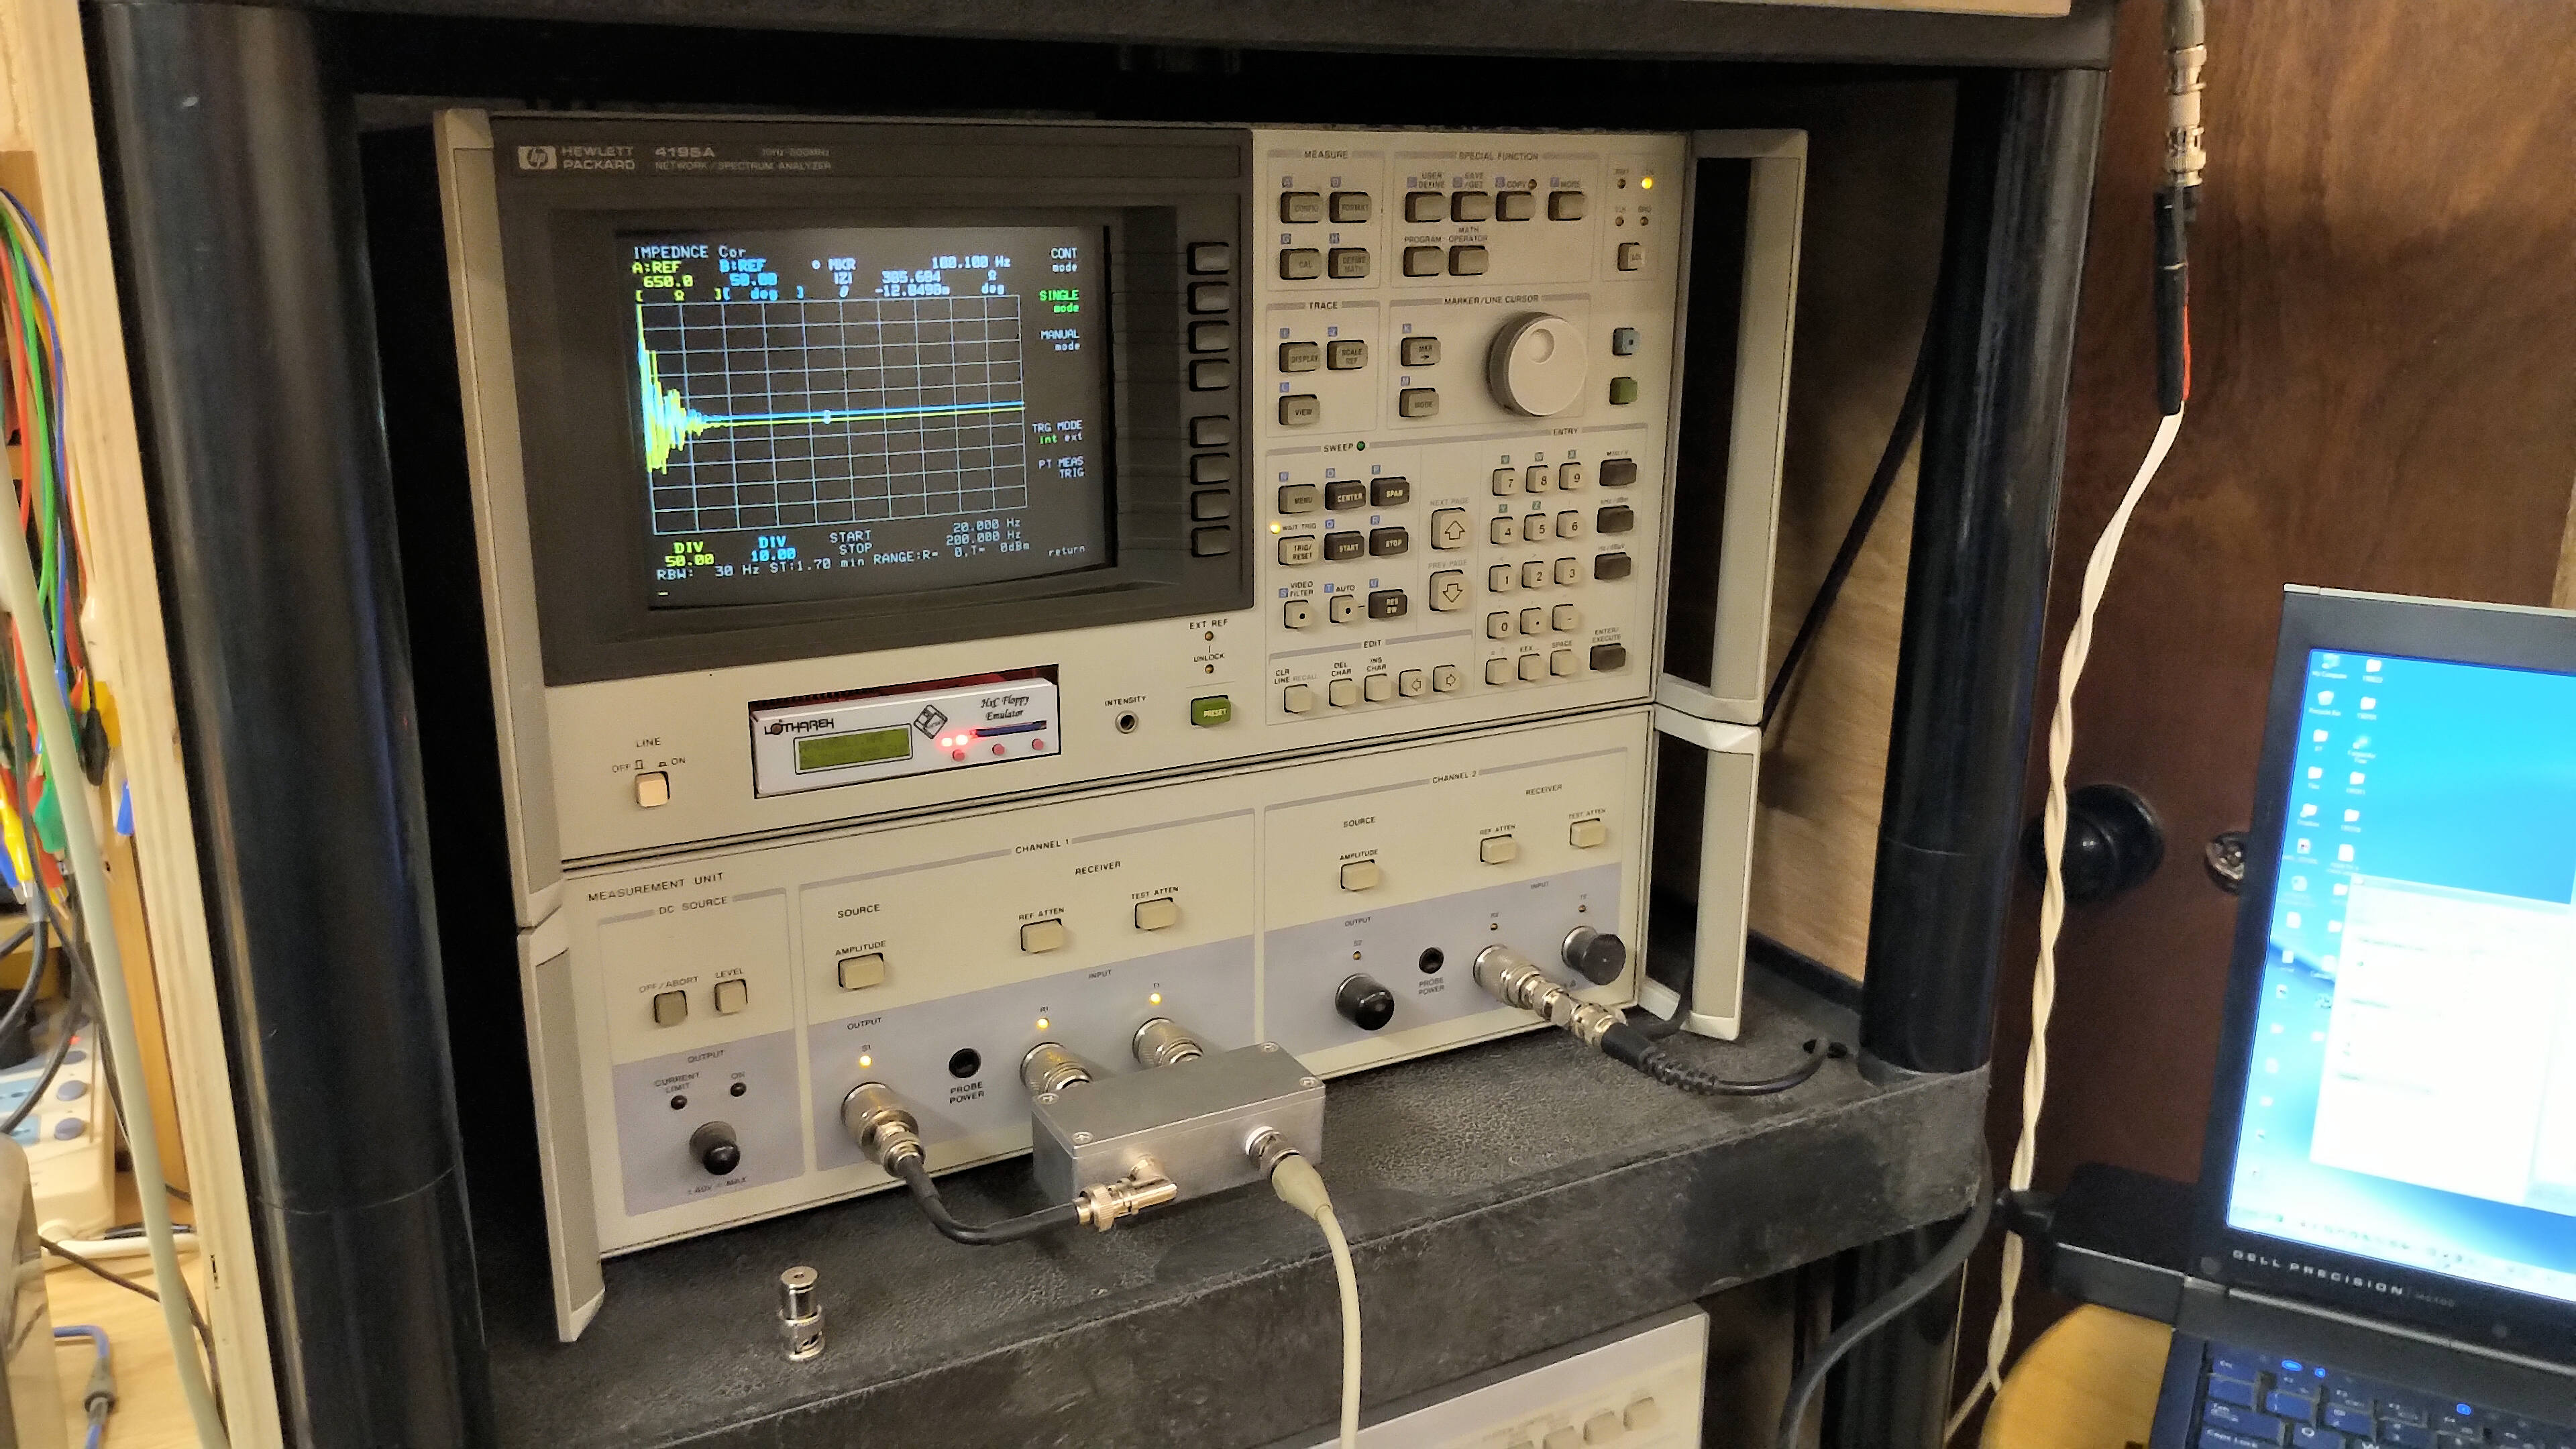
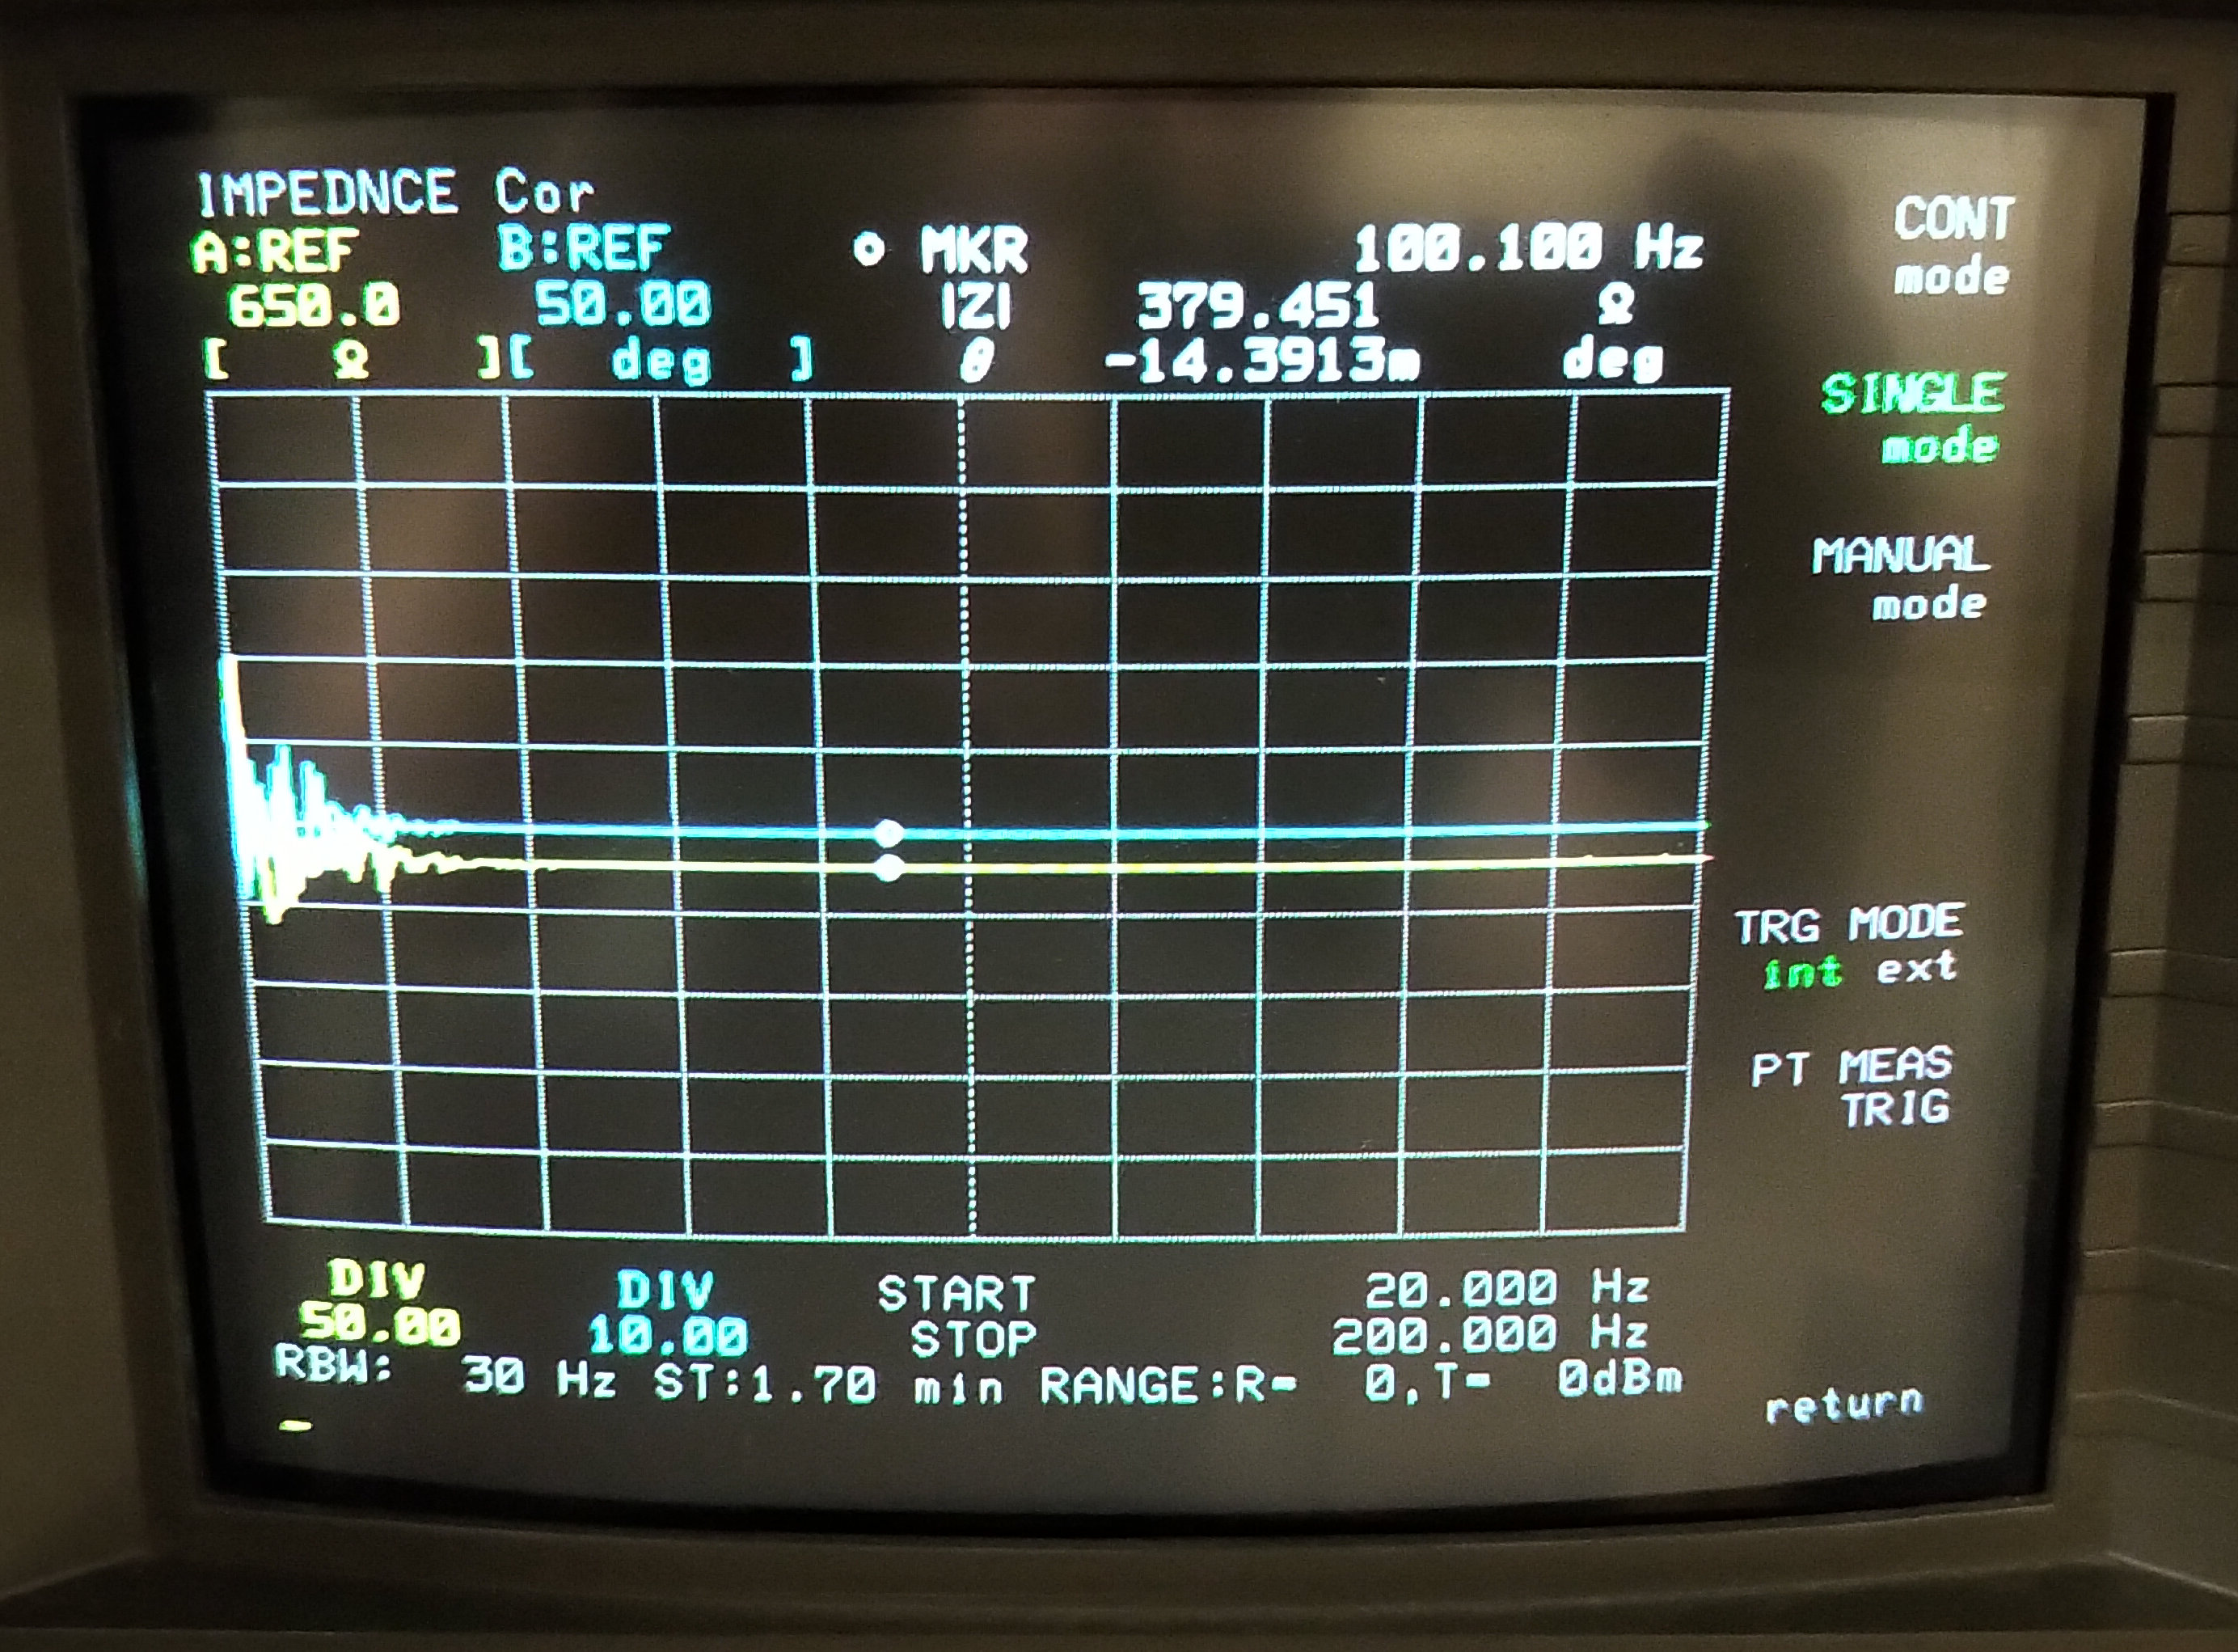
Fig 3.1. Here we look at the low frequency small signal input impedance Z11 from the perspective of the generator, using the HP4195A network analyser. The circuit was measured and compared in two conditions, firstly with the carbon electrodes touching at the ends forming a short-circuit, and secondly with the electrodes parted and the vacuum relay activated to shunt the electrode gap with a short-circuit path through the relay. In both of these cases the impedance measured was the same in magnitude and phase and shows that above 25Hz and up to 200Hz the circuit is completely resistive at a constant 379.5Ω, and constant phase of ~ 0° (-14.4 mdeg @ 100.1Hz). Below 25Hz will also be a continuous constant resistive impedance but requires considerably reduced resolution bandwidth to remove the measurement noise observed. A reduced resolution bandwidth in this case represents a considerably increased scan time for the measurement. This measurement shows that there are no unusual impedance characteristics at the base drive line frequency, no resonant characteristics, and that the circuit appears as a constant resistive load that results almost entirely from the cold resistance of the incandescent lamp filaments, 2 x 25W in series, (in the range 175 – 200Ω each).

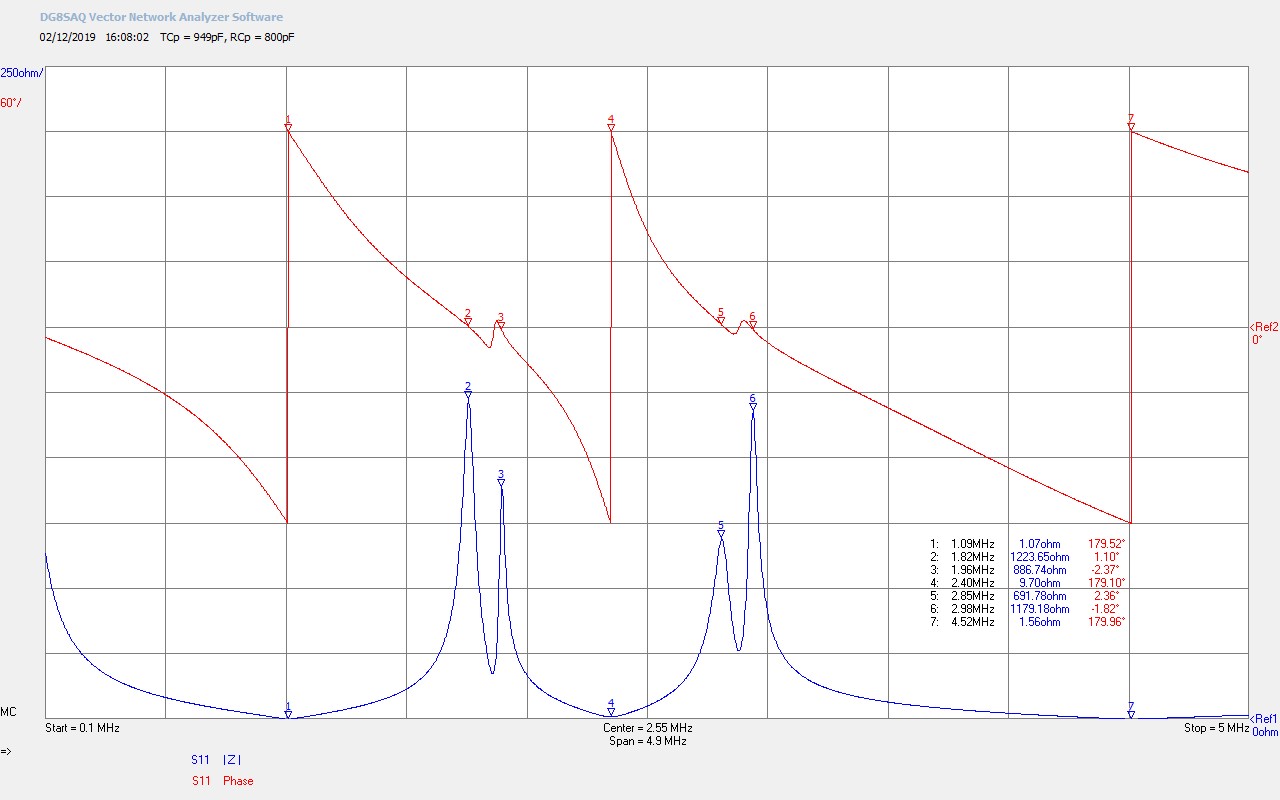
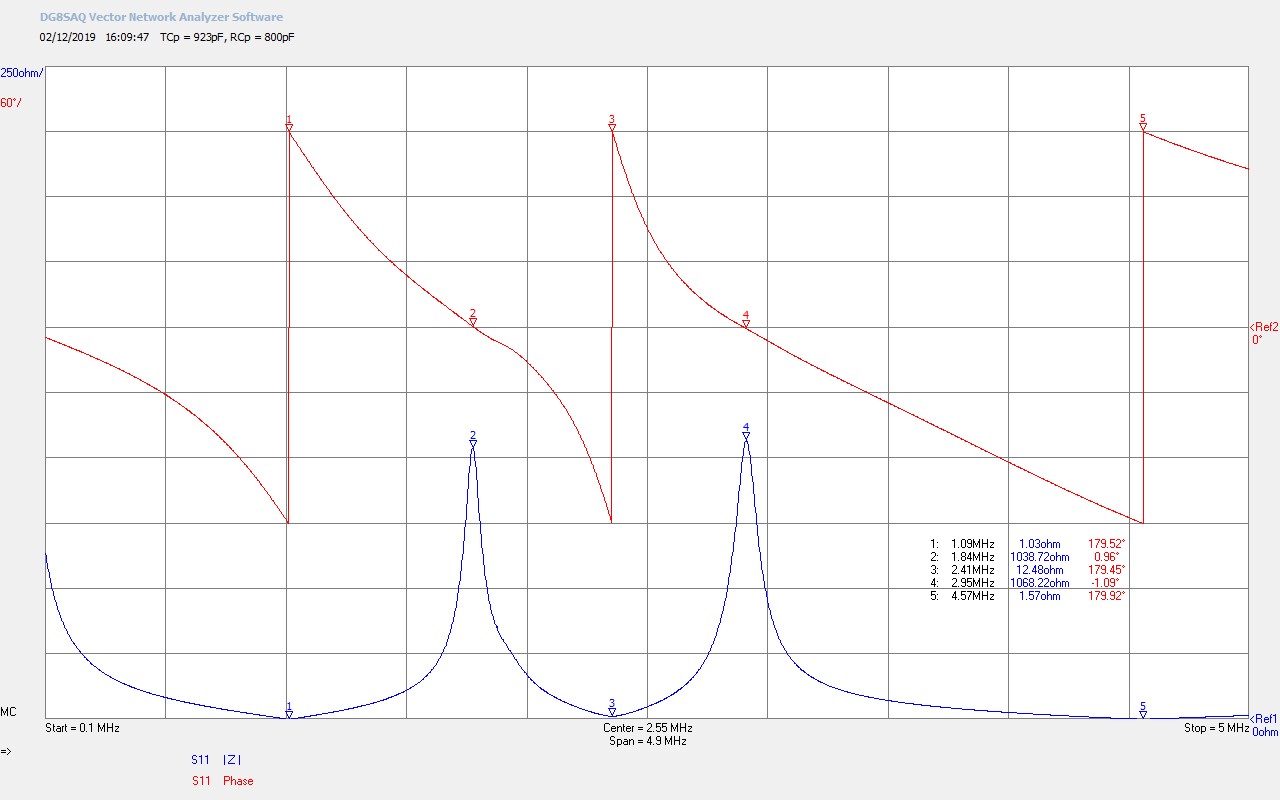
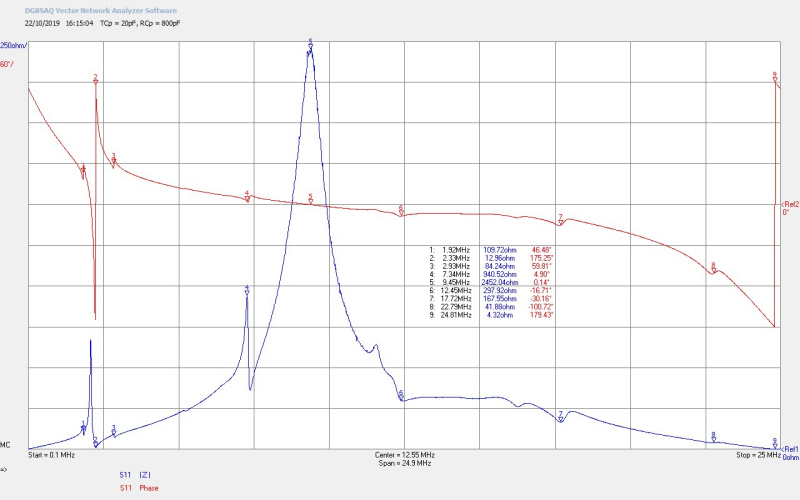
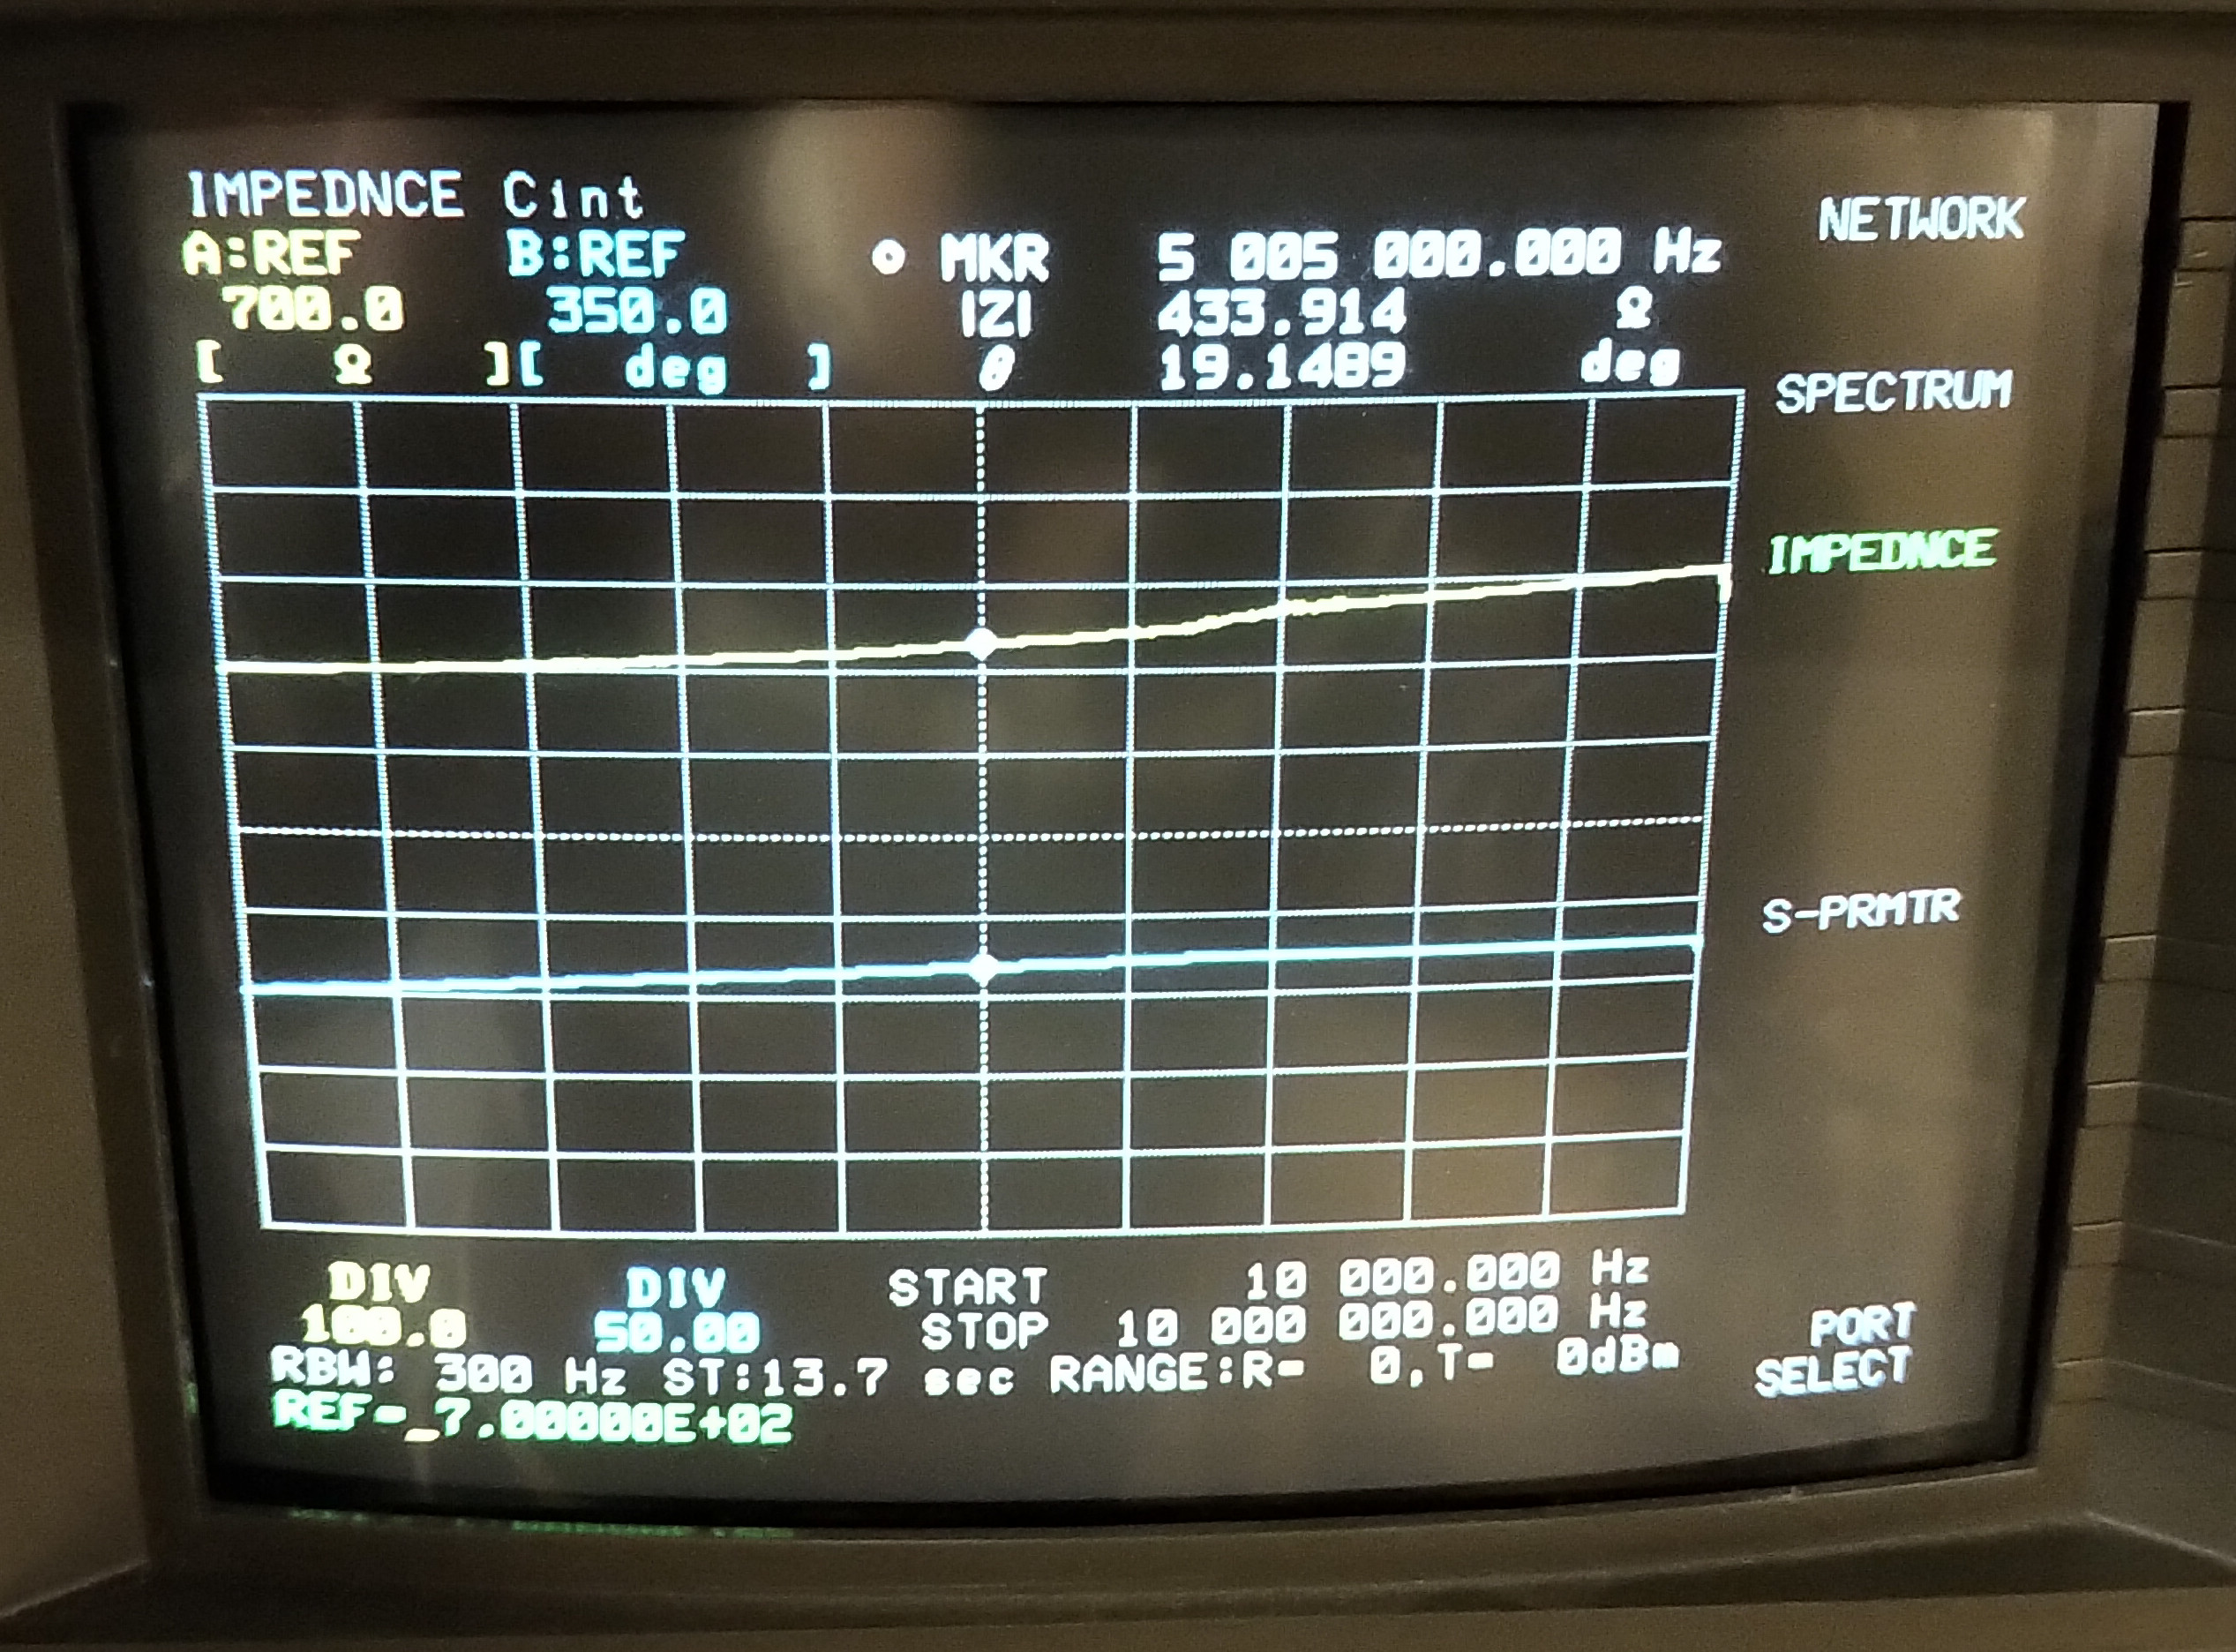
Fig 3.2. Shows the HF small signal input impedance Z11 from the perspective of the generator up to 10Mc, using the HP4195A network analyser. The SCR in the HV supply creates a switched output from the incoming sinusoidal line supply, (see Fig. 3.1 here for detailed input and output waveforms), which means there are many higher frequencies present at the output of the HV transformer. This constitutes a non-linear transient drive to the experimental circuit, which is the summation of many higher frequencies, and hence higher frequency characteristics of the circuit impedance contribute to the overall circuit operation, and may play a part in the observed phenomena. This is then combined with the high frequency transient switching in the spark gap itself, which adds a much wider band of available frequencies, and the all important impulse-like currents in and around the abnormal glow discharge region.  We can see from this measurement that the resistive impedance rises gradually with frequency reaching ~ 434Ω @ 5Mc, and ~503Ω @ 10Mc. There are no significant features in the measured band, the circuit is not self-resonant up to 10Mc, and the overall circuit is largely resistive with a small amount of series stray inductance from the the wiring.

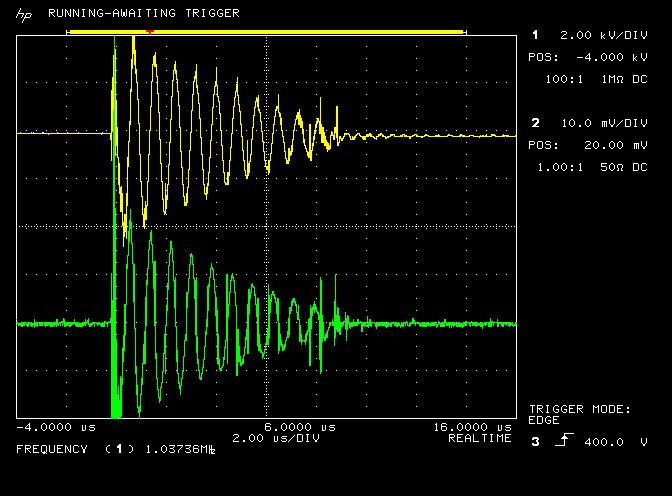
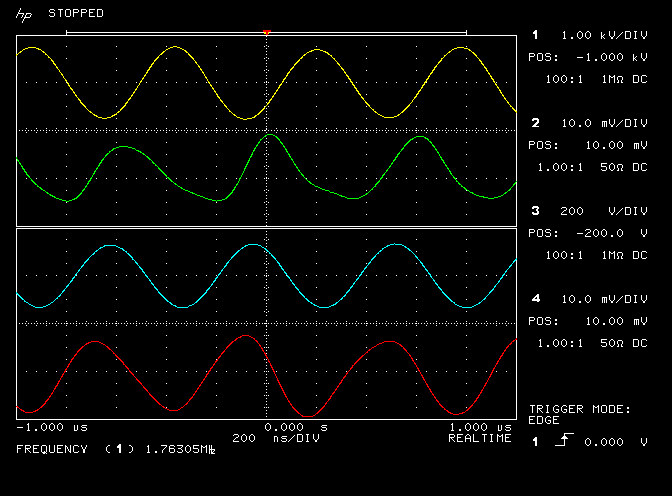
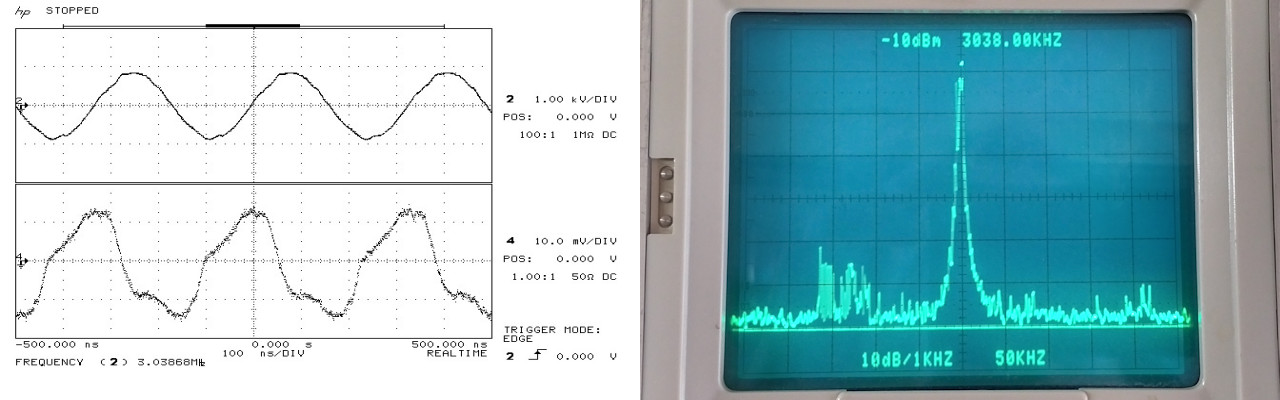
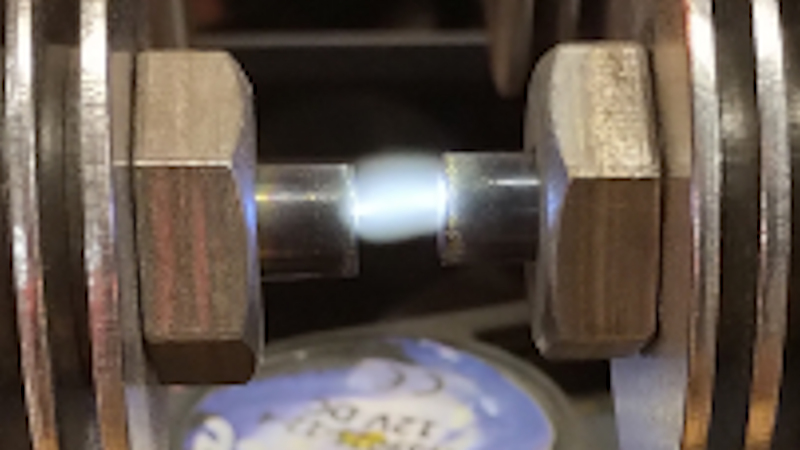
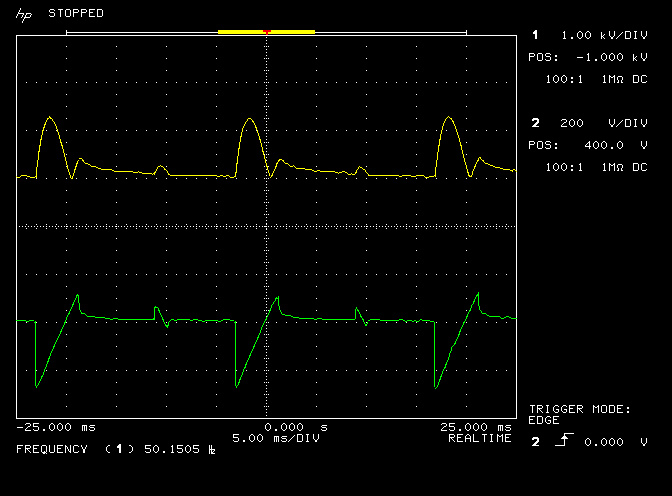
Fig 3.3. Shows the oscilloscope waveforms both for the input to the HV transformer at the output of the SCR (green), and the output of the HV rectifier at the input to the experimental circuit (yellow), where the circuit is set with the vacuum relay closed across the CSG. The SCR output shows how the line sinusoid is chopped into a small section, in this case part of the negative half of the cycle, providing pulses of input current to the HV transformer. The output of the HV rectifier is a voltage magnified pulse train up to ~ 2kV, and set at ~1.3kV peak for this experiment. This output level is sufficient to generate discharges in the CSG, whilst low enough to allow fine control of the I-V characteristics through electrode gap adjustment.

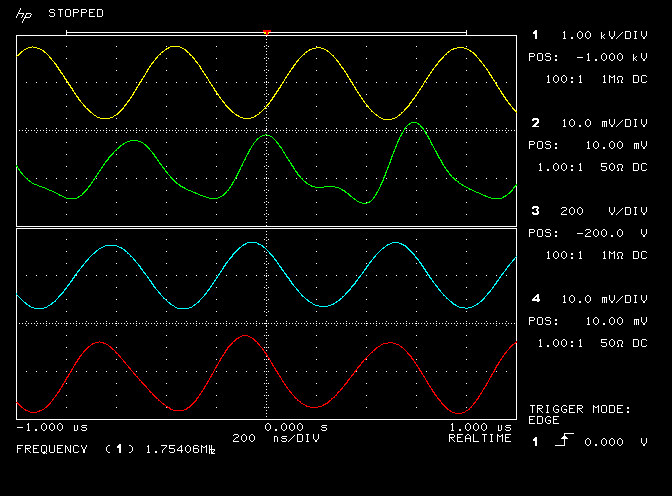
Fig 3.4. Here the vacuum relay has been opened and the CSG adjusted to utilise the NR region around the abnormal glow section of the I-V characteristics. The basic form of the waveforms are the same as in Fig. 3.3 with the addition of some impulse currents from discharges in the CSG, an increase in peak voltage at the output of the HV transformer ~ 1.8kV, and a slight increase in the “on” cycle of the SCR from ~ 4ms to 5ms. This corresponds to increased brightness in the lamp loads, an increased current in the experimental circuit from ~ 100mA to 125mA, and an increase in the power drawn from the line supply ~ 50W to 80+ W. The bias adjustment of the SCR remains the same as for the condition in Fig 3.3, yet clearly by operating the CSG around the abnormal glow region of its characteristics more power is drawn in through the line supply, reflecting a reduction in impedance in the experimental circuit below that of the normal short-circuit impedance at the CSG electrodes or through the vacuum relay. When the experimental circuit is biased at this point the region between the carbon electrodes is mostly dark and visibly discharge free, with the occasional momentary white flash as a discharge occurs across the electrodes when point G (Fig. 2) is reached.

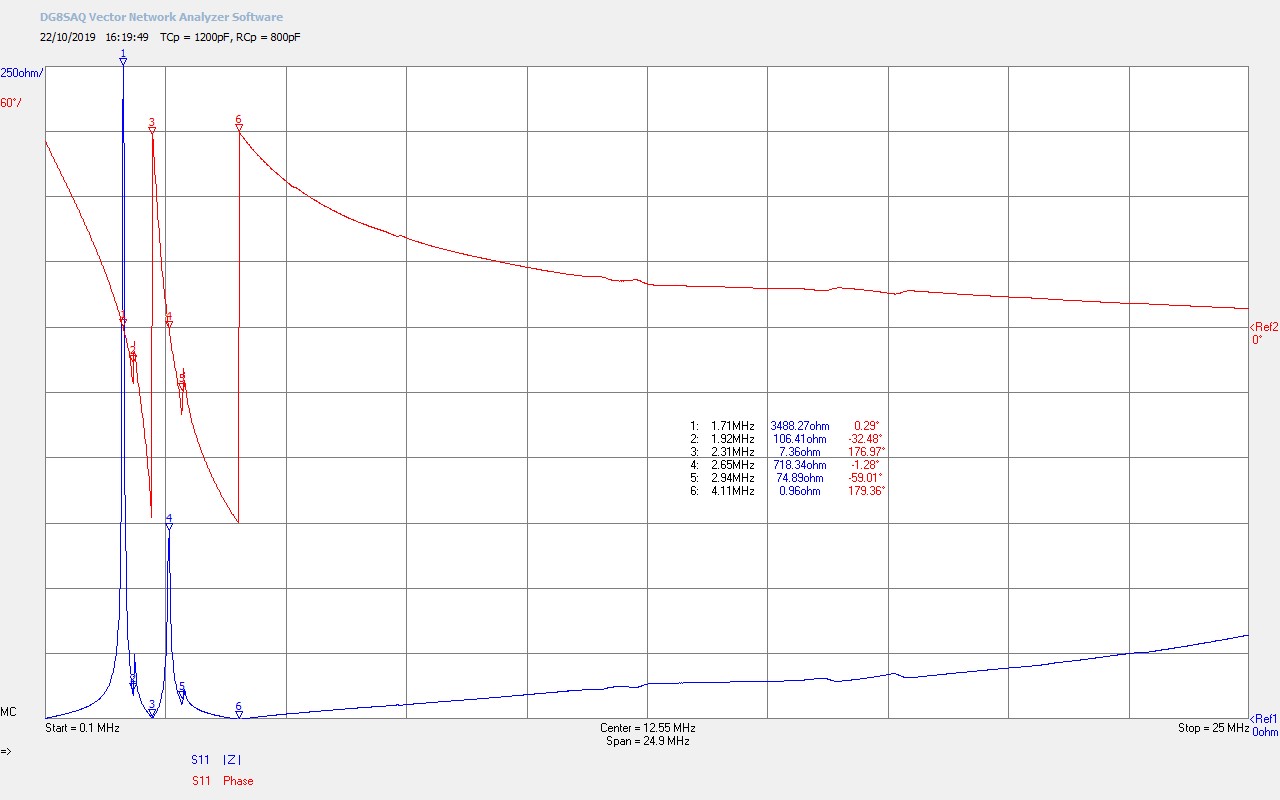
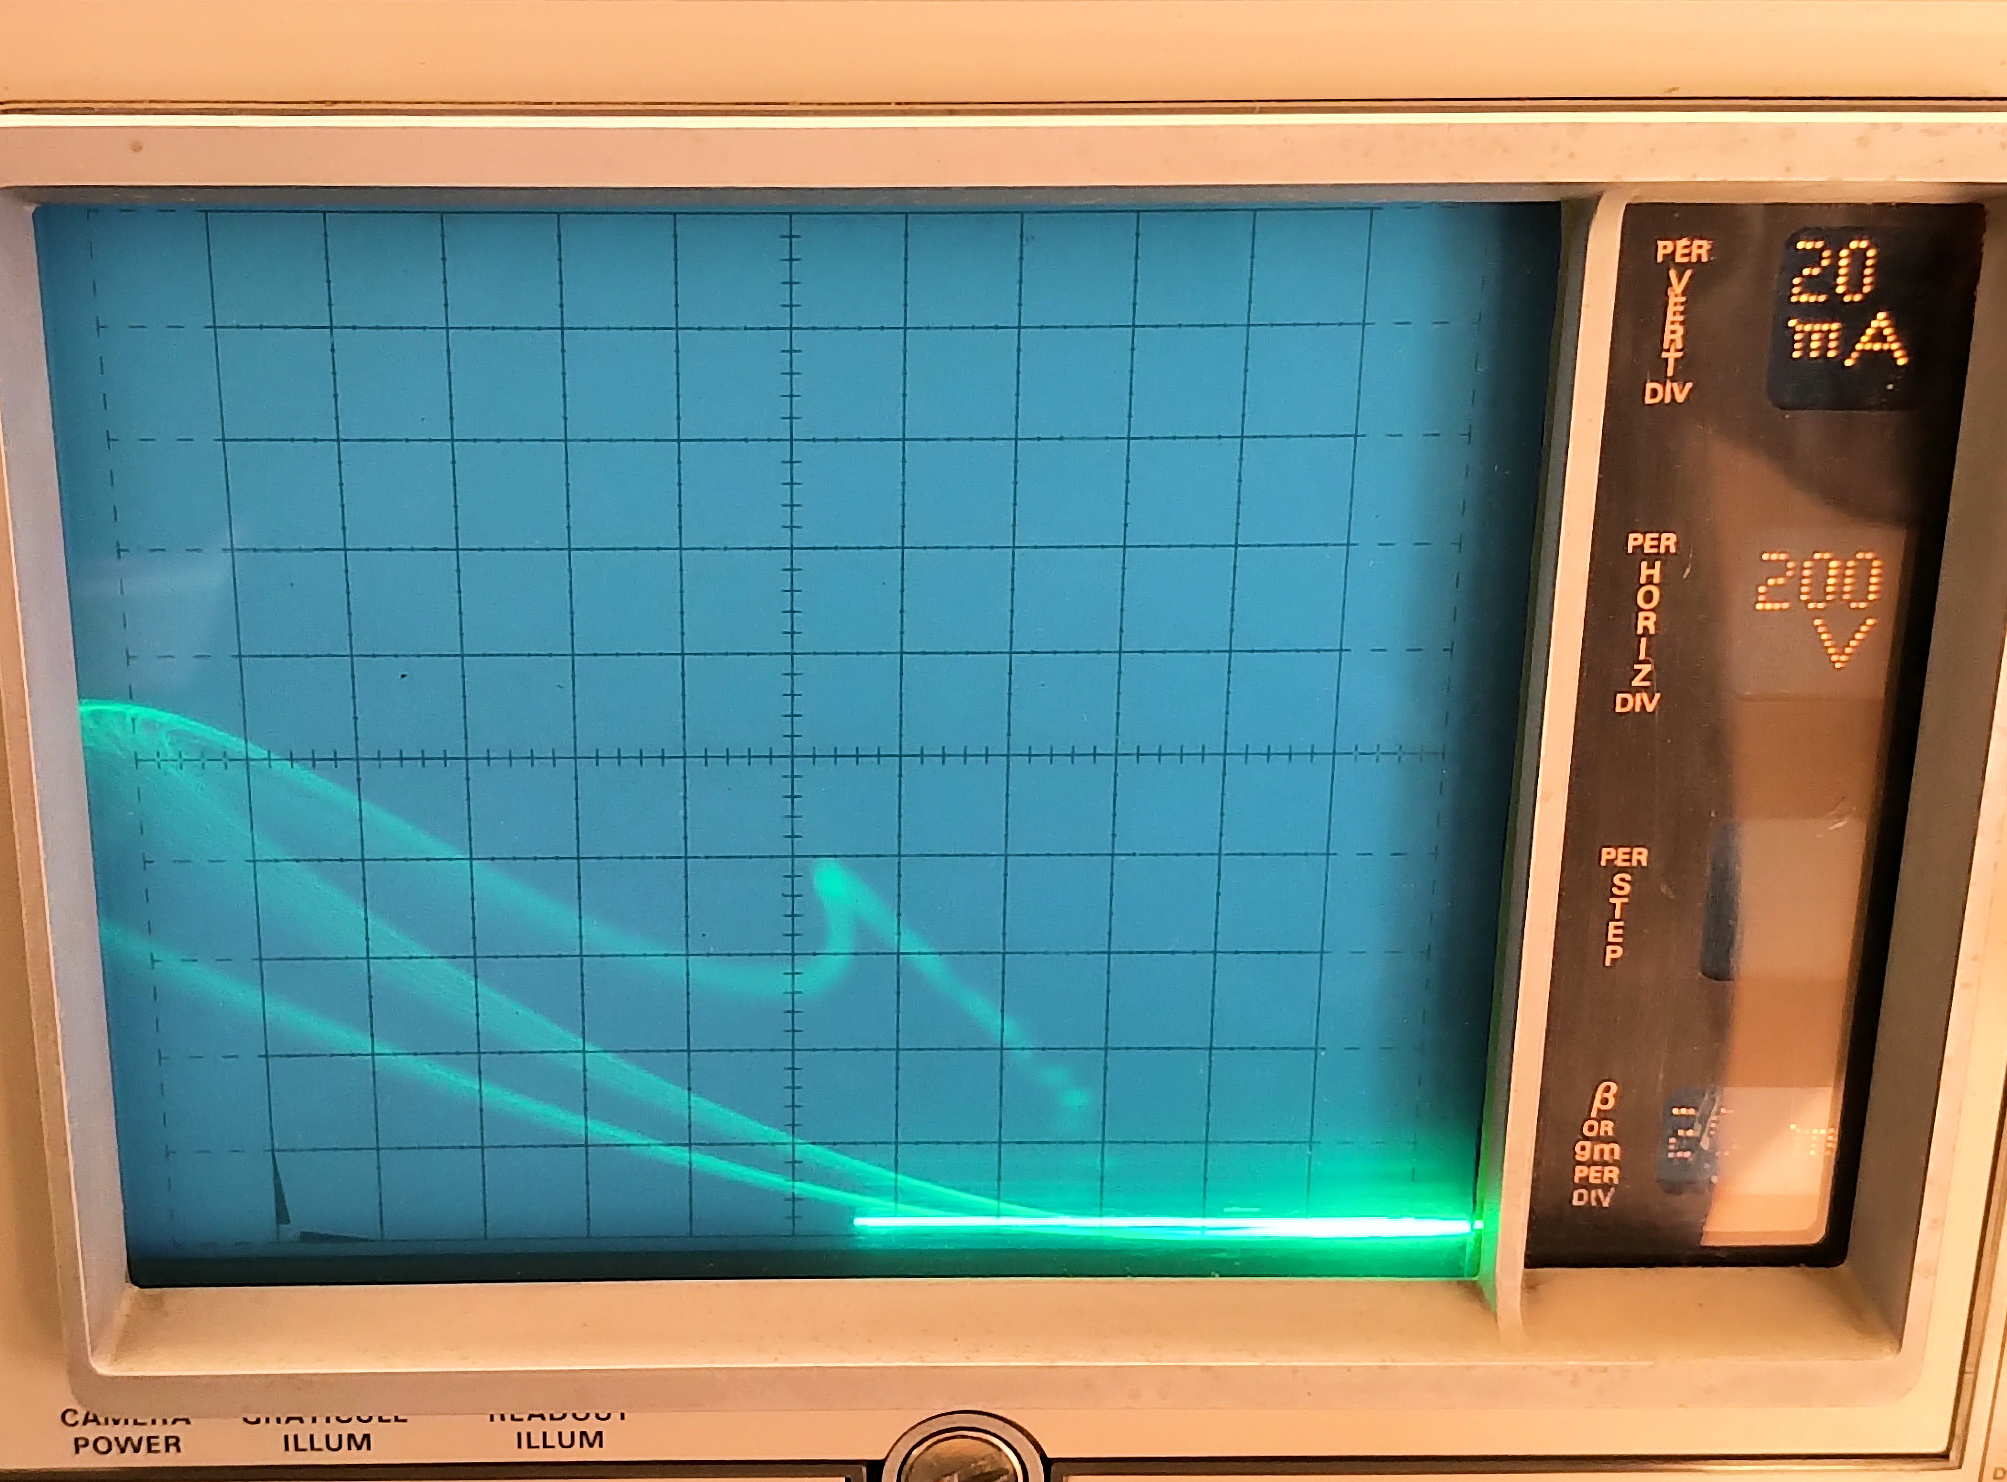
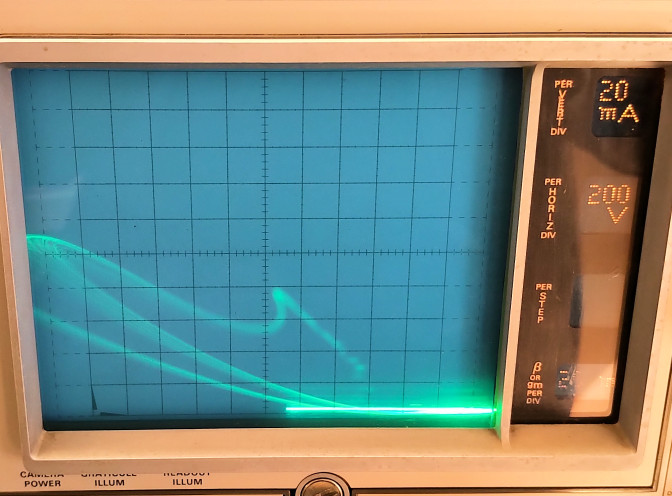
Fig 3.5. Shows the I-V characteristics of the CSG as measured on a Tektronix 576 curve tracer. The advantage of a purely analog curve tracer like this is that negative resistance can be easily visualised through the unusual movement of the beam spot, which through the thickness and luminescence of the trace shows the speed of movement, and through the path of the spot often in arcs and loops, the unusual characteristics of NR regions and transitions. In this test the output power of the tracer is limited to 2.2W at maximum voltage bias of 1500V. With the current in the CSG restricted with a high series resistance (300kΩ) arc discharge does not occur, and the electrical characteristics can be explored prior to the arc discharge at point G. Here the voltage across the electrodes has been increased to the full 1500V output. At the transition voltage the gap enters the NR region and the trace rapidly sweeps negative in a wide arc before coming back toward the centre bias point at around 80mA of current, and still prior to arc discharge. The low luminescence of the arc shows the very rapid transition through this region, and the length of the arc right across to the far left of the screen, shows how the NR effect magnifies the  voltage across the high series resistance in the test circuit.

Fig 3.6. Here the output power of the tracer is set to 10W limit, with a series resistance of 65kΩ. At 1200V output the transition to the NR region is reached, but here the transition is even quicker which less voltage magnification to the left of the screen, and a tighter and more direct path to the same centre bias point of around 80mA of current prior to arc discharge. Without current limiting in the circuit the transition through the NR region is very rapid, which makes biasing a circuit to maintain characteristics at this point both tricky and mostly unstable, as could be seen in the video experiment. It is better to establish a circuit that oscillates around the NR region and hence utilising its unusual properties in a more stable manner, then trying to bias statically to one individual bias point within the NR region.

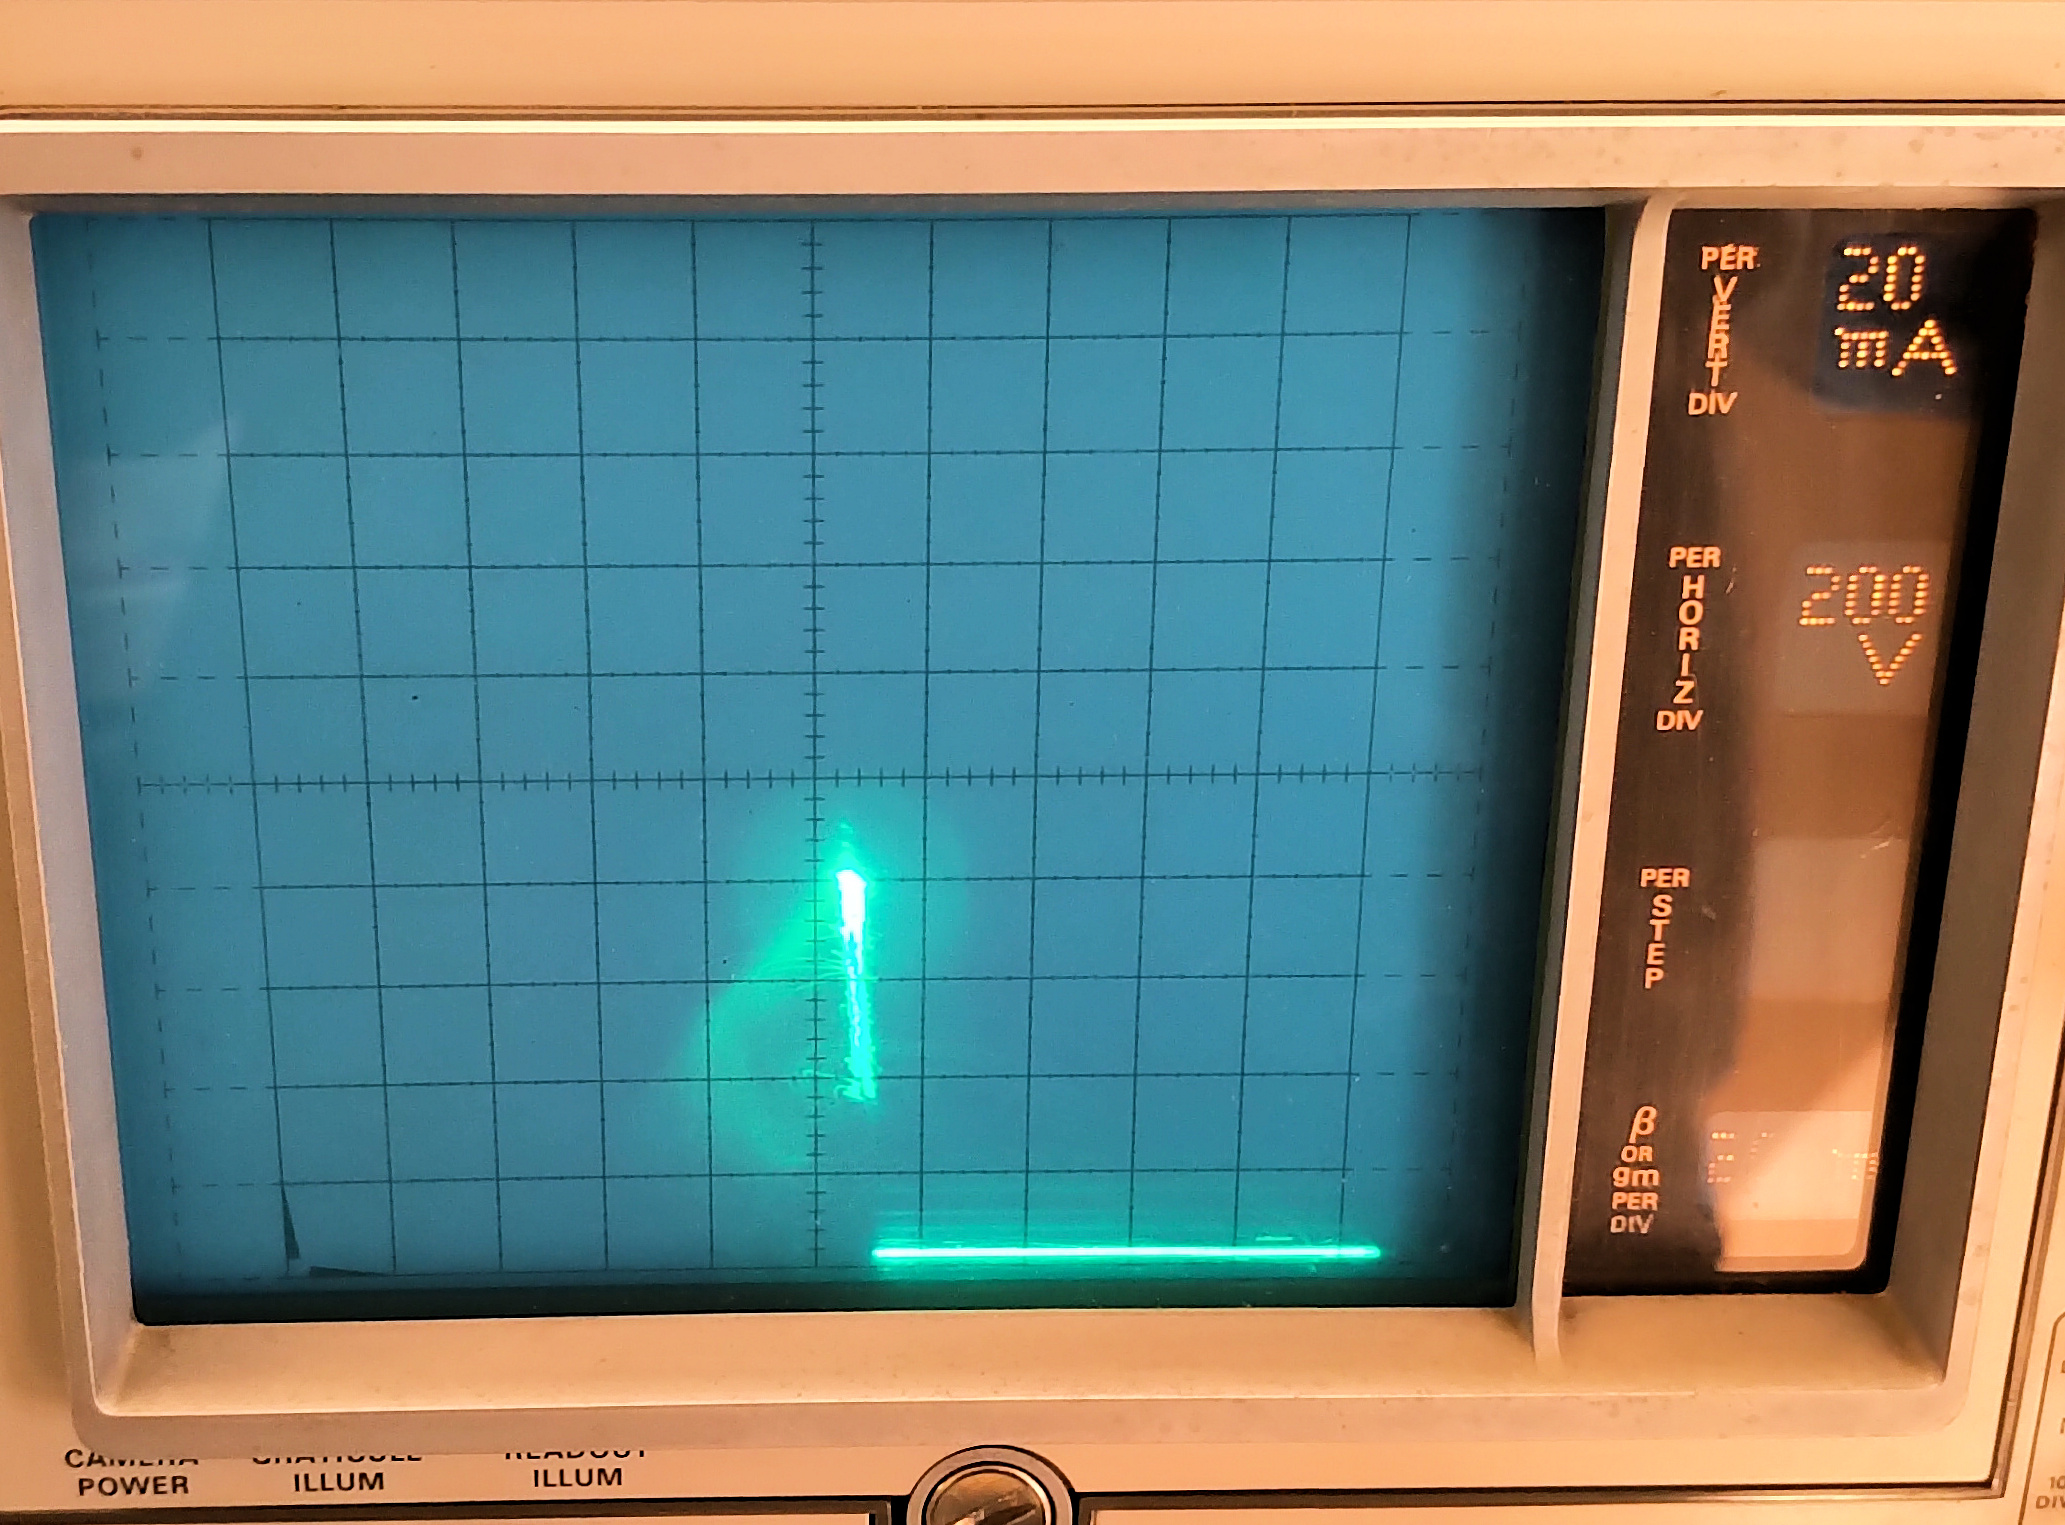
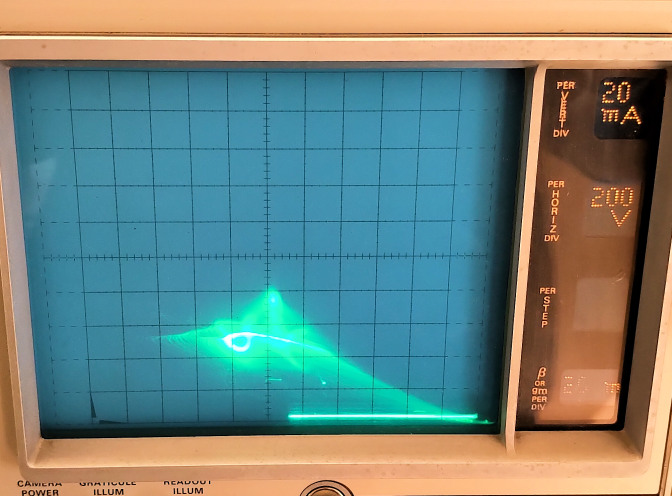
Fig 3.7. Here the output power of the tracer is set to 50W limit, with a series resistance of 14kΩ. At 1100V output the CSG transitions rapidly to arc discharge, indicated by the bright region at about 50V 80mA. The loops of the negative resistance region are just visible, and show now how rapidly the onset of arc discharge occurs when the circuit current is less restricted.

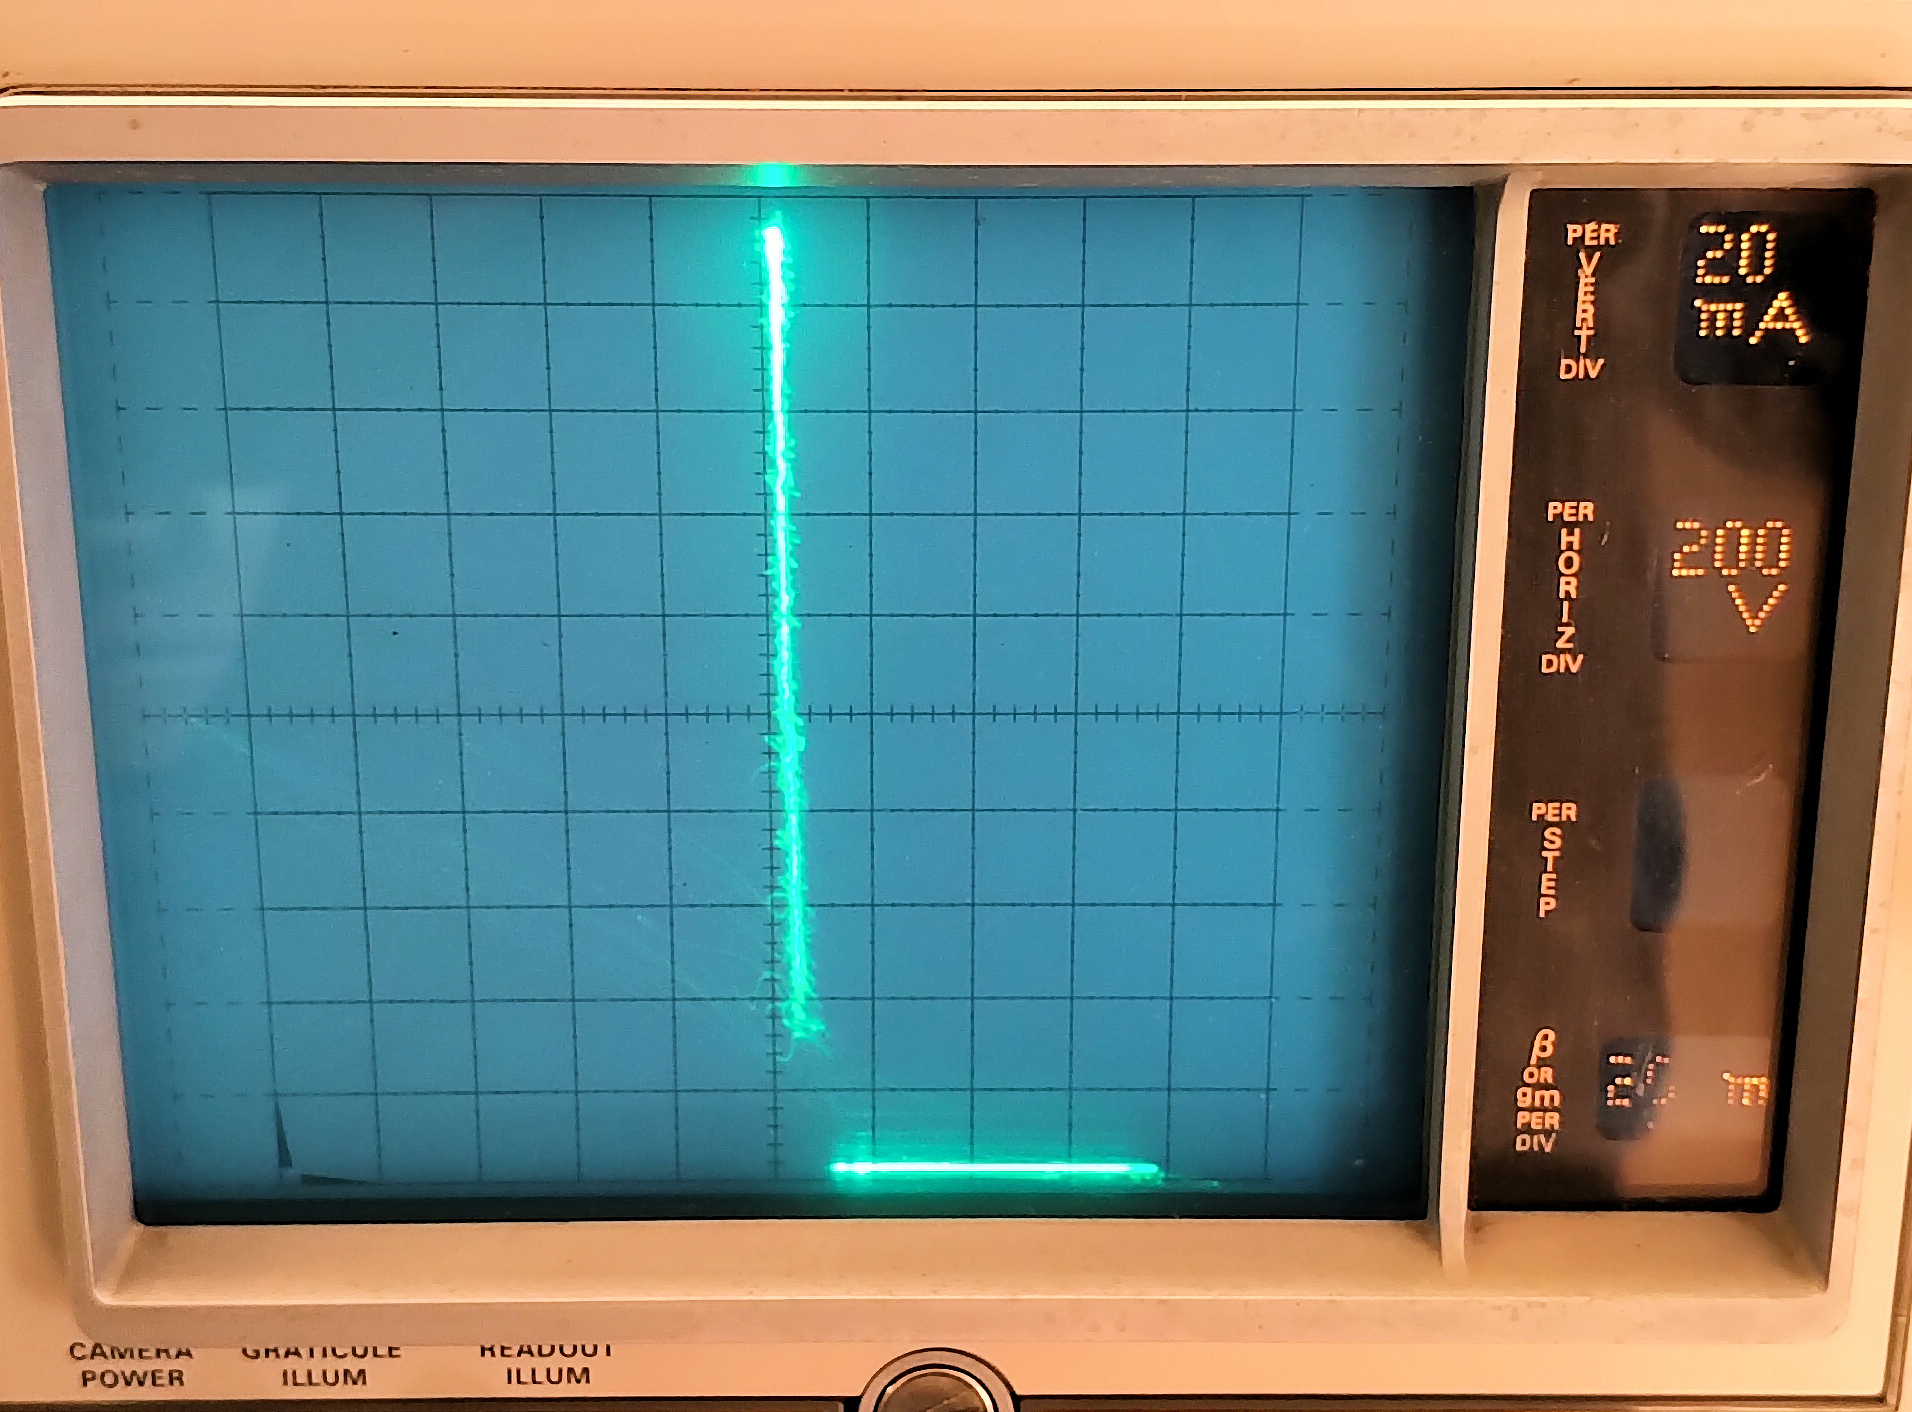
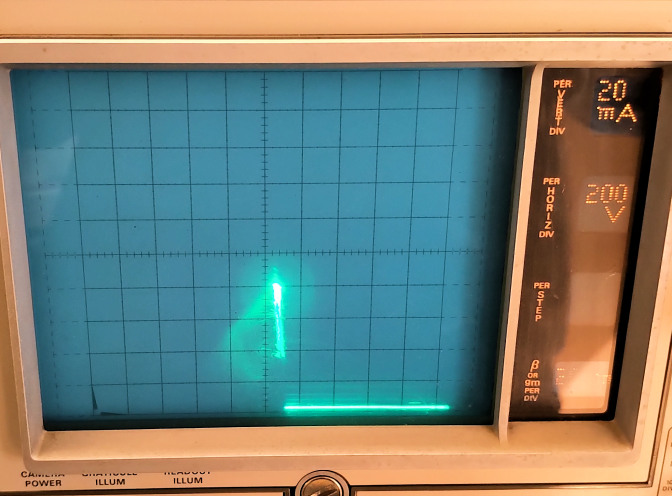
Fig 3.8. Shows the full development of the arc discharge curve at the maximum power output limit of 220W, with a series resistance of 3kΩ. The wide arcs of the negative resistance region are just visible, but the transition through this region is very rapid and in this case utilisation of that region would become very difficult as the characteristics of the CSG are dominated by the arc discharge. With the arc discharge fully developed in region G+ (Fig. 2) it is interesting to note that the impedance presented by the circuit is now higher then the short circuit case, the lamps are dimmer, and a lower current is drawn from the line supply. The impedance of the circuit can be further lowered by shorting the CSG with the vacuum relay, which increases the brilliance of the lamps to the CSG short-circuit case. The impedance of the circuit can be further lowered from the CSG short-circuit case by opening the vacuum relay, and adjusting the electrode spacing to bias the characteristics into the negative resistance region. At this point the lowest impedance of the circuit is presented to the HV supply, drawing the maximum current and hence power from the line supply.

The negative resistance characteristics in the discharge region, and the ability to adjust and utilise this region, appear to be strongly influenced by two material factors in the circuit:

1. The electrode material used for this experiment is carbon which shows a negative resistance region over an adjustable range. It is repeatedly possible, as demonstrated in the video, to adjust and maintain the CSG into the abnormal glow region of the curve and observe unsual phenomena in the circuit. When the carbon electrodes were replaced with tungsten electrodes it became very difficult to adjust the CSG into a region where the NR characteristics could be maintained. Adjustment to the correct bias could only be accomplished momentarily before reverting to the arc discharge region, or the open circuit condition. This suggests that the bias region for the abnormal glow is much narrower and hence much more difficult to select in a metal such as tungsten. As such the properties of carbon are identified as a more suitable material for the I-V characteristics that lend themselves to the utilisation of negative resistance within non-linear electrical systems.

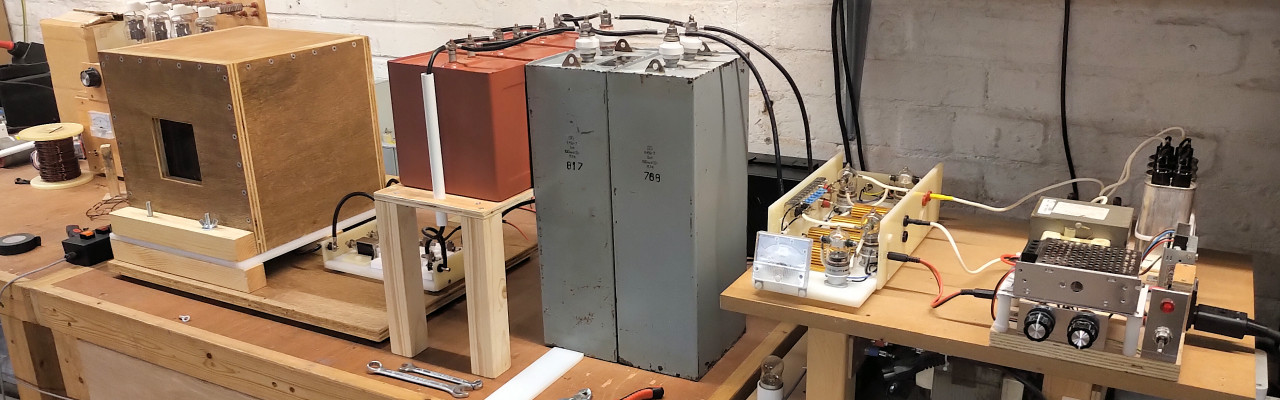
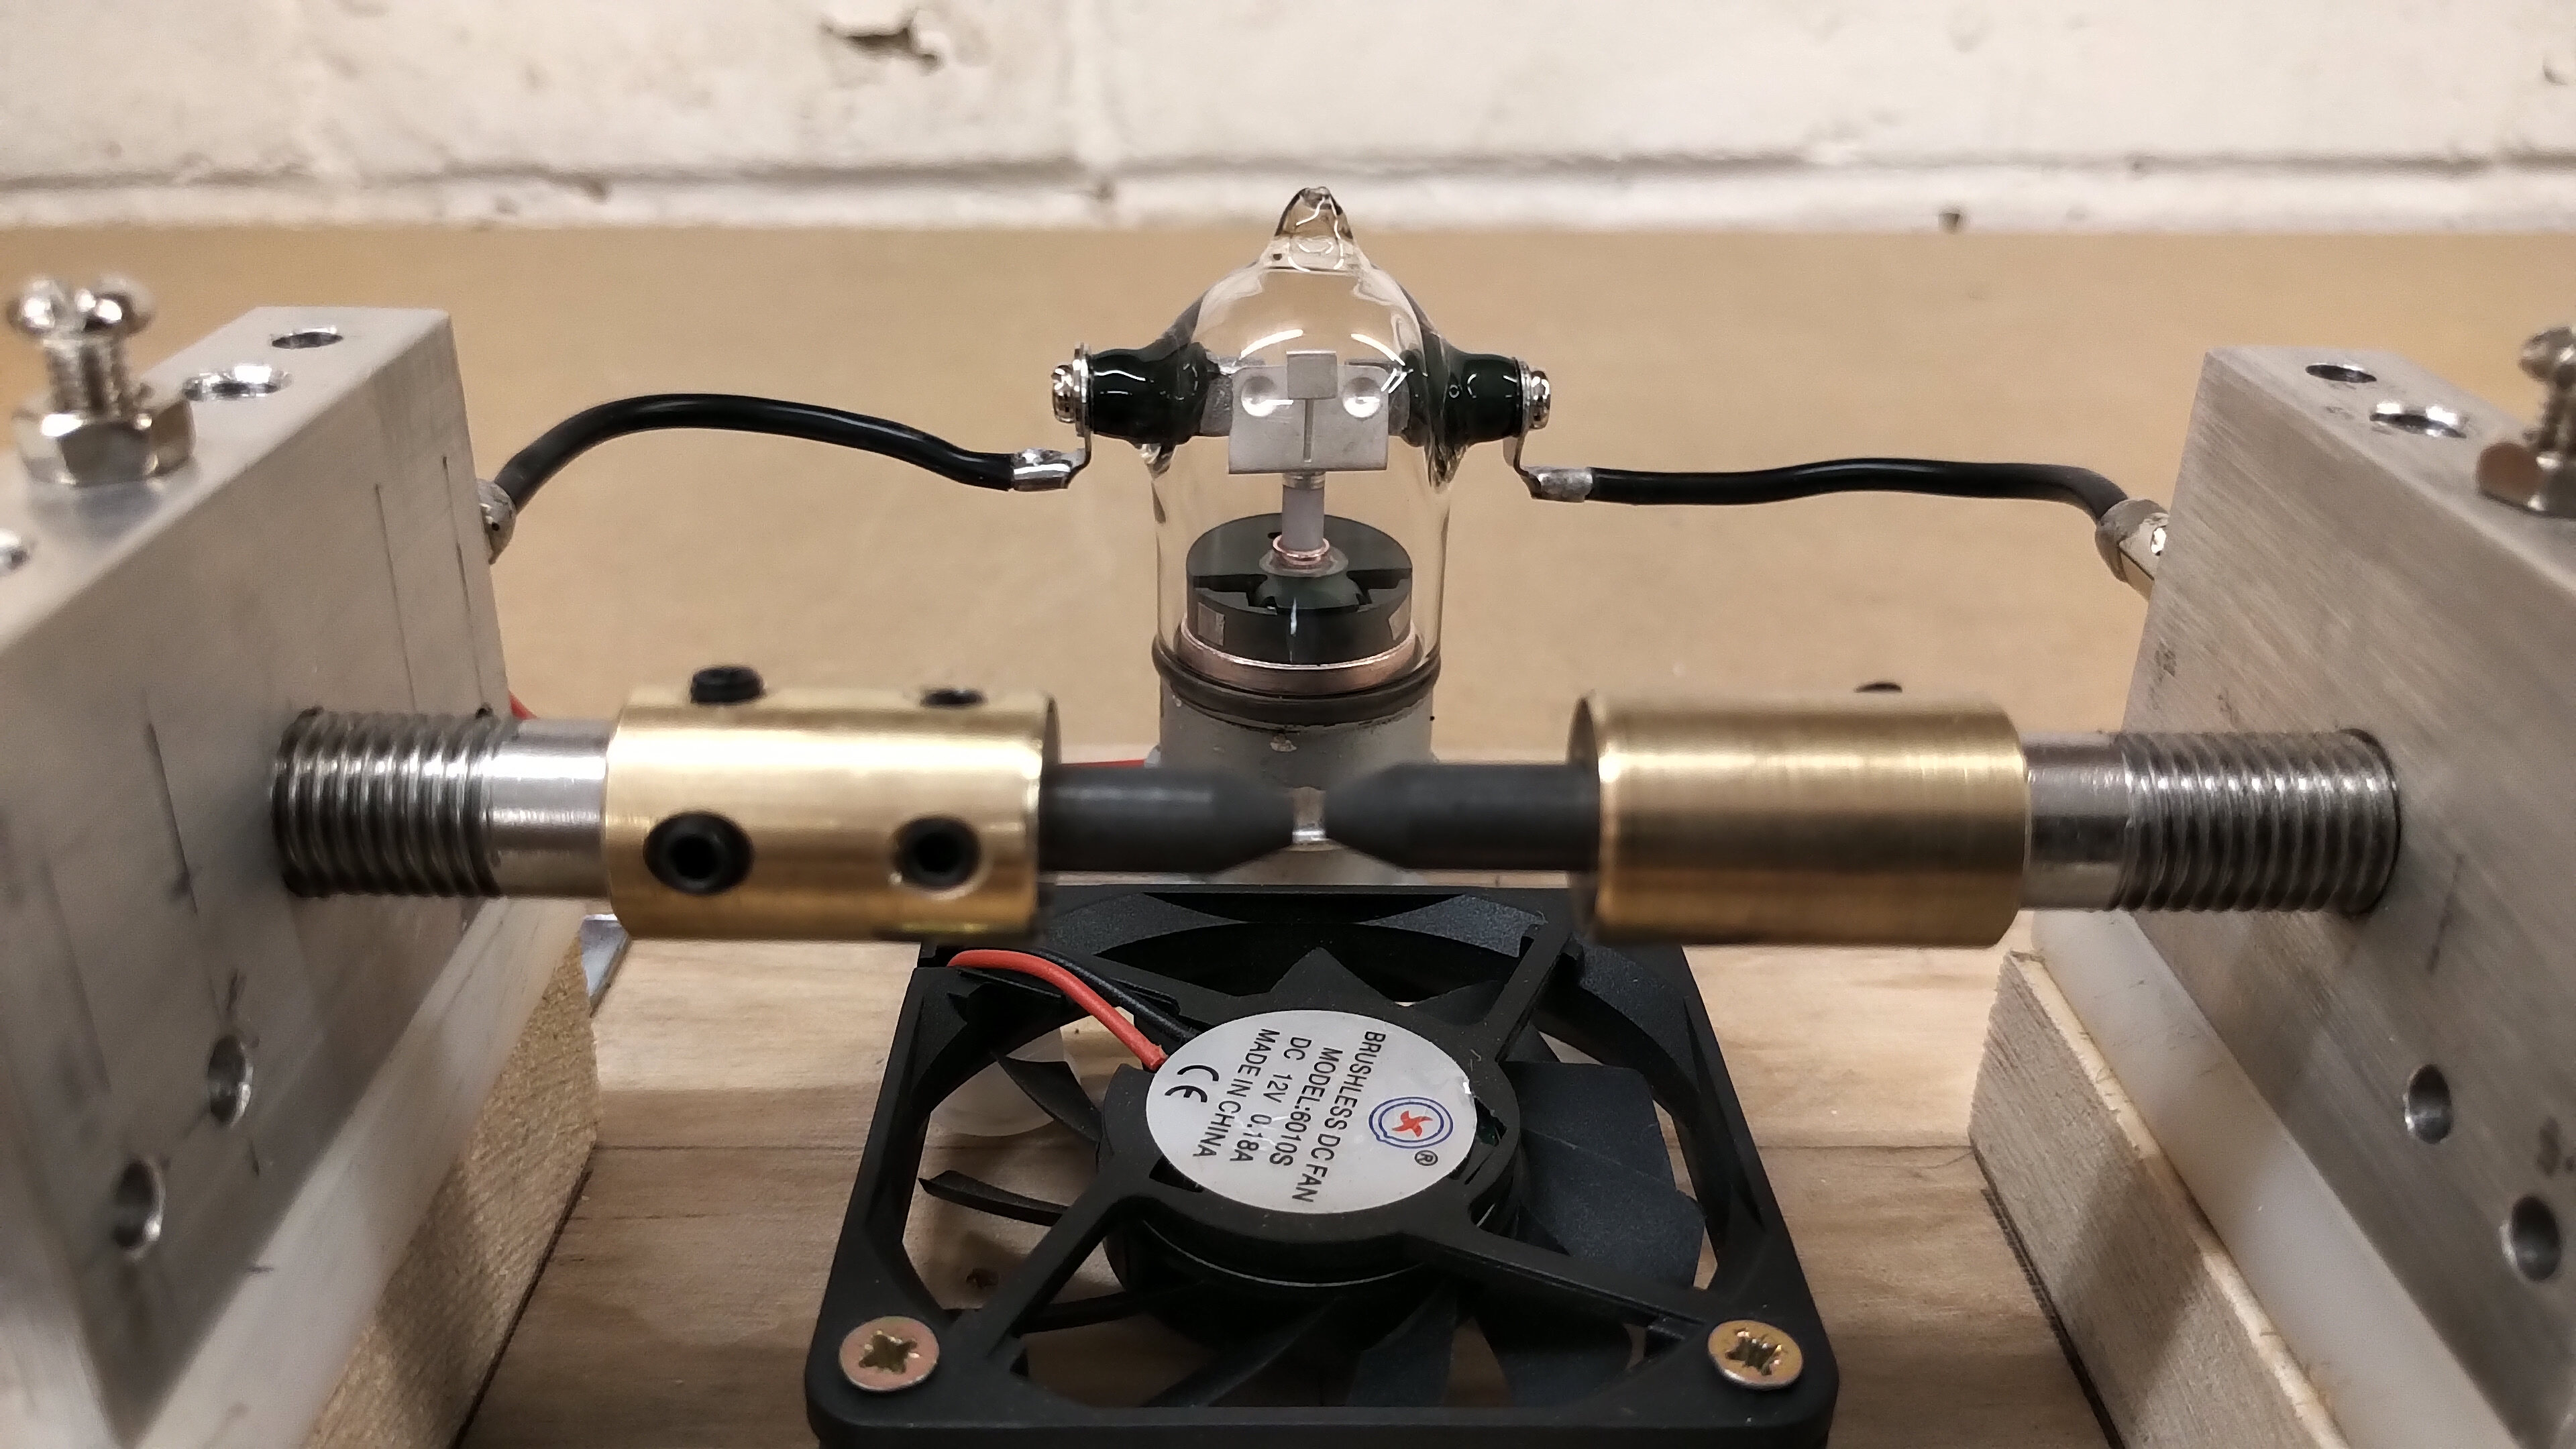
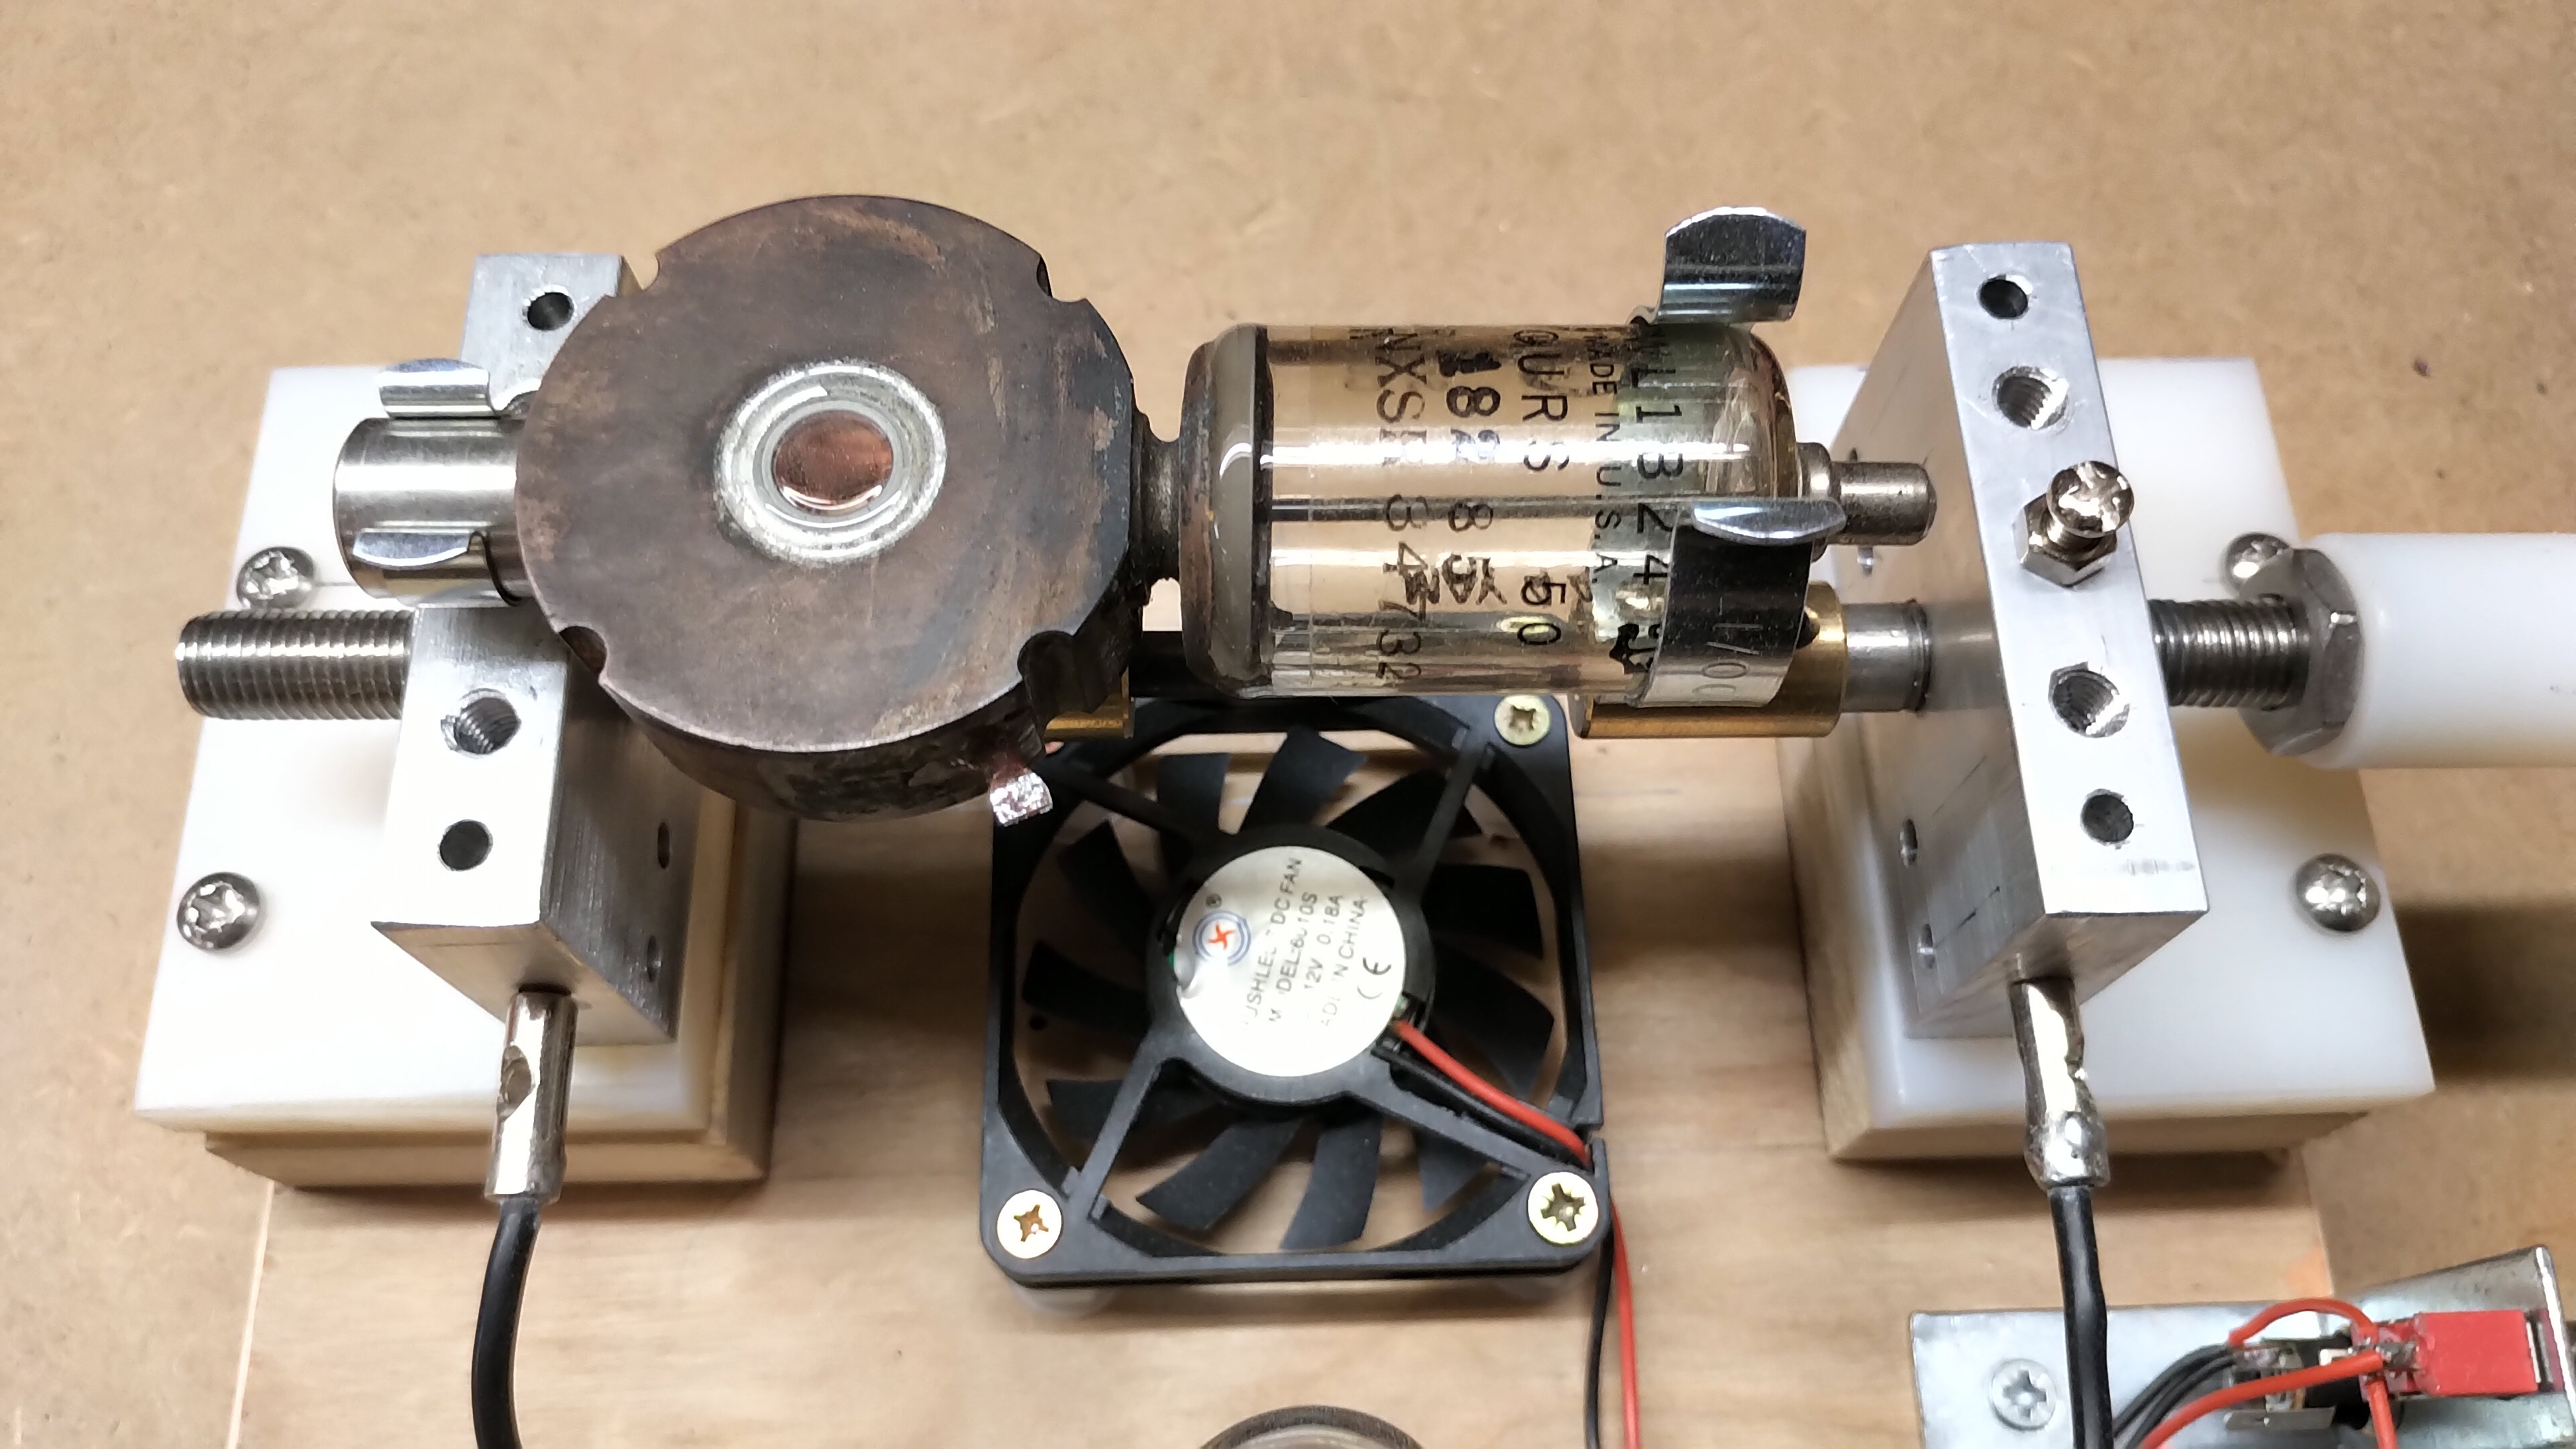
2. The gaseous medium within the discharge region between the electrodes. In this first part on this topic, and for simplicity in the video, experiments were demonstrated with air in the discharge region, but considerably better results have been obtained when the electrodes are in a vacuum region or inert gas inside a glass tube. Two mechanisms have been tested to demonstrate this, the first a vacuum relay where the gap between the electrodes could be adjusted by applying a dc current to the relay’s exciter coil, and secondly a 1B24 TR cell, a cold cathode tube RF spark gap, where the internal gap can be adjusted by an external screw. A TR cell is a gas discharge tube which is used typically as an electronic switch, or as in the case of the 1B24, to protect the sensitive receiver of a radar system from damage by the strong transmit pulse. This method in radar is now long obsolete, the 1B24 being used in, and just after, the second world war. The tube used here has a manufacture date of May 1944 printed on the glass.

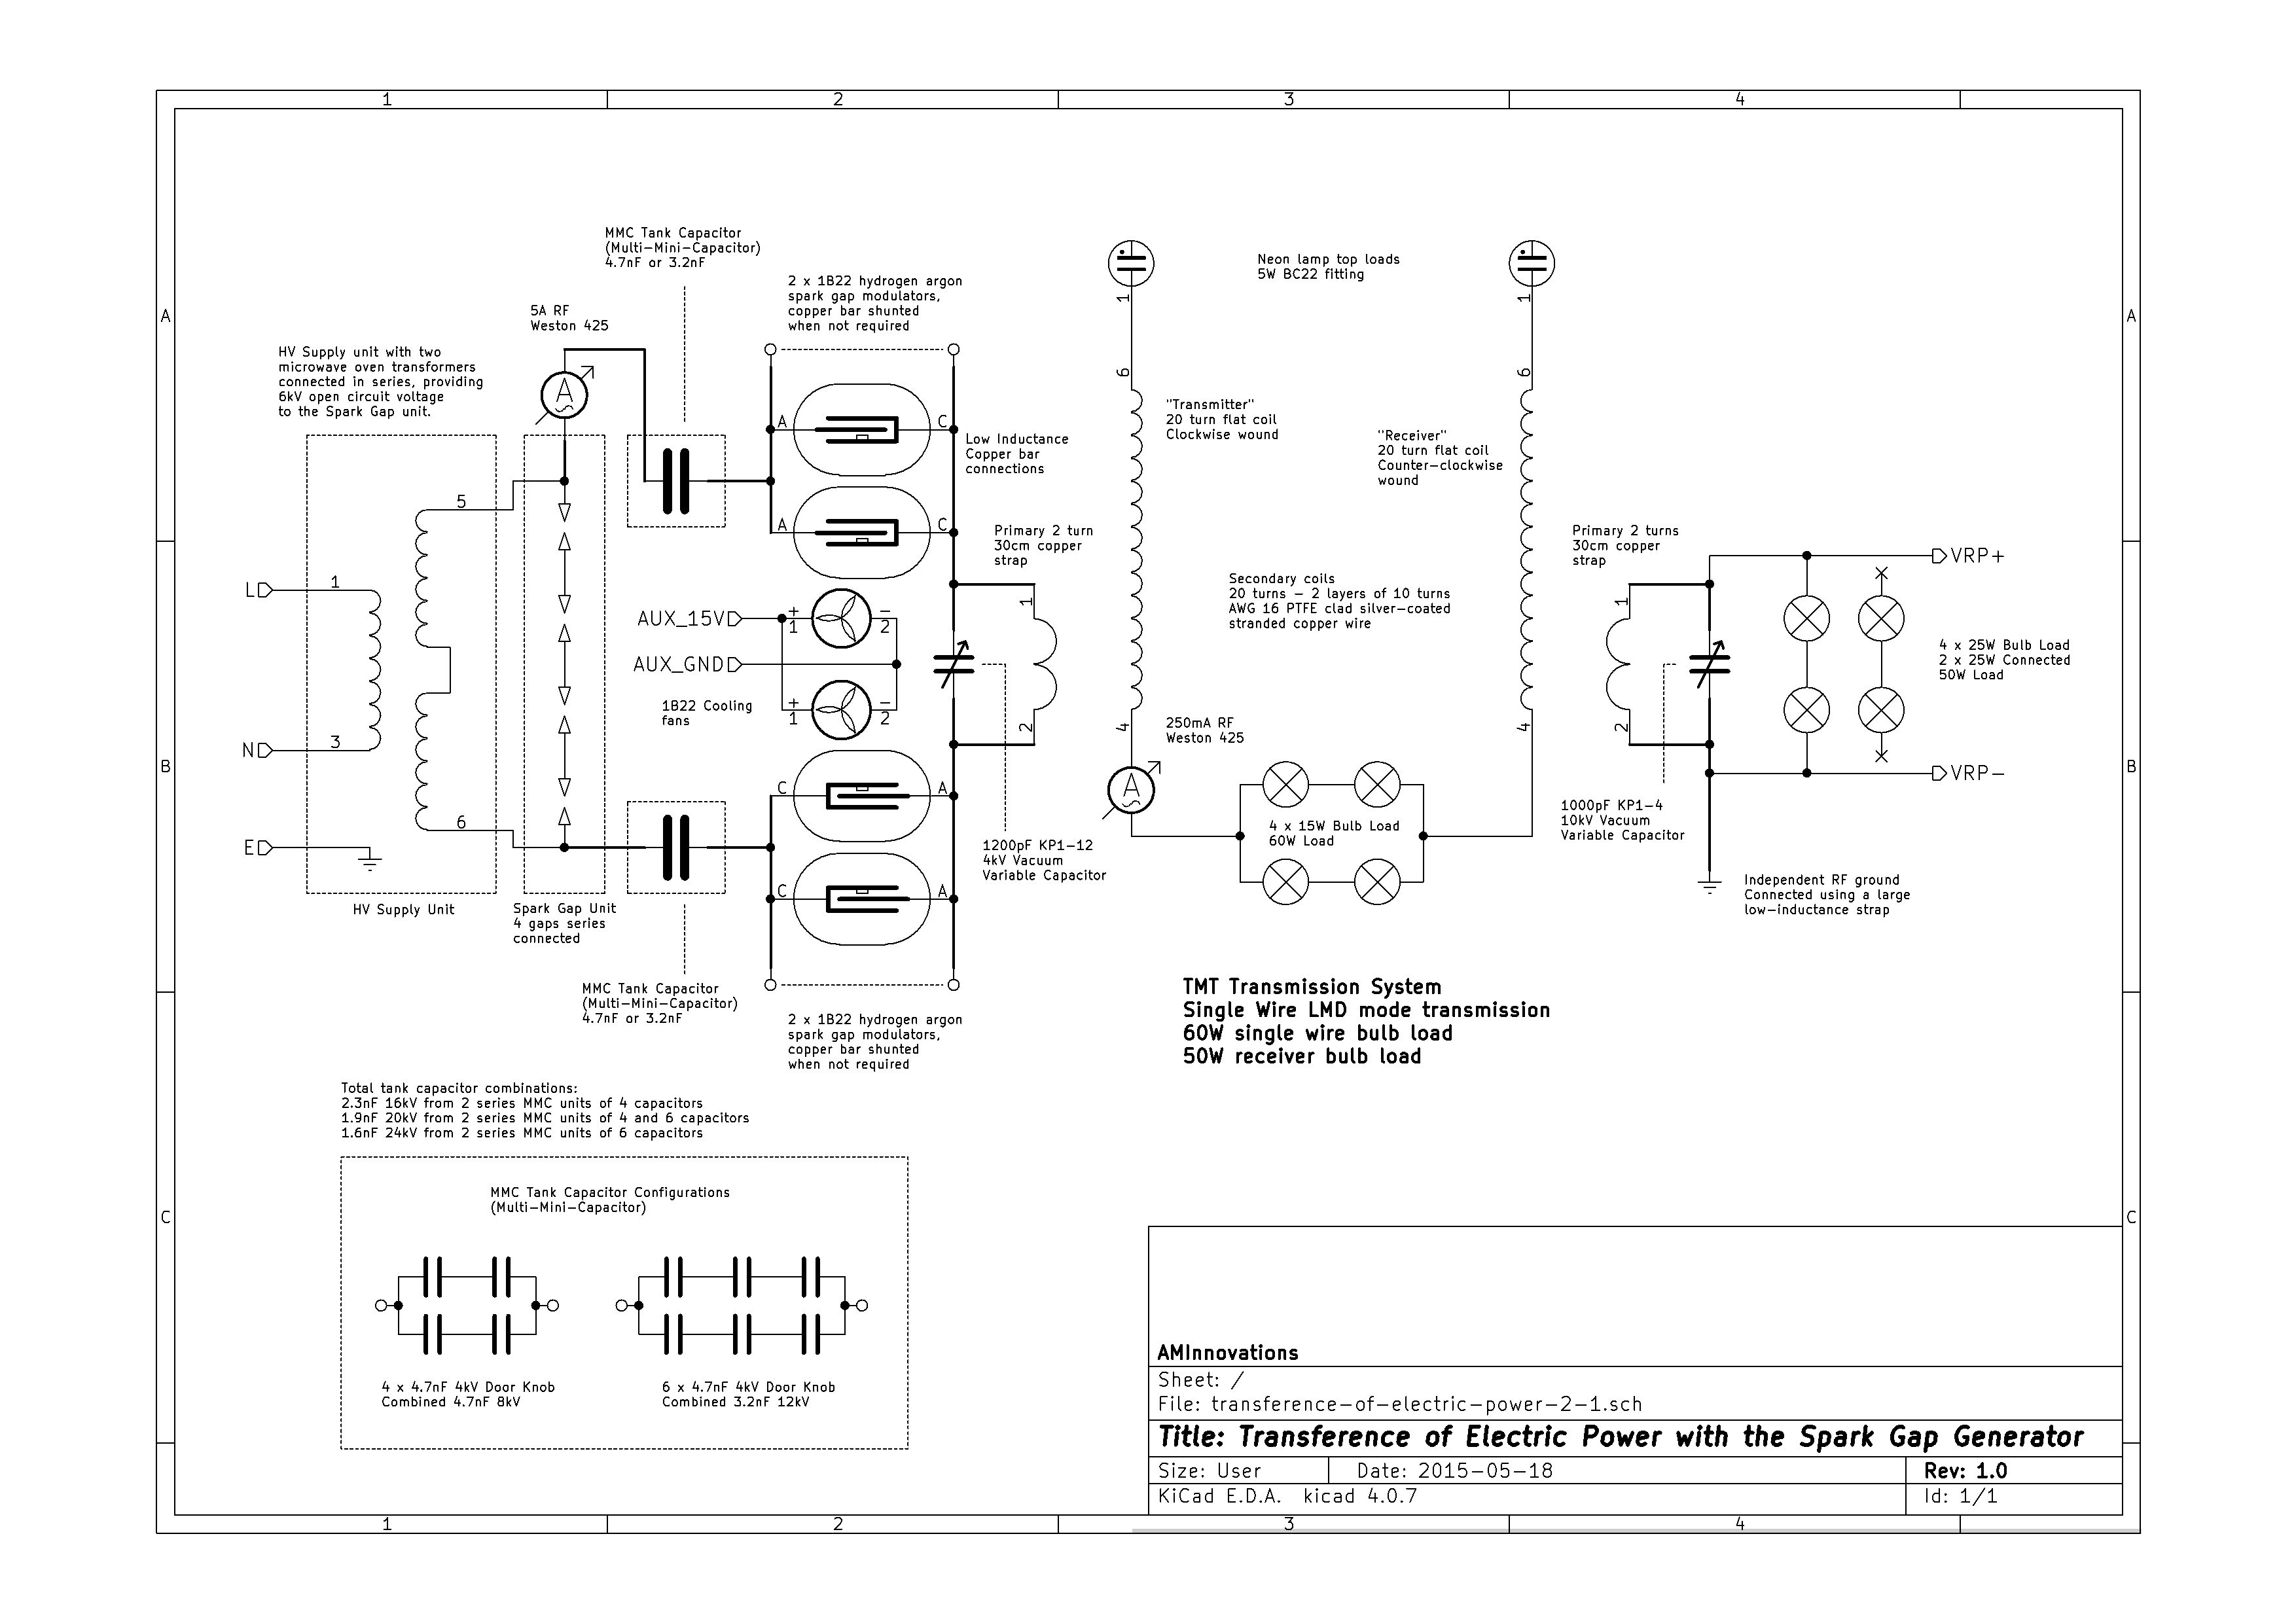
Figures 3 below shows the arrangement of the 1B24 TR cell which was used in experiments to enhance the phenomena presented in this post.

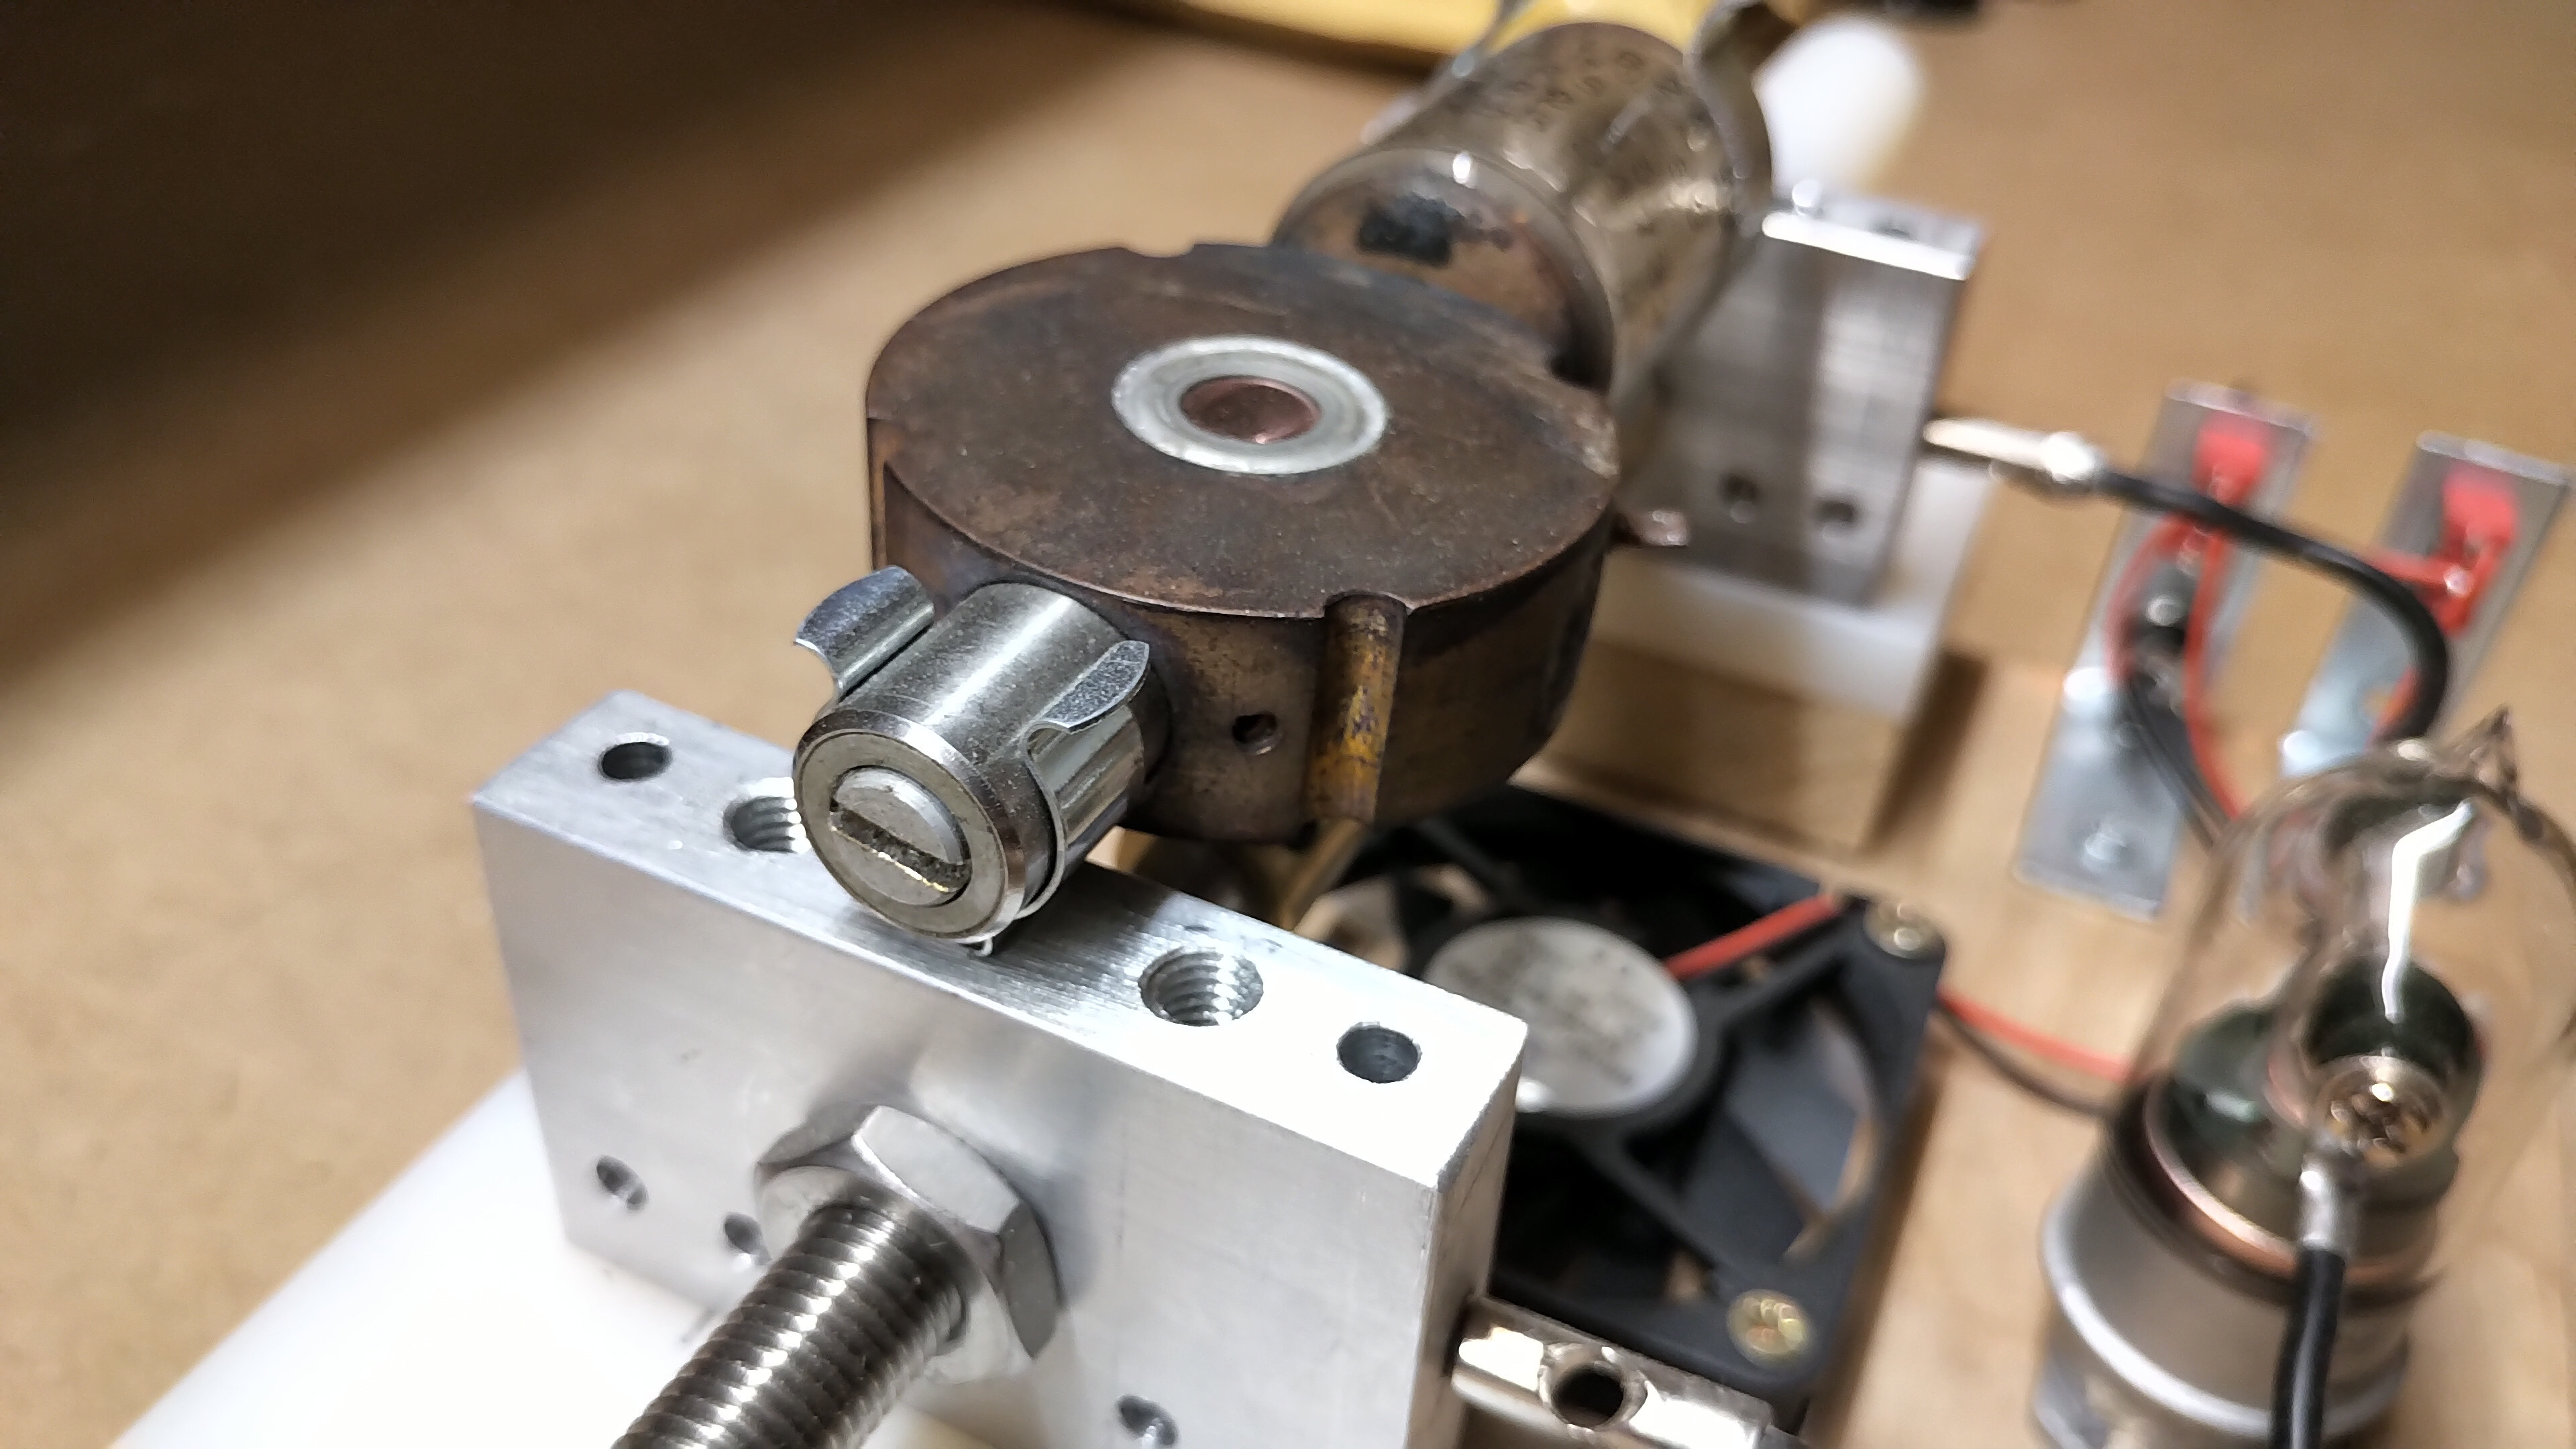
In the case of the vacuum relay it was found that a very small gap could be controlled by adjusting the dc current in the relay exciter coil. At a certain level of bias the contact would start to switch between closed and a very tiny gap, both exploiting the negative resistance in I-V characteristics, whilst introducing another transient switching source in the circuit. In this case the overall resistive impedance in the circuit fell considerably lower than that experienced with the correctly biased CSG. The current in the secondary circuit went up as far as 200mA, the lamps where illuminated with a very high brilliance, and the input power drawn from the generator increased considerably to reflect this rapid decrease in circuit impedance. This bias method and utilisation of NR whilst intensified, was difficult to maintain, and would quickly destabilise to normal circuit impedance. However, this experiment shows that the utilisation of NR properties is strongly dependent on the degree of transient switching and hence non-linearity in the circuit, and combined with a clean discharge region, in this case the vacuum relay contact gap, considerable intensification of the phenomena is possible.

Summary of the results and conclusions so far

The phenomena observed in this experiment and demonstrated in the video, and combined with additional supporting measurements,  appears to result from a reduction in circuit impedance below that of a short-circuit condition, when the CSG is adjusted into the negative resistance region surrounding the abnormal glow section of the I-V characteristic. When adjusted to this region, and combined with a non-linear transient drive from the generator, the overall impedance of the circuit drops, and the current rises as more power is drawn from the generator. In this experimental case the increase in brilliance of the incandescent lamps results from additional power drawn from the generator, over and above that drawn when the CSG is directly short-circuited by the vacuum relay. From this we can ascertain that the negative resistance region of the CSG reduces the overall circuit impedance presented to the generator in non-linear transient cases. In this experiment there is no evidence of additional energy being drawn into the circuit from any source other than the generator, and all changes in energy can be accounted for by measurement of that supplied into the HV supply, and that dissipated in the load.

In comparison, when the HV supply was driven using a linear sinusoidal from a variac, rather than a non-linear switched SCR controller, the phenomenon could not be adjusted, observed, or measured in the same experiment, and the impedance of the circuit under all conditions using the CSG is greater than the short-circuit of the vacuum relay, or carbon electrodes. From this it is clear that to utilise the unusual properties of negative resistance they must be combined with a non-linear impetus, which also suggests a process that may be related to underlying displacement events. It is always in the presence of a non-linear condition that the mechanism of displacement can be engaged or observable within the electrical properties. It appears to surface in non-linear scenarios where the boundaries of the dielectric and magnetic fields of induction would lead to a discontinuous condition in the electrical properties of the circuit. It is conjectured that displacement appears to “act” in order to rebalance this discontinuous condition and restore dynamic equilibrium between the induction fields within the circuit.

With regard to the phenomenon observed in this experiment, it is conjectured that the apparent reduction in circuit impedance below that of a short-circuit primarily results from a coherent inter-action between the dielectric and magnetic fields of induction. The analogy is drawn to both the superconducting state in metals at low temperature[7,8], and also to ballistic electron transport in a high mobility electron gas[9], also at low temperature. In the case of the superconducting state two electrons became weakly bound together through exchange of a lattice phonon. In so doing they form Cooper pairs where the coherent phonon exchange extends across the entire material on a macroscopic scale. This coherent phonon exchange, and subsequent binding together of Cooper pairs, leads to a band-gap opening in the conduction band of the material, and hence electron-pairs can traverse the dimension of the material without scattering in this band. In this way conduction of a current via electron movement through the superconducting material has zero resistance, and is considered to be coherent.

In the second case of ballistic electron transport, the electronic energy band structure of the semiconductor is so arranged to provide a quantum well, narrower than the phonon wave number, at the fermi level within the well. This confines electrons to a 2D sheet in the well, reducing scattering and increasing the mean free path. Further confinement laterally leads to a 1D wire where the scattering with the lattice is further reduced and the mean free path of an electron becomes longer than the injection contacts at either end of material. In this case, and at low temperature, electrons can travel ballistically from one terminal to the other (e.g. in a quantum wire channel). The ballistic conduction reduces the resistance between the contacts below that normally expected for the diffusive condition, since the scattering with the lattice has been reduced to a point where the electron path between the contacts can be considered as coherent.

In both of these analogies reduction in impedance of the transmission medium is considered the result of a coherent conduction process. In the experiment reported here I conjecture that the reduction in impedance results from the coherent inter-action of the dielectric and magnetic fields of induction, where that coherent configuration is brought about by a displacement event. The displacement event is in itself revealed through the non-linear drive to the experiment, and “mixed” through the negative resistance properties of the CSG. The final product of the displacement event through the negative resistance characteristics, is to re-balance the electrical dynamics of the circuit by coherently aligning the dielectric and magnetic fields of induction yielding a reduced circuit impedance. This conjecture, based on the results so far, requires considerable further work to establish its scope of validity, and would also ideally benefit from a suitable mathematical treatment, when such a form of mathematics is available to describe the properties and processes under exploration.

For further exploration and discussion on the results and phenomenon from this experiment please see the Energetic Forum[10].

In the experiments of Chernetsky[1], and others[3,4], the SGD occurred when the carbon electrodes were adjusted, presumably, into the negative resistance region of their I-V characteristics. The generator for this experiment was a switched fly-back transformer, (transient driven), between 25-100kc, and the secondary circuit incorporated a tank capacitor charged from a half-wave rectified output from the secondary coil of the fly-back. The load was formed with incandescent lamps in series with a carbon electrode gap, and connected in parallel with the secondary tank capacitor. When the carbon arc gap was properly adjusted in the experimental circuit, the current supplied to the fly-back primary was seen to fall, whilst the lamp load was illuminated with greater brilliance, and no discharge arcs where visible between the carbon electrodes. The additional energy in the circuit to maintain the brilliance of the lamps was attributed to energy drawn into the circuit from the Aether and the circuit is claimed to be OU in performance.

The experimental circuit explored in this preliminary investigation of negative resistance is different to that of Chernetsky and others for the following main reasons:

1.  It operates at the line frequency of 50Hz, much lower than the 25-100kc of the fly-back transformer.

2. It does not include a tank capacitor in the secondary, which made lead to additional resonant circuit and/or magnification phenomena in the secondary, and possibly cavity effects and hence longitudinal modes formed between the secondary of the fly-back and the external circuit.

3. A bridge rectifier is utilised instead of half-wave rectification of the secondary output.

Differences 1 and 2 may certainly be significant to the overall result and performance of the circuit. On this basis it is not possible yet to support or refute the OU claims for this circuit. Certainly the non-linear negative resistance phenomena explored in this experiment does not result in an OU condition. In the next part of this experimental sequence the same CSG is used in a circuit equivalent to that presented by Chernetsky and others, and its overall performance measured in detail.


Update

A recent replication of this experiment by Bierbaumer[11] demonstrates that in a very similar experimental arrangement, the increased light intensity observed in the lamps, and the measured additional power drawn from the supply, is most likely to occur due to a slight preferential phase shift between the voltage and current waveforms in the SCR envelope. In this experiment the phase shift appears to be brought about by impulse noise generated by discharges in the carbon spark gap, which effects the triggering conditions of the SCR in the most basic trigger circuit. It is subsequently demonstrated that improvement of the SCR triggering circuit, to make it less susceptible to impulse noise generated by the spark gap, suppresses the observed phenomena of increased lamp intensity and additional consumed power.

Bierbaumer also uses an alternative approach to the replication of the negative resistance I-V characteristics, using a digital and analogue oscilloscope in X-Y mode, and series connected carbon-silicon spark gaps. In this experiment he demonstrates anomalously high “shoot-through” or impulse currents, which are considerably larger than expected from the measured circuit impedance, and appear to occur right at the point where the spark gap transitions between the abnormal glow region at region E (ref. Fig. 2 at the top of the post), through the transition from glow to arc at region F, and finally into the arc at G. The result of this demonstration appears to show that despite the considerable current limiting in the discharge circuit from a low inductance, high resistance load, high intensity impulse currents and the associated magnetic induction field can be generated around the negative resistance region of the carbon-silicon spark gaps.

In my own experiments I have measured similar large anomalous impulse currents in the I-V characteristics when the previously mentioned B1B vacuum relay,  or the 1B24 cold cathode RF spark gap, were connected in parallel with the existing carbon-arc gap, and adjusted to the critical region on the I-V characteristrics at E-F-G. The result was much larger than expected impulse currents that could not be accounted for through SCR waveform phase relationship changes, or the measured impedance of the experimental circuit. The generation of excess impulse currents is an area that requires further investigation and careful quantitative measurement to establish if it is directly the result of negative resistance characteristics, or part of other non-linear phenomena that can arise from displacement of electric power.


1. Chernetsky, A., About physical nature of biological energy phenomenons and its modeling, All-Union Correspondence Polytechnical Institute, Moscow, 1989.

2. Whittaker, E., A History of the theories of aether and electricity, Longman, Green and Co., 1910.

3. Frolov, A. Self-generating electrical discharge, Pegasus Research Consortium, 1996.

4. Dawson, D. Notes on the Impulse discharge, Post #2765, Energetic Forum, 2020.

5. Little, P., Electron-emission – Gas discharges, Handbuch der Physik XXI,  Springer-Verlag, 1956.

6. Abdelrahman, M. & El-Khabeary, H., Study of Three Different Types of Plasma Ion Sources, Plasma Science and Technology, Vol.11, No. 5, Oct. 2009.

7. Bardeen J. & Cooper, L. & Schrieffer, J., Theory of Superconductivity, Physical Review, Vol. 108, pg. 1175, 1957.

8. Marsh, A. & Williams, D. & Ahmed, H., Supercurrent transport through a high-mobility two-dimensional electron gas, Vol. 50, No. 11, Physical Review B (Rapid Communications), September 1994.

9. Marsh, A., Superconducting contacts and Supercurrent Flow in a GaAs/AlGaAs Heterojunction, Ph.D. Thesis, Cambridge University, July 1995.

10. Forum Members, Eric Dollard Official Forum -> Eric Dollard, Post #2807 onwards, Energetic Forum, 2020.

11. Bierbaumer, W., Negative Resistance and the Self Generating Discharge – Experimental Replication, YouTube, 2021.


Vector Network Analyser – DG8SAQ

This post on the Vector Network Analyser, the DG8SAQ by SDR-Kits[1-3], is the first in a sequence looking at how to use advanced test equipment to measure the properties, characteristics, and electrical parameters associated with Tesla coils and TMT transmission systems. The small signal ac input impedance characteristics Z11, and also the transmission gain characteristics S21, are used a lot in the experiments and measurements presented in this website, and yield a lot of fascinating and intricate dynamic data that can assist in the design, operation, matching and tuning of experimental apparatus suitable for experiments in the displacement and transference of electric power.

Vector network analysis is a vast and well-documented subject which covers the vector response of an electrical network to a frequency stimulus, and analyses the real and imaginary components of both the reflected and transmitted components of that stimulus. The results of this frequency analysis are detailed measurement data of the magnitude and phase of reflected and transmitted scattering parameters such as S11 and S21, which combined with a known and carefully measured calibration, yield impedance measurement parameters like Z11 which can be displayed and stored in a variety of different formats.

The purpose of this post is not to cover in detail the theory and prior-art of vector network analysis, which is more than adequately treated in the field, but rather to demonstrate how to use a vector network analyser to gain practical measurements from Tesla and TMT based systems. Some good references[4-7] for further study of this subject area are presented at the end of this post. The usb VNA demonstrated in this post is both sufficiently accurate, and yet affordable, for the expert amateur inventor, researcher, experimenter, or engineer. The results obtained using this instrument, and presented on many of my posts on this website, have been found to correspond with good accuracy and feature detail, when compared to measurements taken using a professional grade VNA, a Hewlett-Packard (HP) 4195A[8].

The 4195A although from the late-80s, and very much an HP flag-ship at the time with a list price, including accessories, in that era of over $50k, and is still actively used in some research labs due to its high accuracy, high dynamic range, and measurement mode flexibility (network, spectrum, and impedance) from 10Hz – 500MHz. Fully working and calibrated examples can still fetch as much as $5k on Ebay and from used test equipment suppliers. The HP 4195A will be presented and compared in another post in this equipment sequence.

The following videos looks in detail at the setup, calibration, software, and measurement of a cylindrical Tesla coil using the usb connected DG8SAQ VNWA, and is intended as a practical introduction to start using a VNA to gain useful measurement data. The first video focuses on the practical setup, calibration, and measurement, and considers and demonstrates the following:

1. An introduction to Tesla coil measurements using a usb connected vector network analyser (VNA).

2. Connecting the VNA directly to the secondary of a Tesla coil for series-fed measurements.

3. Connecting the VNA to the primary of a Tesla coil to measure Z11, the small signal input impedance from the perspective of the generator (the VNA).

4. Connection considerations and methods when using coaxial, and twisted-pair cables.

5. Consideration of calibration reference plane, and techniques to extend the reference plane directly to the primary coil inputs.

6. Calibration of the VNA for Z11 measurements using a short, open, and 50Ω termination.

7. Calibration and measurement procedure for a primary driven cylindrical Tesla coil.

8. Calibration and measurement procedure for a series-fed cylindrical secondary coil.

Figure 2 below shows the schematic for the series-fed and primary driven VNA measurement setup. The high-resolution version can be viewed by clicking here.

The second video focuses on using the DG8SAQ software to calibrate, measure, display, and store the data , and demonstrates the following:

1. Calibration preparation in setting frequency scan bandwidth, number of data points in the scan, and hence the scan rate.

2. Calibration of the VNA for Z11 measurements using a short, open, and 50Ω termination.

3. Display forms including cartesian, polar, and smith chart, trace scaling, and display parameter selection for the measured data.

4. Calibration, measurement procedure, and display of results for a primary driven cylindrical Tesla coil.

5. Calibration, measurement procedure, and display of results for a series-fed cylindrical secondary coil.

6. Data exporting to file, and loading from file to display.

In summary, the SDR-Kits DG8SAQ VNWA has proven to be a reasonable cost, good accuracy, and flexible addition to the lab test equipment, and is capable of a wide range of different measurements, which contributes useful data in the design, implementation, and operation of Tesla coils and TMT transmission systems.


1. Baier, T., A Small, Simple, USB-Powered Vector Network Analyzer Covering 1 kHz to 1.3 GHzQEX Jan/Feb 2009

2. SDR-Kits, Introducing the DG8SAQ VNWA 3 Low Cost 1.3 GHz Vector Network Analyzer, SDR-Kits DG8SAQ

3. SDR-Kits, Software & DocumentationSDR-Kits DG8SAQ Documentation

4. Keysight Technologies, Understanding the Fundamental Principles of Vector Network AnalysisApplication Note 5965-7707

5. National Instruments, Introduction to Network Analyzer Measurements, Fundamentals and BackgroundNI RF Academy

6. Baier, T., Experiments with the DG8SAQ VNWA and the SDR-Kits Test BoardSDR-Kits DG8SAQ Tutorial

7. Baier, T., Your RF Cable, The Unknown EntityHam Radio 2018

8. Keysight Technologies, Network Analyzers, Combined Network/Spectrum Analysis, 10 Hz to 500MHz, HP 4195A


Transference of Electric Power – Part 2

In this second part on the transference of electric power we take a look at the differences that arise when a spark gap generator (SGG) is used as the power source for the experiment rather than a single frequency oscillator as used in part 1. It is recommended to study  part 1 before this second part, in order to gain an underlying understanding of the overall experiment, phenomena, results, and suggested interpretation of the experimental results, that are characteristic to the practical investigations in the transference of electric power.

Unlike a single frequency oscillator or linear amplifier generator, a spark gap generator produces a very broad range of frequencies which result from the abrupt and impulse-like discharge that occurs at the spark gap. Frequencies generated by such a spark gap discharge, range from the very low in the 10s of Hz, all the way up to 100s of MHz, and beyond into GHz frequencies. With such a wide frequency band the stored energy available in the tank capacitors, which are charged at each half-cycle of the HV supply, is distributed across this wide band leading to two significant factors. Firstly that considerably less energy is available from the source at the resonant frequency of the transmitter coil, and secondly, tuning of the TMT transmission system has considerably less effect on the transference of electric power between the generator source and the receiver load.

The experimental work in this part is intended to investigate and demonstrate aspects of the following:

1. Tuning measurements using a vector network analyser to measure Z11, the small signal ac input impedance for the experimental system, from the perspective of the spark gap generator.

2. Tuning indifference when powering a load either in the single wire transmission line or at the output of the receiver.

3. Reduced power available in the single wire transmission line.

4. Reduced power available in the receiver load.

5. Tesla radiant energy and matter phenomena.

6. Transference of electric power between the transmitter and receiver in the near field.

Figures 1 below show an overview of the experimental arrangement which consists of two flat coils used as transmitter and receiver and joined via the base of the secondary coils by a single wire transmission line with an inline 60W four incandescent lamp load, (4 x 15W 240V pygmy lamps). The transmitter primary is connected to the Spark Gap Generator via a matching unit which consists of two compound series tank capacitors, shunted 4 x 1B22 hydrogen-argon spark gap modulator tubes, and a 1200pF vacuum variable capacitor in parallel with the 2 turn copper strap primary.

The receiver primary is tuned by another parallel connected 1000pF vacuum variable capacitor which in turn is connected to a 50W two incandescent lamp load. The outer end terminal of the receiver primary is connected directly to RF ground via a low inductance ground strap. As in part 1 the secondary coils of the transmitter and receiver are positioned facing each other on axis 1.5m apart, and are counter-wound to each other in order to produce a balanced and reciprocal cavity arrangement.

Figure 2 below show the schematic for the transference of electric power experiment powered by the SGG. The high-resolution version can be viewed by clicking here.

The principle of operation and matching requirements are somewhat different between the vacuum tube generator (VTG) and the SGG. In the VTG maximum power transfer between the generator and primary is accomplished when the impedance of the primary resonant circuit is equal to the  combined vacuum tube internal impedance, when oscillating at the designed and configured operating point, (class C amplifier), for the tuned primary frequency, and run in CW (continuous wave) mode. In this case the primary circuit is not arranged to resonate at the same frequency as the secondary, where oscillating primary currents would be far too large and lead to destruction of the vacuum tubes. Rather the correct impedance match between the primary and tube oscillator facilitates maximum transfer of power from the non-resonant tube tank circuit to the tuned primary circuit, whilst keeping vacuum tube power dissipation under the maximum combined rating for the tubes.

In the SGG case it is in principle optimal to arrange the resonant frequencies of the primary tank circuit, and the secondary coil to be the same. In this case bursts of very large and maximal oscillating currents are generated in the primary tank circuit, which in turn result in strong magnetic coupling to the secondary circuit, and hence maximum power transfer between the resonant primary tank, and the secondary resonant coil. In practice matched primary tank and secondary coil resonant frequencies cause considerable operating issues when running, as the very high oscillating currents, in the high-Q low impedance primary, result in a very aggressive, unstable, and erratic spark discharge. The de-tuning of the circuit, by deliberate mis-match of the primary tank circuit resonant frequency and the secondary resonant frequency, reduces the Q considerably of the primary, reduces slightly the coupling between the primary and the secondary, whilst considerably stabilising the spark gap discharge to be suitable for experiments in the transference of electric power through a high-Q TMT transmission system.

In the case where a Tesla coil is being used for maximum streamer discharge, it is accepted as best practice to match the primary tank resonant frequency as close as possible to the secondary coil resonant frequency. Here maximum energy is coupled into the secondary and dissipated through the top-load accumulator. In this case the primary frequency is usually de-tuned slightly below the secondary frequency to maximise power transfer during streamer discharge, which leads to very white-hot powerful discharges. For example for a coil arranged to resonate with suitable top-load at 1.7Mc/s the primary resonant tank circuit would be tuned to resonate between ~ 1.5-1.6Mc/s, (~10% lower to compensate for secondary frequency drop on discharge). This case requires a very powerful and robust spark gap that will operate very aggressively, unstably, and producing large amounts of heat, light and noise.

In the case for a TMT transmission system using two or more Tesla coils matched and tuned together in a high-Q narrow bandwidth arrangement, and connected with a single wire and operated in a balanced LMD transmission mode, the primary resonant tank frequency is optimally arranged to be lower in frequency than the secondary resonant coil frequency. In this case there is only a small measured difference in total power being transferred from the generator to the final receiver load as a result of the deliberate primary resonant tank and secondary coil resonant frequency mis-match. For example for a coil arranged to free resonate into a single wire transmission line at 1.7Mc/s the primary resonant tank circuit would be tuned to resonate between ~ 1.0-1.3Mc/s.

The 1B22 hydrogen-argon spark gap tubes were shunted out of the circuit for experiments in the transference of electric power to the receiver load, as their higher internal resistance reduces the primary currents, causing a reduction in the total transmitted power. The shunts are made from copper sheet which remove the tubes from the circuit without increasing the inductance of the primary tank circuit.  In experiments relating to Tesla’s radiant energy and matter it is possible to obtain improved results, (amplified phenomena), when the 1B22 tubes are included in the circuit. It is conjectured that the slight dioding action[1,2] as a result of the ionizing radioactive (Radium Ra-226) trigger element, and the improved pulse response of the primary tank circuit, improves the uni-directional energy supply from the tank circuit to the TMT system. This improved uni-directional energy supply increases the intensity of the LMD mode wavefront in the single wire cavity, amplifying radiant energy and matter phenomena.

A correctly triggered and functioning 1B22 will emit a dark purple spark discharge within the aluminium can of the cathode terminal, which is quickly quenched by the rarefied hydrogen-argon gas mix. A defective 1B22 with a leak to air will still work as a spark gap but will generate a brighter green-yellow discharge as aluminium is combusted from the cathode surface. The discharge sustains for longer causing considerable burning of the electrodes, and rapid over-heating causes distortion of the glass tube, with finally destruction of the electrodes.

The following video introduces the experimental setup, instrumentation, and readings, and looks in detail at Z11 the small signal impedance characteristics of the experiment from the perspective of the spark gap generator. It concludes with a range of experiments in the transference of electric power using a spark gap generator, combined with a preliminary introduction to Tesla’s radiant energy and matter experiments.

Figures 3 below show the detailed Z11 impedance measurements that were presented in the video, and will be referred to in the consideration of the experimental results.

Figures 4 below show the oscillating voltages and currents in the primary transmitter tank circuit, and also those measured at the single wire load. In both the green and red traces the current amplifier is calibrated at 50A/div, showing the large oscillating currents that occur in the primary, and those transferred to the burst in the secondary.

The principle of operation of the transmitter coil primary tank circuit is explained in detail in the post Spark Gap Generator – Part 2. In fig. 4.2 the current (red) in the single wire medium has become far more impulse-like in nature, rather than the oscillating sinusoidal established in the primary coil ring-down as the tank capacitors discharge in the series resonant tank circuit. It is conjectured that these impulse-like currents may be indicative of the burst wavefront constituting the LMD mode, within the cavity formed between the transmitter and receiver coil top-loads. It may also indicate more clearly why it is possible to observe radiant energy and matter phenomena more easily in a SGG driven TMT system, compared to a VTG or linear amplifier driven TMT system. That is, the nature of the burst currents generated in the primary resonant tank circuit by the SGG generator lend themselves more readily, when induced into the secondary cavity, to the LMD mode in the form of impulse-like, uni-directional bursts. These more uni-directional bursts in turn lead to an intensified wavefront in the cavity and the clearer observation of Tesla’s radiant energy and matter phenomena. This experimental area will be explored in much more detail in subsequent posts, but for now serves as an empirical introduction to these fascinating phenomena.

Fig. 4.1. shows the oscillating voltage and currents generated by the SGG in the primary resonant tank circuit. The oscillating currents (green) are a product of the stored energy in the tank capacitors repeatedly transferred backwards and forwards between the tank capacitors and the inductance of the primary coil. As the stored energy is consumed by transfer to the secondary circuit, and by dissipation as heat, light, and noise in the spark gap, and the series resistances of the primary tank circuit, the envelope of the primary current decays until all stored energy in the current cycle is expended. The oscillating nature of the current when transferred from the primary to the secondary tends to cause “dragging” or “smearing” of the LMD wavefront in the secondary cavity reducing the potency and impact of the pressurised wavefront.

In the most ideal case the wavefront would constitute a single pulse of very large amplitude and with very short pulse width, resembling as closely as possible a true impulse function. This pulse wavefront would traverse the cavity in a uni-directional manner with no reflections or dispersion leading to a singular and positive acting pressure wave with both the di-electric and magnetic fields of induction coherently in phase. In this ideal case the transfer of electric power could be 100% between transmitter and receiver, or if radiant energy phenomena are so arranged by a suitable load or emitter in the single wire transmission medium of the cavity, 100% wireless transfer of electric power could be arranged between many points. The intense radiant energy burst from the strong wavefront may also generate a wide range of unusual and hitherto unexplored electrical and matter phenomena, which may in turn also assist in the experimental exploration of the displacement of electric power, the hidden underlying coherent guiding principle of the undifferentiated electric and magnetic fields of induction.

This most ideal case requires that in the primary tank circuit all the energy stored in the tank capacitor per cycle is transferred to the secondary within the first half-cycle of the ring-down. This would create a single pulse from each cycle where all energy available in the tank circuit is transferred to the secondary, in effect driving the primary with a pulse generator. In order to do this it would be necessary to quench the spark gap after the first half-cycle of the discharge, and also ensure that the impedance of the primary circuit was sufficiently low that all the stored energy in the tank could be discharged in this first half-cycle. Both of these requirements present very challenging practical implementations, and will be explored in more detail in subsequent posts.

Tank circuit capacitance optimisation

In the current primary circuit the tank capacitance was adjusted in three different configurations in order to find the optimum operating point for the experiments in the transference of electric power powered by the SGG. The circuit diagram in figure 2 shows the arrangement of the tank capacitor in these three configurations:

1. 2.3nF 16kV from two series MMC units of four capacitors each. This is the tank capacity used in the video experiment and is very stable with only a very small reduction in the amount of power transferred to the receiver load. From figs. 3.3 and 3.4 the resonant frequency of the series primary tank at M1 is 1.09Mc/s. Good stable operation could be established up to ~800W.

2. 1.9nF 20kV from two series MMC units of four and six capacitors respectively. This tank capacity increased slightly the amount of power transferred to the receiver load over configuration 1, but the unbalanced capacity either side of the primary coil, (4 cap. unit one side, 6 cap. unit the other side), was found to lead to more instability in the spark discharge including “popping” and material ejection at the electrodes at powers only up to 500W. The resonant frequency of the tank circuit in this configuration is ~ 1.2Mc/s

3. 1.6nF 24kV from two series MMC units of six capacitors each. This was found to be the lowest practical tank capacity when running at powers up to 1kW. Lower than this the spark gap became too aggressive and erratic for good accurate measurements and stability in the transference of electric power. The resonant frequency of the tank circuit in this configuration is ~ 1.3Mc/s

Overall, configuration 1 was selected for most experiments in the transference of electric power, providing the best balance between longer-term stable and reliable operation of the spark gap, and with acceptable energy transfer to the transmitter secondary coil.

The other feature of the tank circuit was to minimise the inductance of the connections and components. The optimum condition is for all the current in the tank circuit to contribute to generating a magnetic field only within the primary coil itself, which maximizes the magnetic field coupling to the secondary coil. In practise magnetic fields are also created around the inductance of the tank circuit connections and components, storing some of the available tank circuit energy, and reducing the magnetic field generated within the primary coil. The inductance of the tank circuit components is kept minimum by keeping connection wires short and made from large many stranded conductors, by using copper busbars, and solid aluminium or copper mounting blocks for larger components. In the circuit diagram of fig. 2 the low inductance parts of the tank circuit extend from the spark gap to the primary coil and are indicated by thicker connecting wires.

Tuning indifference when powering a load

One of the most notable differences between the experiments in part 1 and 2, is that power dissipated in the both the single wire load and the receiver load varies only slightly with large changes to the transmitter and receiver primary tuning capacitor. The transmitter tuning capacitor was varied over the range 20-1200pF which in figs. 3.1 and 3.2 shows very large changes to the frequency spectrum of the TMT system. However when powered from a properly adjusted spark gap generator the bulbs in the single wire transmission medium remain well-lit over much of the tuning range. This is in stark contrast to part 1 where power dissipated or transferred in the various loads were very dependent on the tuning condition of the transmitter and receiver, and to the matching conditions of the VTG to the primary of the transmitter.

In fig. 4.2 we see that currents in the single wire transmission medium are much more impulse-like and consist of many narrow pulse excitations and rapid bursts. The spectral content of this time-domain signal will be very wide with energy distributed over a very broad-bandwidth, and consistent with the properties of the spark gap stimulus in the primary circuit. With such a wide bandwidth of frequencies present at the single wire load we would expect the bulbs to be illuminated irrespective of the tuning in the transmitter primary. Many frequencies are being transferred from the primary to the secondary circuit which is characteristic and typical of the properties of this experiment when driven from a spark gap based generator.

Given the above as a broad comparison with the experiment in part 1, tuning around the upper and lower resonant frequencies of the flat coil transmitter causes a slight increase in brightness for the single wire load, showing that more energy is selectively coupled at these frequencies from the generator as would also be expected from part 1, and from the frequency characteristics measured in figs. 3.1-3.4.

Reduced power in the single wire load and receiver load

The spread of energy over a very wide bandwidth results in less energy being dissipated in both the single wire load and also in the receiver load, as compared the single frequency oscillator experiment in part 1.

1. In the case of the single wire load, the bulbs can still be lit to almost full brightness since all the power from all transferred frequencies is being dissipated in this load. The bulb brightness showing the average power dissipation over many bursts coming from the spark gap generator. At an input power of 300W to the HV supply it was possible to illuminate the single wire load to around two-thirds of its maximum rating, so ~45W. At 500W the load could be illuminated fully to ~60W.

2. In the case of the receiver load, much less power could be coupled into this load even when tuned correctly as a complete TMT system, as shown in figs. 3.3 and 3.4. The single wire load had to be first removed to prevent power dissipation at this load, and then the receiver load could be illuminated to maximum ~0.5 of its total power e.g. about 25W. From the wide-band of frequencies available in the single wire transmission medium only a very narrow range at the resonant frequency of the receiver flat coil are transferred from the single wire to the receiver load. It should however be noted that the receiver bulb loads where illuminated dimly over the entire tuning range of the transmitter primary and the receiver primary. This again shows that a little of that wide bandwidth of energy is coupled to the receiver irrespective of the tuning, again tuning indifference based on the spectral content of the source energy.

In this case the spark gap generator is far from optimal for the transference of electric power, where for the same input power as in part 1, less energy is transferred to the single wire load, and very much less energy can be transferred to the receiver load. This proves to be the case even when the TMT system is optimally tuned as shown in figs. 3.3 and 3.4, and by further comparison with the optimal tuning results in part 1 of this experiment.

Tesla radiant energy and matter phenomena

These phenomena form some of the most interesting and unusual aspects of this TMT experiment using a spark gap generator. Whilst these effects can also be observed in the same experiment using a single frequency oscillator, linear amplifier, or other oscillating source they are much reduced in intensity when compared with a spark gap generator, burst oscillator, pulse generator, or properly designed and operated impulse or displacement generator. The exploration of these phenomena in this experiment is only as an introduction to these effects, and properly requires a much more detailed experimentation and consideration, which will be presented in a subsequent post along with very much magnified phenomena results.

The preliminary phenomena observed in this experiment include:

1. Attracting metals to the surface of an incandescent bulb in the single wire cavity, where the bulb acts as an emitter of radiant energy.

2. Amplification or intensification of a radiant energy event by interaction with a living organism, (human hand).

3. Charging a capacitor with radiant energy by bringing it close to the emitting bulb.

4. Radiant matter pressure waves emanating from the emitting bulb and impacting on a living organism, (human hand).

It should be noted here that improving the uni-directional pulse nature of the generator system by, for example, including components such as 1B22 spark gap modulator tubes in the tank circuit, early magnetic quenching of the spark discharge, or other impulse/pulse/burst generation methods, considerably magnifies the observed phenomena. It is also important to note that these types of phenomena are best observed when  a cavity has been established using a resonant transformer, such as a Tesla coil, and where a longitudinal pressure wavefront is established within the cavity, preferably in an LMD type mode, or ideally with direct displacement.

Summary of the results and conclusions so far:

The transference of electric power experiment using the tuned TMT flat coil system has produced considerably different results when powered using a spark gap generator, as compared with the single frequency feedback oscillator in part 1. The key differences and results include the following:

1. Tuning indifference occurs due to the wide spectral bandwidth of the energy transferred from the generator to the final receiver load, and impacting on all parts of the TMT transmission system between these points.

2. Considerably reduced levels of transferred electric power both to the single wire transmission medium load, and the receiver load, for the same nominal input power to the HV supply of 300W. Again this is attributed to the diffuse spectral energy content when a wide bandwidth generator is connected to a narrow bandwidth high-Q TMT transmission system.

3. Tank circuit tuning configurations have shown that a de-tuned primary and secondary resonant frequency in the transmitter primary leads to the best balance between transferred electric power, and stable, consistent, and long-term reliable operating conditions.

4. Radiant energy and matter phenomena have been observed in the experiment, and indicate components and optimizations, including different generator configurations, that will intensify and maximise these unusual observations.

5. Generator configurations and types that improve the impulse/pulse/burst nature of the transferred energy may intensify radiant energy phenomena by generating a more uni-directional pressure wavefront in longitudinal system, which may also provide additional insight into the preliminary investigations into the displacement of electric power.

The results for the transference of electric power in the near-field using a spark gap generator indicate that this form of generator is not well suited for energy transmission in the narrow bandwidth high-Q TMT system. A very large and robust spark gap generator would be required to transfer adequate power from generator to load, with considerable losses at the spark gap, huge electromagnetic interference to the surrounding medium, and invasive and unstable operating conditions. However this form of generator does appear to lend itself to phenomena that arise from the longitudinal pressure wavefront generated in the cavity of a resonant transformer, such as a Tesla coil. As such it is conjectured that this form of generator may be useful in the exploration of displacement, the hidden underlying coherent guiding principle of the undifferentiated electric and magnetic fields of induction.

Click here to continue to the next part, looking at High-Efficiency Transference of Electric Power.


1. Dollard, E. & Lindemann, P. & Brown, T., Tesla’s Longitudinal Electricity, Borderland Sciences Video, 1987.

2. Dollard, E. and Energetic Forum Members, Energetic Forum, 2008 onwards.


Transference of Electric Power – Part 1

In this first part we will look at both video experiments and measurements to investigate and demonstrate the transference of electric power via the transmission medium of a single wire, and combined with and without multiple loads. The experiments are undertaken using the flat coils designed, measured, and tested in detail here. Part 1 of this topic is intended to experimentally introduce the transference of electric power, and the various properties, phenomena, and effects that can be measured within such an electrical system when excited using the vacuum tube generator as a feedback oscillator, details here.

A more detailed introduction to the principles of transference of electric power can be found here. The experimental work in this part is intended to investigate and demonstrate aspects of the following:

1. Tuning measurements using a vector network analyser to measure Z11, the small signal ac input impedance for the experimental system, from the perspective of the generator.

2. Tuning the transmitter and receiver to different points to demonstrate different transference phenomena.

3. Single wire transmission and the longitudinal magneto-dielectric (LMD) mode.

4. Tuning to power a load within the single wire transmission line.

5. Tuning to power a load at the output of the receiver.

6. Tuning to establish the LMD mode of transmission between the transmitter and the receiver.

7. Tuning to establish the null point of the LMD mode within the single wire load.

8. Tesla’s wireless transmission of electric power in the near field, using a pair of tuned Tesla magnifying transformers (TMT).

9. Transference of electric power between the transmitter and receiver in the near field.

Figures 1 below show an overview of the experimental arrangement which consists of two flat coils used as transmitter and receiver and joined via the base of the secondary coils by a single wire transmission line with an inline 100W four incandescent lamp load, (4 x 25W 240V pygmy lamps). The transmitter primary is connected to the 811A vacuum tube generator via a matching unit which in this case consists of only a 1200pF vacuum variable capacitor in parallel with the 2 turn copper strap primary. The receiver primary is tuned by another parallel connected 1000pF vacuum variable capacitor which in turn is connected to another 100W four incandescent lamp load. The outer end terminal of the receiver primary is connected directly to RF ground via a low inductance ground strap. The secondary coils of the transmitter and receiver are positioned facing each other on axis 1.5m apart, and are counter-wound to each other in order to produce a balanced and reciprocal cavity arrangement.

The 811A vacuum tube generator is used in this experiment as a tuned plate class-C Armstrong oscillator which derives automatic feedback from a pick-up coil placed close to the secondary coil of the transmitter, and can be clearly seen on the back of the transmitter in figures 1.4-1.6. The advantage of using a self-tuned oscillator as the generator for this experiment is that complete tuning of the system can be easily accomplished simply by adjusting CPT, the primary capacitance of the transmitter, (and for fine tuning CPR the primary capacitance of the receiver). As CPT is adjusted over its range the generator tracks the tuning changes in the overall system allowing very precise and optimum frequency tracking through the various resonant bands of the system.

The dis-advantage of self-tuning the generator in this way, is in the regions where there is very little coupling between the primary and secondary of the transmitter coil, (far from the resonant regions), there is insufficient feedback to the vacuum tubes and oscillation can be unstable or non-existent. To explore these low coupling regions a fixed frequency excited linear amplifier would be the preferred choice, which will be covered in another part. For this part in exploring the transference of electric power via transmission between a transmitter and receiver coil via a single wire transmission line, we are most interested in the resonant regions of the system where the self-tuned oscillator allows for convenient and accurate tracking within these bands.

The first video introduces the experimental setup, instrumentation, and readings, and then looks in detail at the Z11 small signal impedance characteristics for a range of different tuning conditions for both the transmitter and receiver coils, combined with a single wire transmission medium, and both with and without multiple incandescent lamp loads.

Figures 2 below show the detailed Z11 impedance measurements that were presented in the first video, and will be referred to in the consideration of the experimental results after the second video.

The second video demonstrates interesting phenomena and effects relating to the transference of electric power from the vacuum tube generator to the transmitter, and then via the single wire transmission medium through to the receiver coil, and to finally the load at the output of the receiver. Various different modes of transmission are considered which are established by different tuning points of the experiment.

There have been a range of different interpretations as to the nature of wireless transmission of power from a resonant transmitter to a resonant receiver, through the surrounding medium, proposed as early as the late nineteen century by Maxwell[1], Tesla[2,3], Steinmetz[4] and much later by others such as Dollard et al.[5,6,7], Tucker et al. [8], and Leyh et al.[9]. Different sources have suggested different mechanisms for the transfer of power between transmitter and receiver, including the Longitudinal Magento-Dielectric mode, Multiple order magnetic field coupling, and Electric field coupling.

In my research into the transference of electric power so far, I have found most validity in both conceptual and experimental terms from wireless transmission at distances greater than that which can be attributed through near-field induction, (the conventional transformer effect), through the principle of the Longitudinal Magneto-Dielectric (LMD) mode. In my consideration of the results of the experiments presented in this post, I find the LMD principle to most closely account for the observed phenomena and properties surrounding the transfer of electric power through a near-field TMT arrangement.

I consider the experiments presented in this post to be transmission in the near-field, rather than what might ordinarily be considered by conventional antenna theory the mid-range, where the distance between the transmitter and receiver is more than 2-3 times the diameter of the coils, (antenna aperture). In this case the central tuned resonance of the TMT system  is ~2Mc/s, which corresponds to a free-space wavelength of ~150m. Since the coils are connected by a single wire transmission line, and are spaced 1.5m apart, I very much consider this scenario to be near-field transmission since the receiver coil is very much less than a wavelength from the source.

The transfer of electric power in this scenario is as a result of the specific modes formed by the electric and magnetic fields of induction, and hence the transfer of power is “inducted” or “extended”, rather than propagated as would be the case for a transmitting antenna. In subsequent posts I will be presenting experiments on the telluric transfer of electric power where the wireless transmission distances are in the far-field, and are very much greater than the wavelength of the fundamental resonant frequency of the TMT system. Despite the near-field arrangement the transfer of electric power in this system is not via the conventional magnetic coupling of the “transformer effect”.

This was confirmed by removing the single wire transmission and simply terminating both bottom-ends of the secondary coils with a short wire extension, in order to lower the impedance at this end and ensure λ/4  resonation. In this condition, and when tuned over the full available frequency range, no transmission of power took place between the transmitter and receiver coils, even when both were tuned to the same resonant frequency at either the upper or lower frequency. If the conventional transformer effect occurred in the near-field then some detectable power would have been transferred between the generator and receiver load. This clearly shows that transference of electric power in this TMT experimental arrangement requires the transmission of the electric and magnetic fields of induction via a lower impedance path through the transmission medium, (in this case the single wire connection). When both of the short secondary extension wires were then subsequently connected to earth, (either independent dedicated rf grounds, or earth points from the utility supply), power was again transferred between the source and load at the correct tuning.

It is conjectured here that transference of electric power, at the correct point of tuning in this experiment, occurs through establishing the LMD mode of transmission as a standing wave between the transmitter and receiver coils, where a cavity is formed between the top-loads of the two secondary coils. In successive cycles of the generator oscillations electrical energy is coupled from the generator into the cavity. The pressure of the wavefront in the longitudinal mode moves backwards and forwards as it traverses the cavity from the transmitter to the receiver, reflected from the top load of the receiver and back again towards the transmitter where it is amplified or suppressed by coupling from subsequent cycles from the generator. Whether the longitudinal wavefront is amplified or suppressed depends on the tuning of the experiment and hence the longitudinal wavelength in the cavity.

At the correct point of  tuning the amplitude of the wavefront is reinforced by successive cycles from the generator. The magnitude of this longitudinal wavefront reaches an equilibrium in the cavity based on the impedance characteristics of the cavity medium, its tuning, and dissipation of the stored power to both the transmission medium, and to the surrounding environment. The longitudinal wavelength within the medium is longer than that of the generator excitations, which represents a lower frequency of oscillation for the longitudinal mode. This puts the electric and magnetic fields of induction at different phase relationships throughout the length of the cavity, a property of the longitudinal mode that can measured in the cavity region, and is presented in the consideration of the experimental results below.

At the correct point of tuning the di-electric and magnetic fields of induction in the LMD mode form a standing wave in the cavity which results from the longitudinal wavelength, where the boundaries of the cavity are defined by the high impedance, high potential, points at the top-loads of the coils, and one or more null points form inside the cavity. At the fundamental frequency of the LMD mode, (not the same frequency as the fundamental resonance of the secondary coils or the generator oscillations), only a single null will exist in the centre of the cavity, and when the coils are closely spaced in the near-field. At higher order harmonics, and dependent on spacing between the coils multiple null points can form.

Each of the key experimental parts is now considered in more detail, and where appropriate based on the conjecture made above regarding the LMD mode of transmission:

Single wire transmission and the LMD mode

A key feature of the presented experiments in the transference of electric power between the transmitter and receiver is that power is transferred via a single wire which in itself is an unsusual method of transfer within standard electric circuit theory and experiment.

In a standard closed electric circuit current is continuous throughout the circuit with the voltage potential around the circuit dependent on the impedance of the elements and/or transmission lines that make up the circuit topology. The underlying premise is that a circuit has a forward and return path where the impedance is sufficiently low to allow for a “flow” of current from the source around the circuit, and returning to the source. Power is dissipated in the various impedances that make up the circuit according to their characteristics and the voltage and current phase relationship of the overall impedance of the circuit.

Ordinarily introducing a very high impedance, (in principle an infinite open-circuit), will reduce the current in the circuit to such a low-level, and in principle to zero, so that no current can flow around the circuit from and returning to the source, and hence no power is dissipated in that circuit. Even in an rf transmission line the normal transverse mode of transmission assumes a voltage and current distribution long the transmission line based on its distributed impedance, and its matching to the source and load terminations, where the transmission line is based on a closed circuit formed between the source and load in two or more conductive mediums between the source and load.

As can be seen in the videos the four incandescent load can be fully lit where no obvious closed circuit exists. The load is not connected between the outputs of the secondary (topload and base of the secondary), but is rather only connected via the base of a secondary. The other side of the load is left as open-circuit with a short trailing wire. Once again a cavity is formed between the top-load of the transmitter secondary and the open-circuit of the trailing wire, which would enable the LMD mode to establish. The electric and magnetic fields of induction are both present around the boundaries of the single wire, and a longitudinal wavefront is established at the longitudinal frequency in the cavity. At the upper and lower resonant frequency of the secondary energy is coupled from the generator into the cavity, and the longitudinal mode is established along the length of the cavity.

A higher impedance load placed within the electrical cavity at resonance will dissipate power in a transverse mode from the established wavefront when the electric and magnetic fields of induction local to the load are in phase. That is, the induced voltage across the load, and the induced current in the load, are predominantly in phase in the region of the load. In this case energy can then be transferred (induced) from the longitudinal wavefront to the transverse mode, and power will be dissipated in the lamp as both light and heat with a warm yellow colour temperature, as can be seen in the video. Placing the load right at the end of the wire will not light the incandescent lamp at the termination of the cavity, where the voltage and currents induced in the wire are 90° out of phase at the open-circuit termination.

Figures 3 below shows the phase relationship between the voltage and current oscillations of the generator in the primary, and the phase relationship between the voltage and the current at three different points in the single wire section of the cavity. It is conjectured that the changing phase relationship between the induced voltage and currents along the single wire is characteristic of the longitudinal mode established in the cavity, and results in unusual electrical phenomena and characteristics that are measured in TMT experimental systems.

In each figure the traces are as follows:,

Yellow – The voltage across the transmitter primary.

Green – The current through the transmitter primary, calibrated 1A/div.

Cyan – The voltage measured at centre of the single wire transmission line.

Red – The current measured through the single wire transmission line, calibrated 1A/div.

Each frequency 1.75, 1.94, and 3.32 Mc/s are measured at three different points in the single wire section of the cavity:

SWC1 – At the bottom-end of the transmitter secondary.

SWC2 – In the middle of the single wire.

SWC3 – At the bottom-end of the receiver secondary.

It is important to note from these measurements the varying change in phase relationship between the voltage and current at the transmitter, centre, and receiver ends of the single wire, (cyan and red trace), for tuned power in the receiver load, figures 3.4, 3.5, and 3.6. It is conjectured that this varying phase change across the single wire length between the voltage and the current, (~1.94Mc/s), which is hardly present when not correctly tuned for the transference of electric power (~1.75Mc/s and 3.32Mc/s), is indicative of a standing wave resonance of the LMD mode in the cavity, a cavity which has been formed by two coils that are matched at resonance in the TEM mode, and joined by a transmission medium. It is the combination of matched resonance in the TEM mode at the coils, and a tuned standing wave of the LMD mode that leads to the transference of electric power with very low loss between the generator and the final receiver load.

Tuning to power a load within the single wire transmission line

This experimental point is shown in figures 1.1 and figures 2.4, 2.7-2.9. Interestingly this condition is little different to the open-circuit terminated single wire case discussed above. However, now both transmitter and receiver are connected together via the single wire transmission line which also contains an incandescent lamp load. The single wire lamps could be tuned to light fully at either the lower or upper resonant frequencies of the combined secondary coils, with no or very little power dissipated in the final load at the receiver primary.

Once again a cavity is formed between the two top-loads of the transmitter and receiver secondaries, and through the single wire transmission line, the LMD mode is present, and there is a varying phase relationship between the voltage and current measured in the single wire. The  mis-match in tuning between the transmitter and receiver means that, whilst the LMD mode is always present, it is not tuned to form a standing wave in the cavity. There are no detectable null points along the single wire and the neon lamp at the top-load of the receiver is not lit, showing that there is no high-potential at the top-end of the receiver coil. In this case the TMT transmission system is not tuned between the transmitter and receiver and so no power is being coupled through the receiver coil to its load. The system appears almost identical to the open-circuit single wire case above.

Energy is being coupled at the secondary resonant frequency from the generator into the transmitter secondary in the transverse mode, and the mis-match in tuning between the high-Q transmitter and receiver means that energy is not reaching the receiver coil but rather being consumed in the load in the single wire. This is further demonstrated in the video when the receiver secondary is unplugged from the single wire the lamps of the load in the single wire stay lit, they do change intensity slightly as the tuning changes, but can be returned back to full brightness by slight adjustment at the transmitter primary capacitor.

In summary, the transference of electric power from the generator to the single wire load occurs at the lower or upper resonant frequency of the transmitter coil, and is largely independent of the mis-matched termination at the other end of the single wire, whether that be a simple open-circuit, or short-circuit to ground, or another mis-matched resonant circuit such as a TMT receiver.

Tuning to power a load at the output of the receiver

This experimental point is shown in figures 1.2 and figures 2.5, and 2.6.  With careful tuning there is a very narrow band, as seen on the video, where the high-Q TMT transmitter and receiver are tuned very accurately to one another, and power can be transferred directly between the transmitter and receiver via the single wire transmission, and with very little power dissipated in the single wire or its load. In this experimental setup the tuned frequency at the generator is between ~1.92 – 2.05 Mc/s to demonstrate the transference of electric power between generator and final load.

In this scenario the LMD mode is tuned in the cavity to form a standing wave, a null point is present at the centre of the path length of the cavity, which in this experiment where the single wire load was placed. Both top-loads are at maximum potential indicating that the cavity is in the fundamental resonant frequency of the LMD mode, that is nλLMD/2,  where n=1 and there is a high potential point at the transmitter top-load, a zero potential null point in the single wire, (at the single wire load), and a high potential point at the receiver top-load.

Overall this is now the special condition where firstly, the transverse electromagnetic mode (TEM) is matched independently for both the transmitter and receiver coils, so they are both able to couple maximum energy, the transmitter from the generator, and the receiver to its load, at the same resonant frequency. This is secondly combined with the LMD mode formed in the secondary coil of the transmitter TMT, and tuned within the cavity of the single wire transmission medium to form a standing wave, where in its fundamental mode a single null point exists in the centre of the single wire transmission medium. The combination of the TEM and LMD modes both correctly tuned, leads to an inter-dependent balanced condition within the electrical system, where transference of electric power between the generator and load can occur with minimal loss.

In principle, transmission in this mode could cover great distances where an LMD standing wave is established in a transmission cavity where there are many null points along the single medium of the conductor, whether that be a wire, the earth, or other lower impedance or resonant medium. Again in principle with the correct setup of the TEM and LMD modes in the complete system very little power need be lost in the transmission medium, which can be tuned correctly by detecting the null points in the medium, and the varying phase relationship of the measured voltages and currents in the medium, which appears at this stage to be an indication of the LMD mode.

Summary of the results and conclusions so far:

1. In consideration of the experimental results presented and phenomena observed, it is conjectured that the LMD mode is established in a resonating coil when a cavity is formed between the top-load of the coil, in this case an open-circuit with a neon indicator bulb, and the outer boundary point of the circuit connected to the bottom-end of the coil. The LMD mode enables transmission of the electric and magnetic fields of induction together around the boundary of the single transmission medium, in this case around the outside of the single wire. The magnetic and di-electric fields of the LMD mode are in the same plane of travel and hence constitute a longitudinal pressure wavefront that traverses the cavity reflecting from the high impedance boundaries at each end and establishing an LMD wave with wavelength distinct from the transverse resonant wavelength of the transmitter and receiver secondary coils.

2. When the LMD mode is not established as a standing wave within the cavity of the single transmission medium the energy coupled from the generator into the transmitter coil by transverse induction is consumed by a higher impedance load in the single transmission medium, or with inadequate load in the transmission medium will be discharged to the surrounding environment through streamers at the high potential top-load.

3. When an LMD standing wave is established in the cavity, and the high-Q transmitter and receiver coils are both resonating in equilibrium with each other in the very narrow matched band (~1.92Mc/s – 2.05Mc/s) power is transferred directly from the generator to the final load at the receiver, with very little energy consumed in the single transmission medium

4. An LMD standing wave can be established in a cavity that is geometrically and electrically reciprocal at each end, e.g. with an identical TMT transmitter and receiver designed to resonate at the same transverse frequency, which causes the longitudinal pressure wave to be reflected from each end of the cavity.

5. Where the wavelength of the LMD mode is a whole number of half-wavelengths nλLMD/2, amplification of the LMD mode will occur in the transmitter until a dynamic equilibrium is established within the electrical system and with the surrounding medium. In this case the null point/s of the standing wave can be measured in the single transmission medium, and tuned carefully either side of this point will show the null point to move towards either end of the single transmission medium, before collapse of the standing wave at the coil boundaries.

6. The LMD standing wave mode could be indicated by a varying phase change between the voltage and current waveforms measured along the length of the transmission medium. It is conjectured that this phase change is preliminary evidence of the amplified longitudinal mode established in the cavity.

7. The combination of the TEM and LMD modes both correctly tuned, leads to an inter-dependent balanced condition within the electrical system, where transference of electric power between the generator and load can occur with minimal loss.

The preliminary results for the transference of electric power in the near-field indicate that considerable more study is required on the various transmission modes present in the TMT system, and particularly a more detailed measurement and study of the phase relationships of the electric and magnetic fields of induction in the transmission medium, and the difference in the resonant wavelengths of the transverse and the longitudinal modes. These two modes appear to interact constructively and in an inter-dependent way when tuned for the optimal transference of electric power between the generator and the receiver load.

Click here to continue to part 2 on the transference of electric power, where the experiment is powered by a spark gap generator, and the differences explored and contrasted to the results obtained here with a single frequency feedback oscillator.


1. Maxwell, J., A Dynamical Theory of the Electromagnetic Field, Phil. Trans. Royal Society, pg459-pg512, January 1865.

2. Tesla, N., System of transmission of electrical energy, US Patent US645576A, March 20, 1900.

3. Tesla, N., Colorado Springs Notes 1899-1900, Nikola Tesla Museum Beograd, 1978.

4. Steinmetz, C., Elementary Lectures on Electric Discharges, Waves and Impulses, and Other Transients, McGraw-Hill Publication, 1911.

5. Dollard, E., Condensed Intro to Tesla Transformers, Borderland Sciences Publication, 1986.

6. Dollard, E. & Lindemann, P. & Brown, T., Tesla’s Longitudinal Electricity, Borderland Sciences Video, 1987.

7. Dollard, E. and Energetic Forum Members, Energetic Forum, 2008 onwards.

8. Tucker, C. & Warwick, K. & Holderbaum, W., A Contribution to the Wireless Transmission of Power, Electrical Power and Energy Systems 47 p235-242, 2013.

9. Leyh, G. & Kennan, M., Efficient Wireless Transmission of Power Using Resonators with Coupled Electric Fields, Nevada Lightning Laboratory, 40th North American Power Symposium, 2008.