
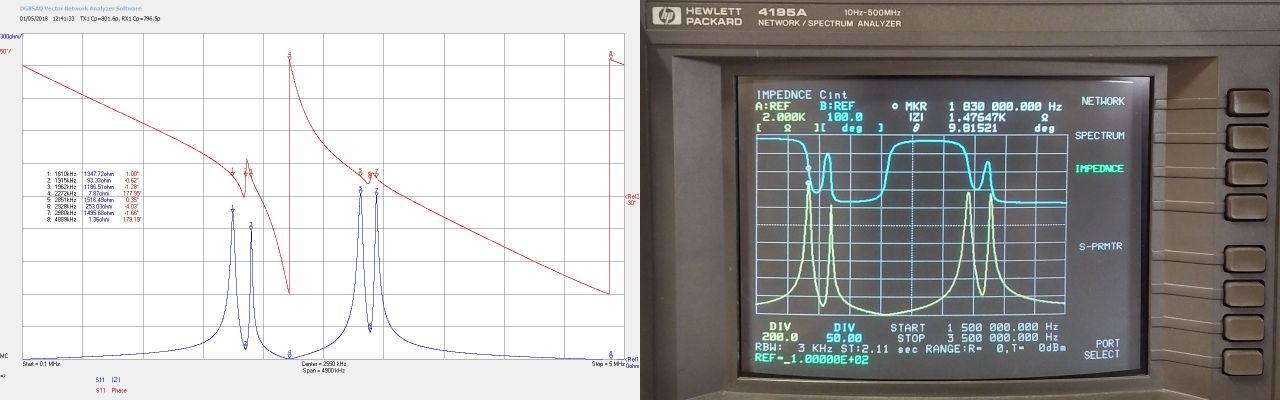
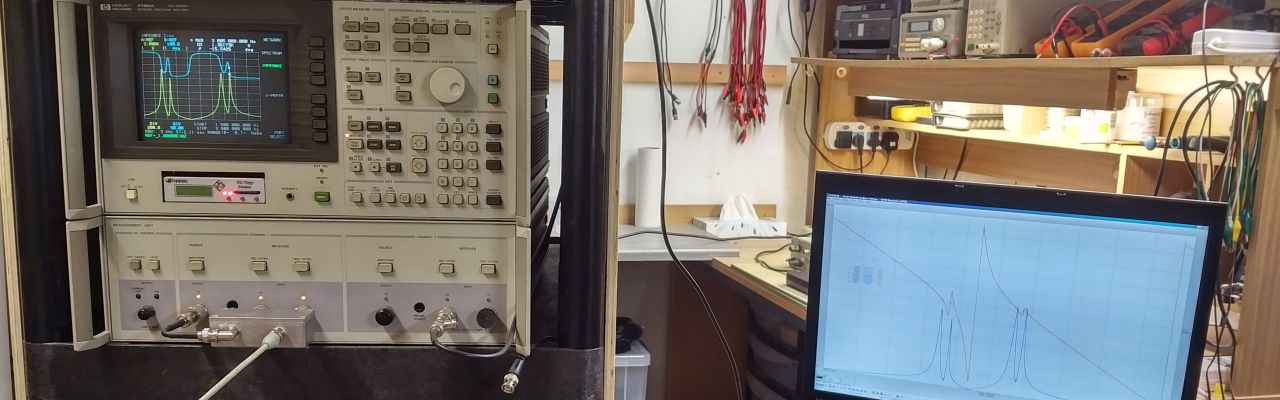
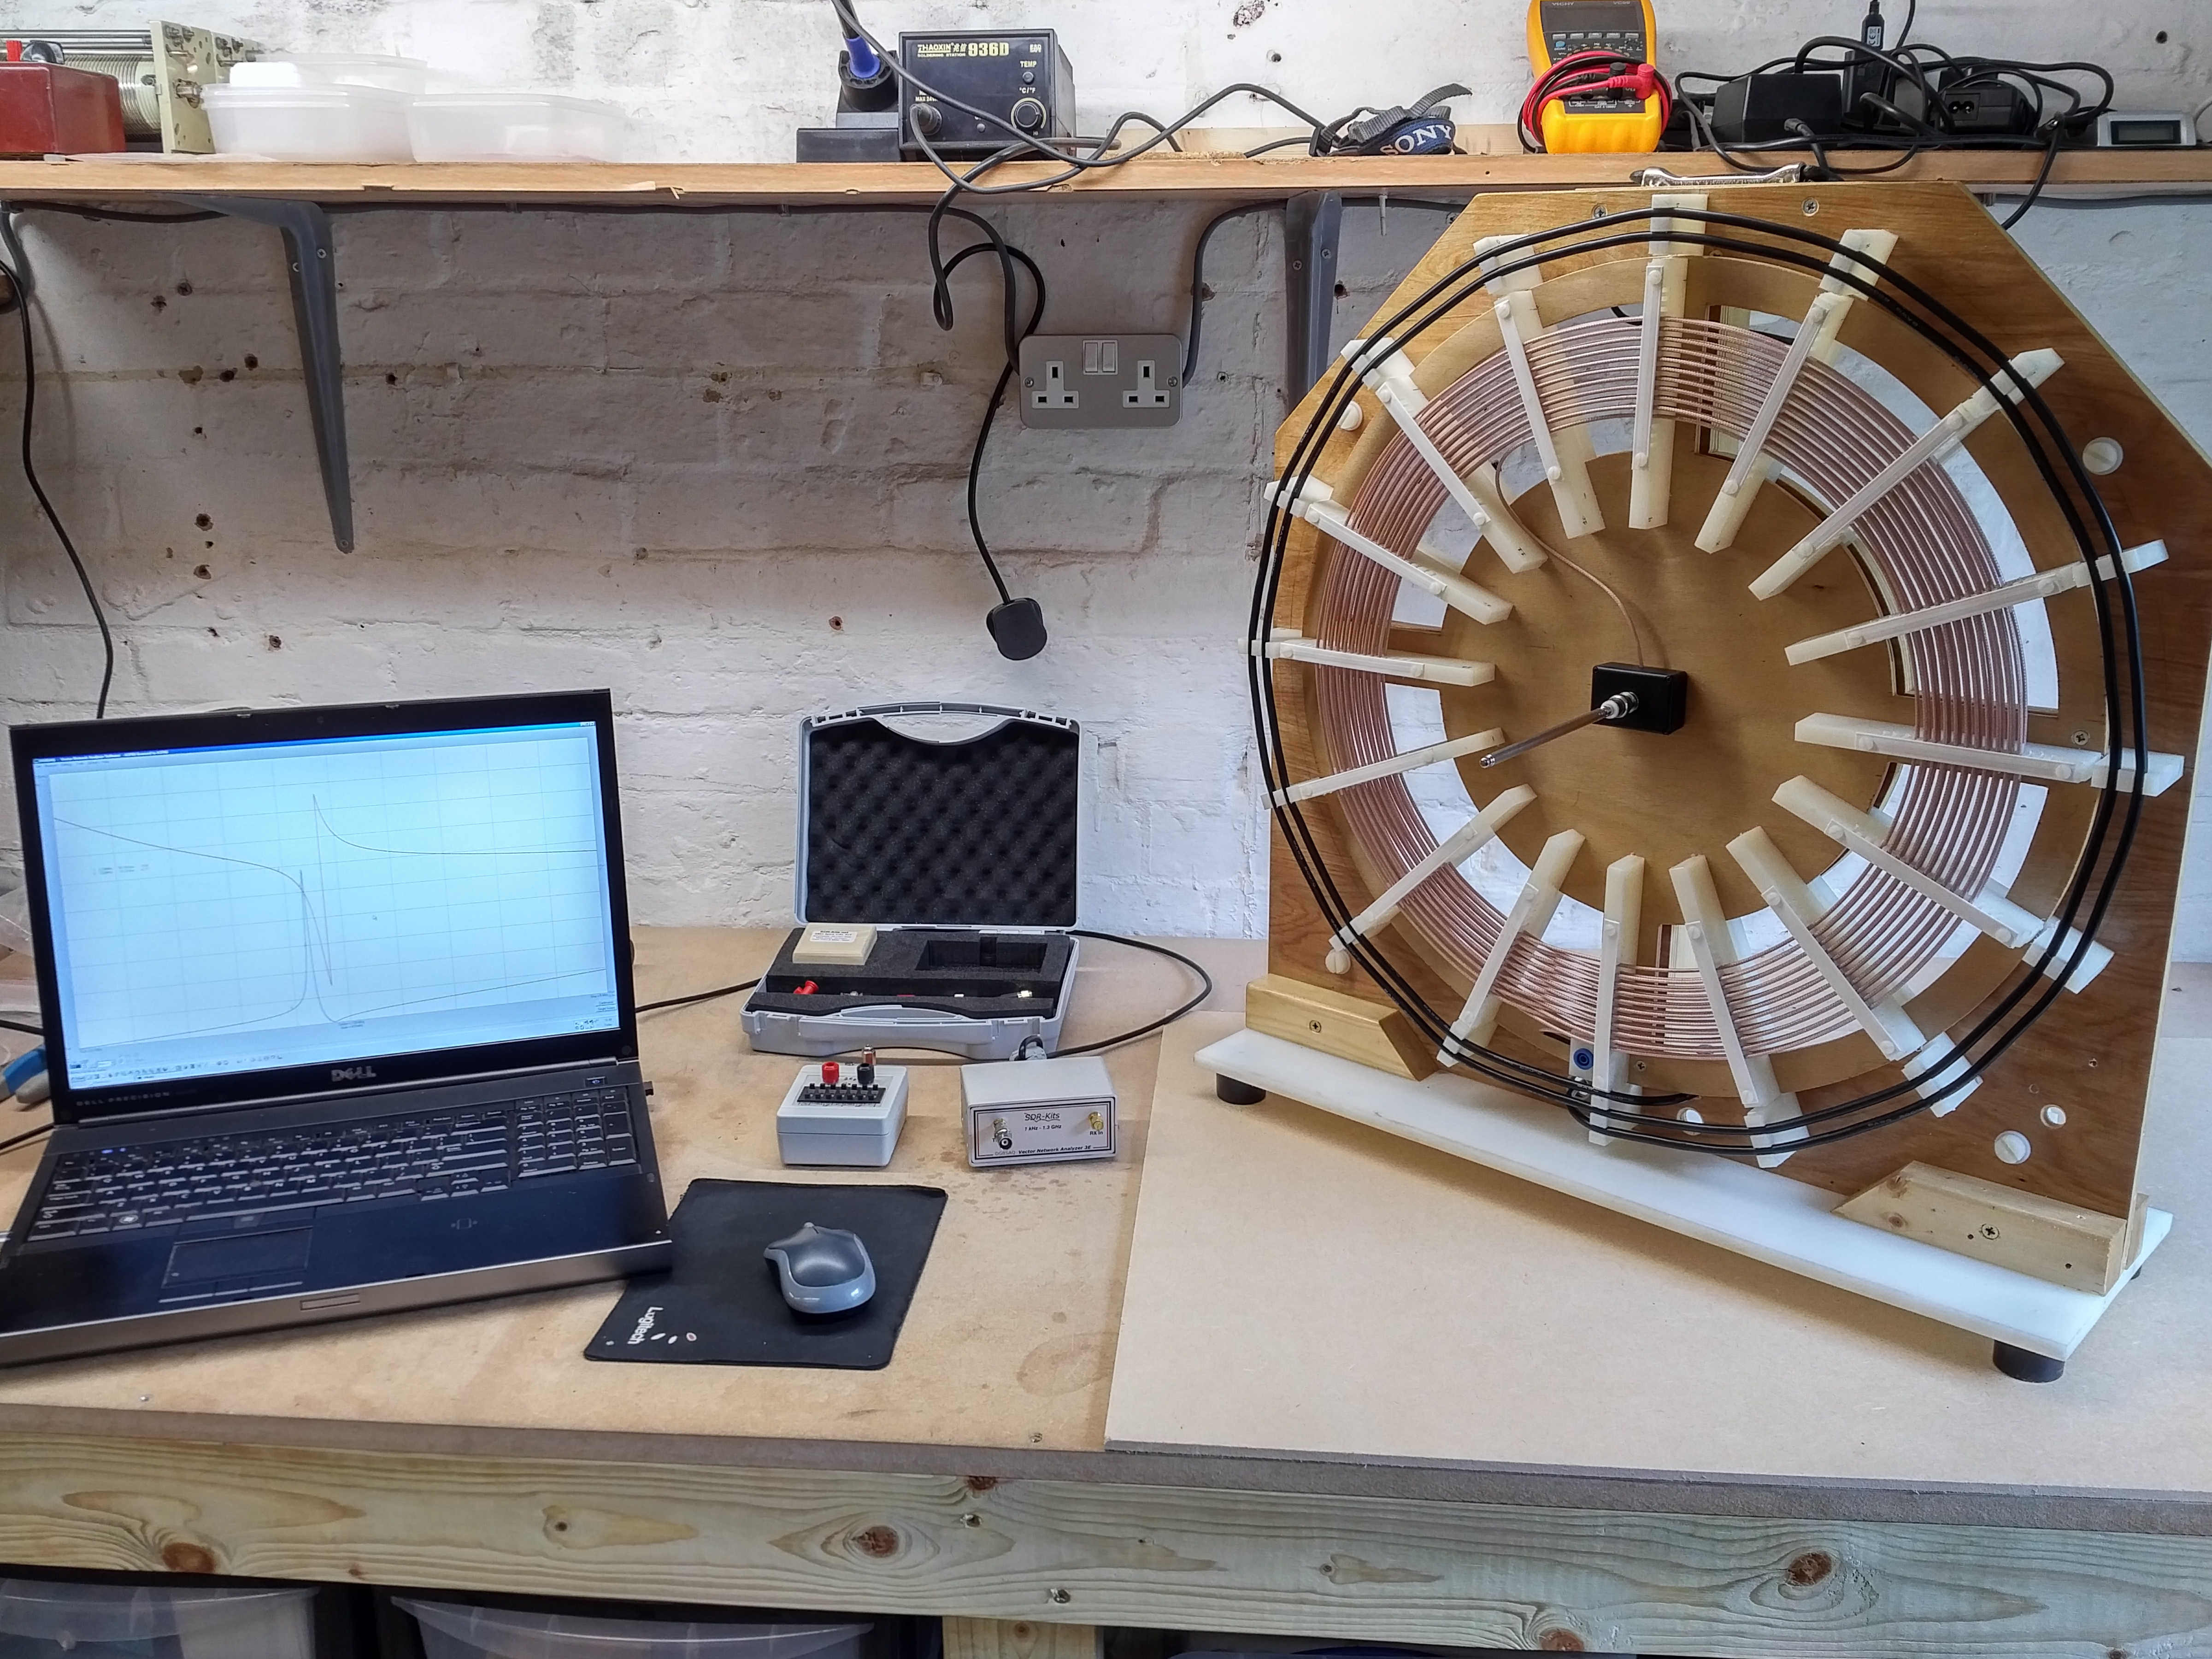
In this second part full input, small signal, impedance characteristics Z11 (magnitude and phase) with frequency of a single flat coil are measured using a Vector Nework Analyser (VNA). The SDR-Kits Vector Network Analyser 3E (VNA-SDR) is predominantly used as it provides data directly connected to a computer. Some measurements have also been cross-measured and checked using a Hewlett Packard 4195A Network Analyser (VNA-HP), and particularly when an equivalent circuit function is required to model actual device circuit equivalent values.
The measurements reported in this second part are for Z11, the effective input impedance that the generator will see when connected to the input of the flat coil, and subsequently in part 3 connected with a range of loads and other flat coils. Impedance measurements for Z21 the transmission impedance between the input of the primary and the output of the secondary will be reported in future parts.
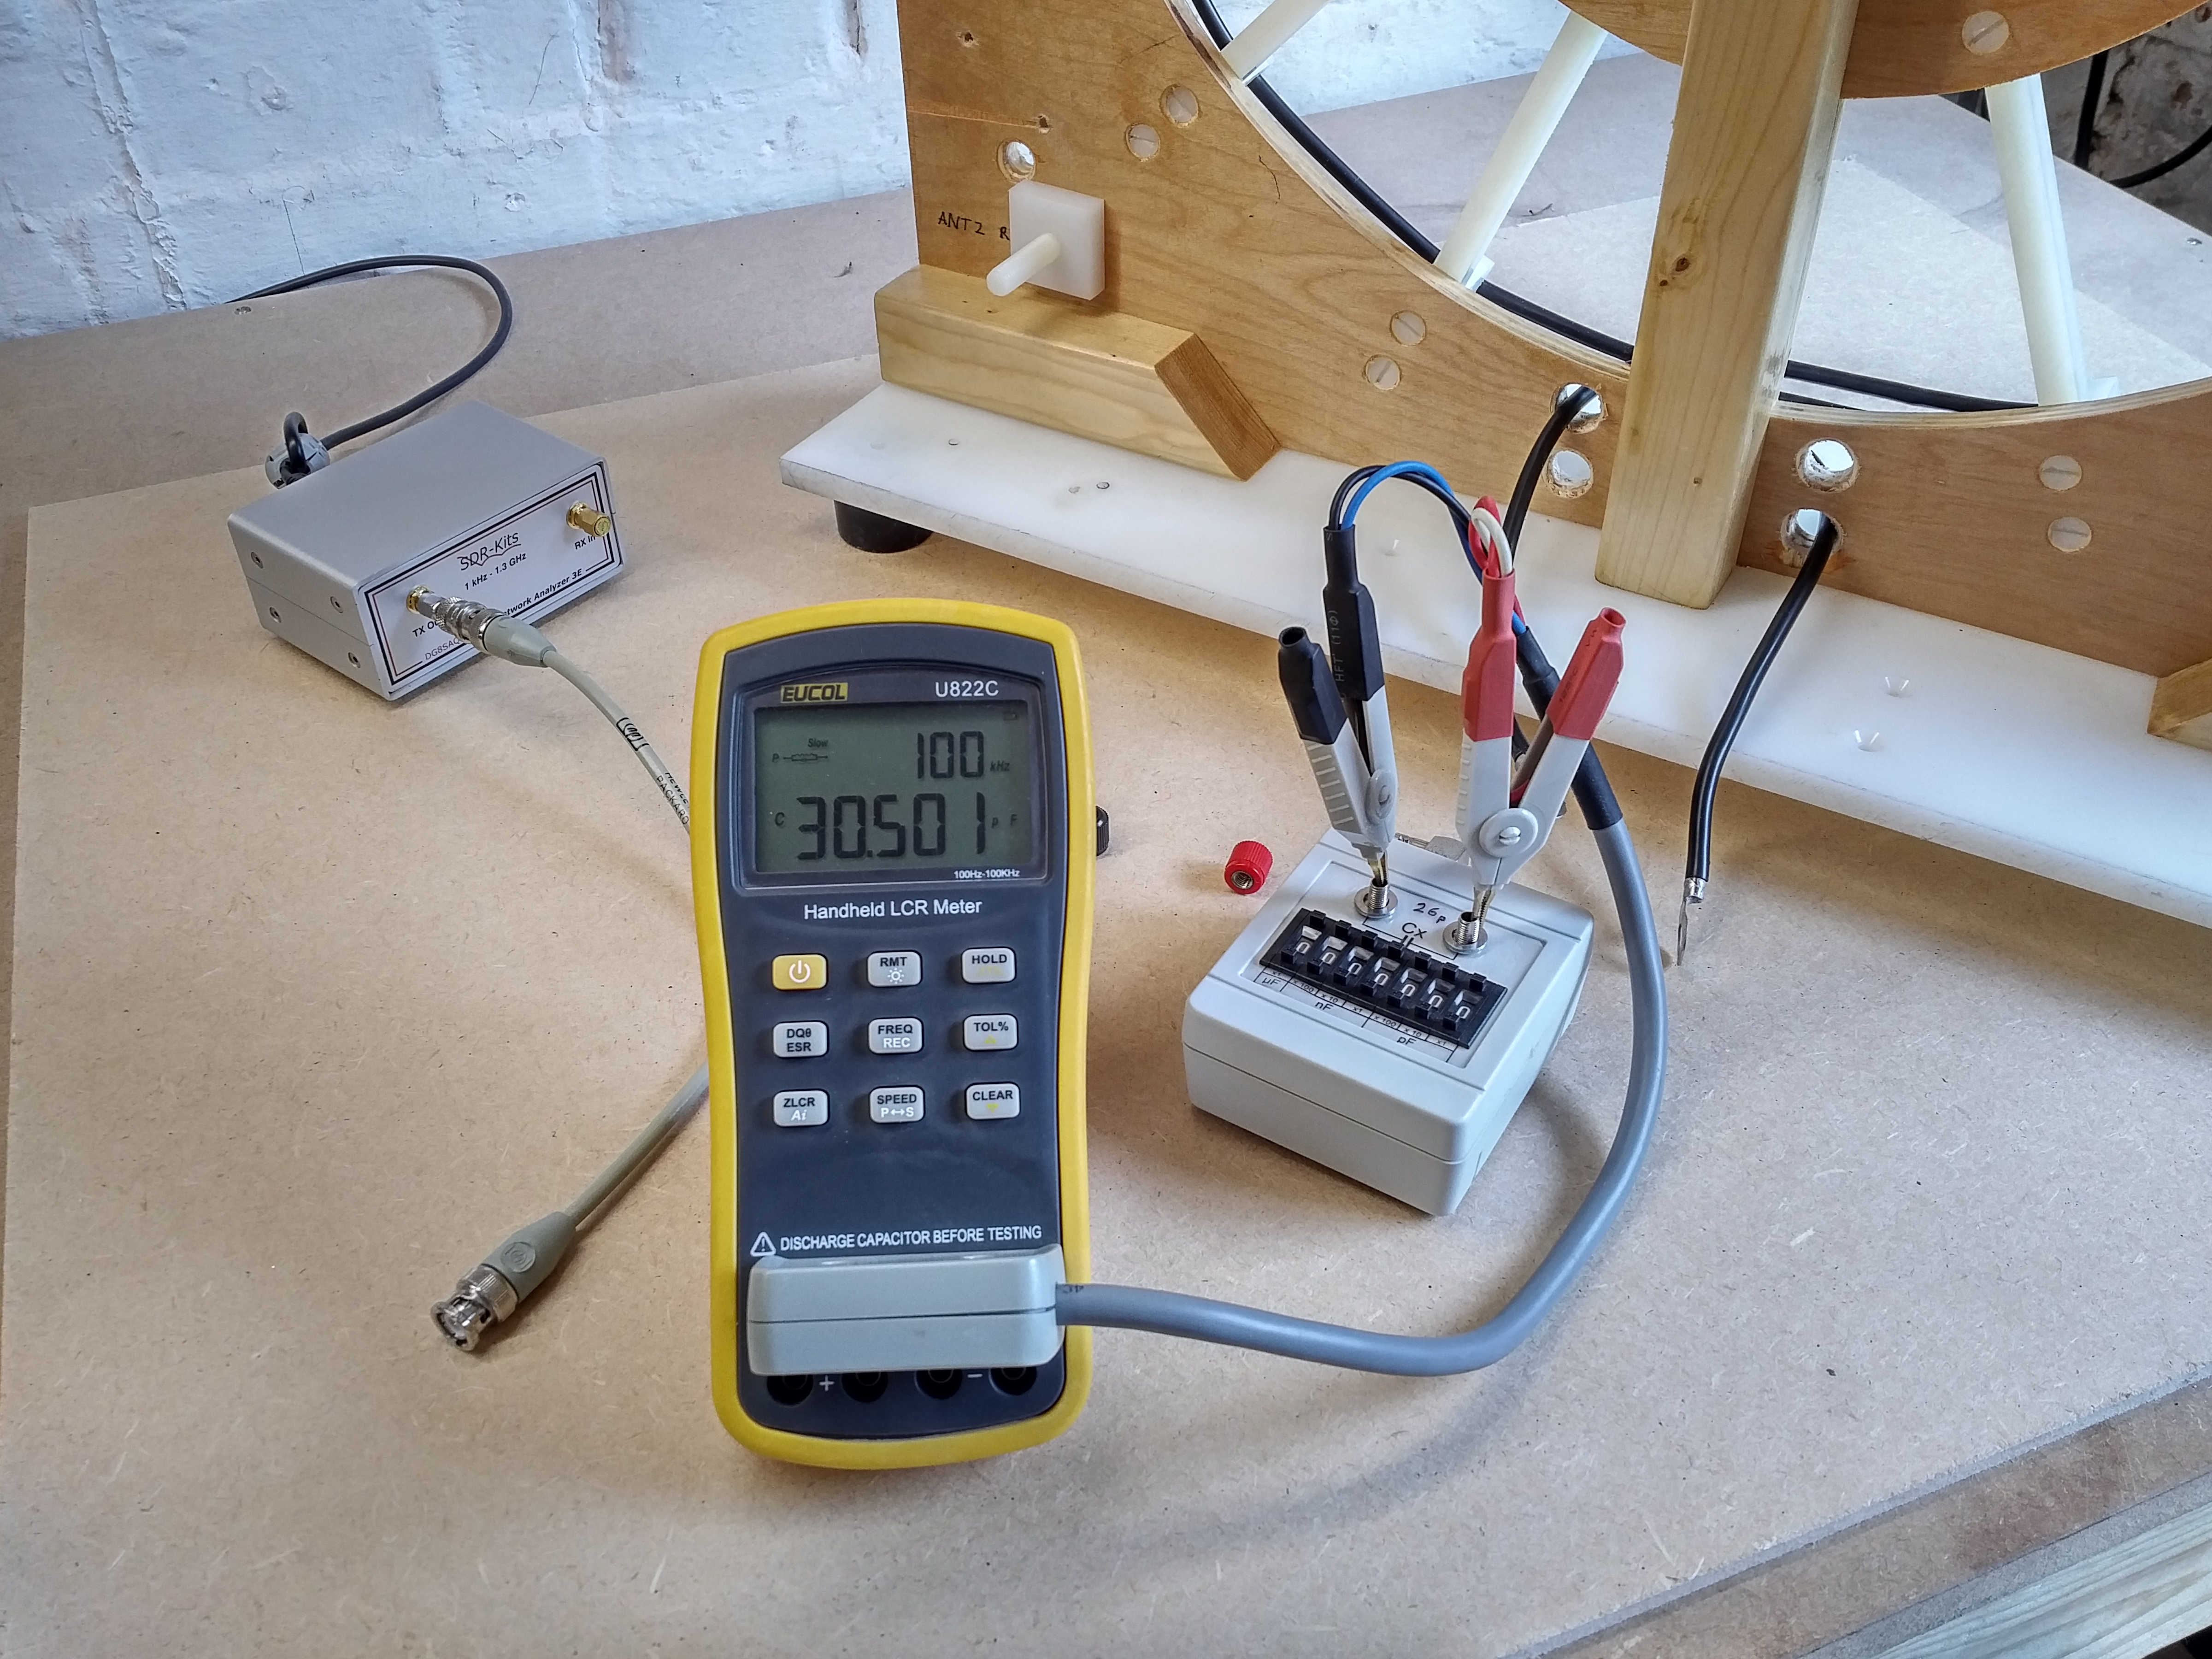
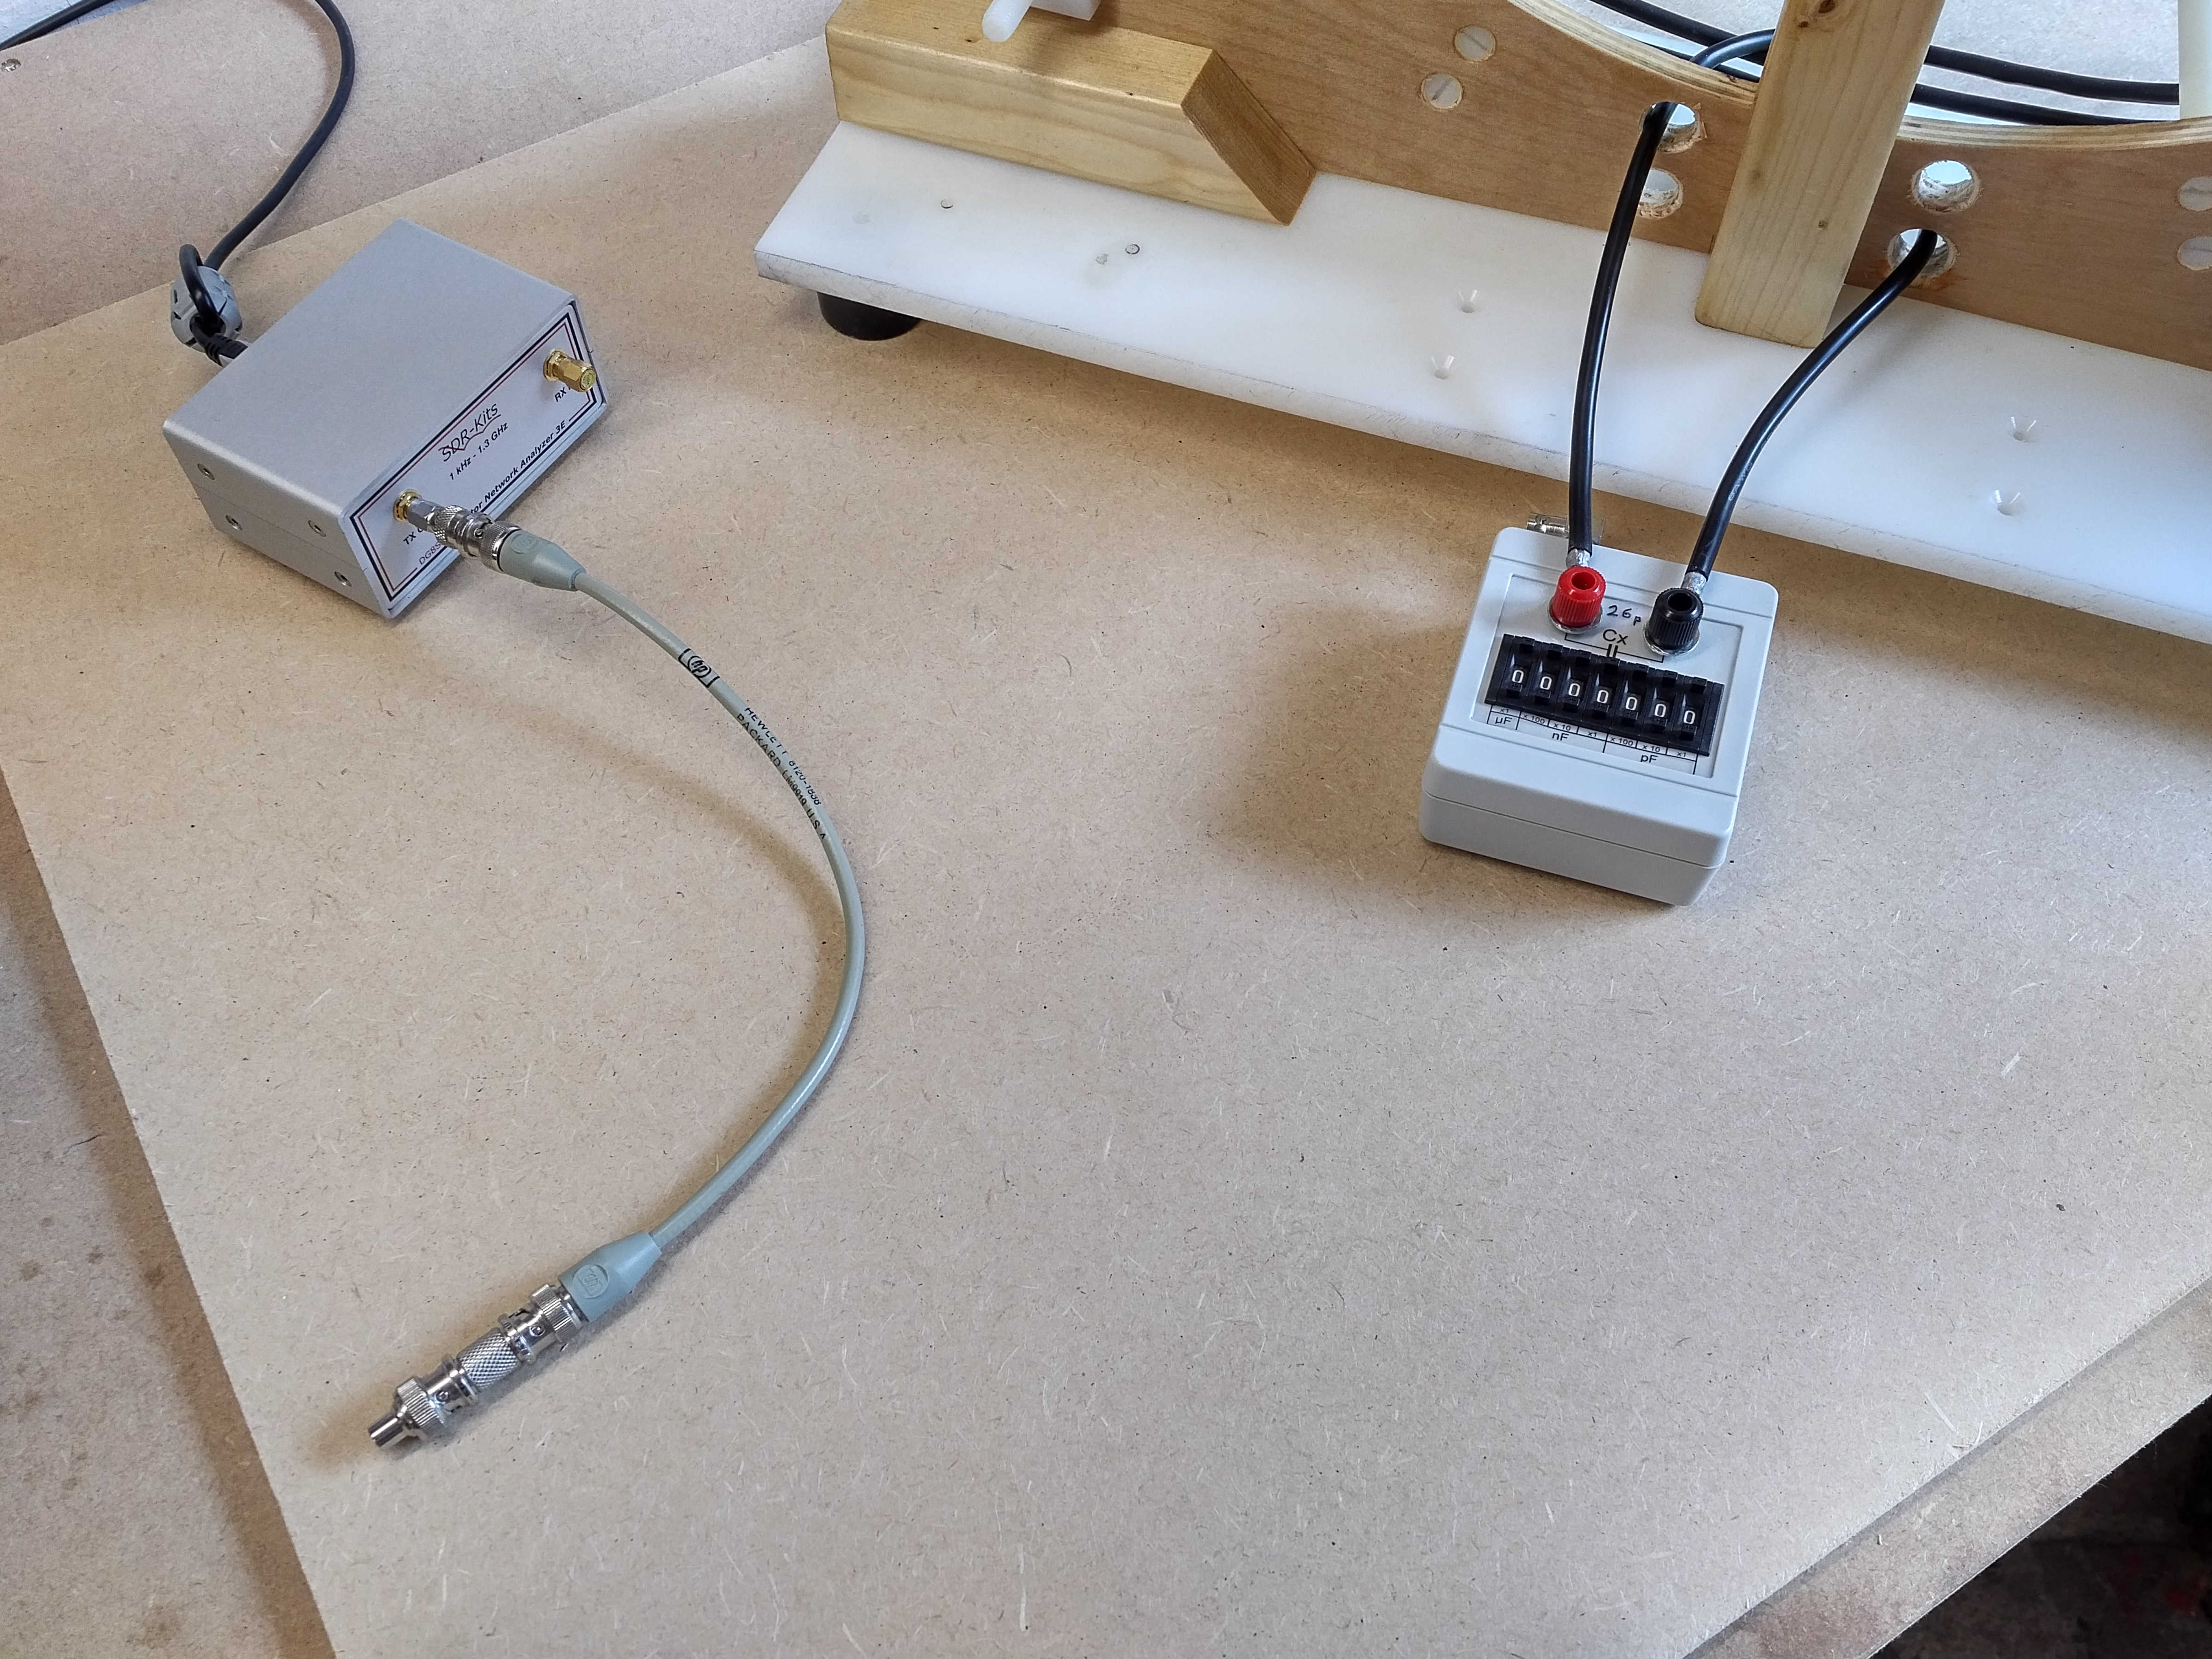
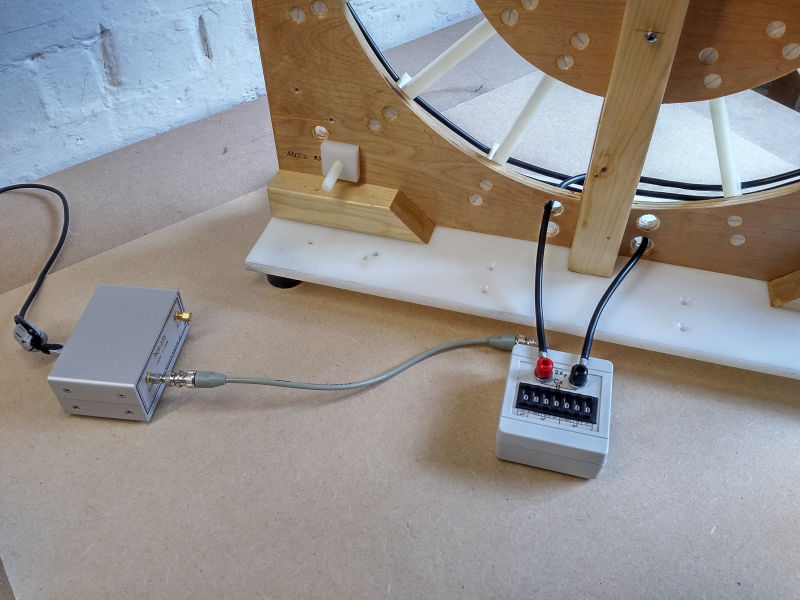
For network analyser impedance-frequency measurements an adjustable capacitance box was connected across the primary coil at the correct termination point to match the equal weights of copper for the secondary and primary. The unconnected load capacitance of the box when set to 0pF is 30.5pF. The VNA being used was calibrated to the end of the coaxial cable to be connected to the capacitance box and then tested with a 50Ω termination for accuracy over the frequency range. This calibration was then re-checked at the end of the measurement cycle to confirm stable calibration throughout the measurement period.
A wider band frequency scan 0.1MHz – 20MHz was used initially in order to identify the fundamental resonance frequency, any low-order harmonics, and any other impedance features of interest. Subsequently the frequency scan band was reduced to (0.1MHz – 5MHz) to allow for greater detail in the results.
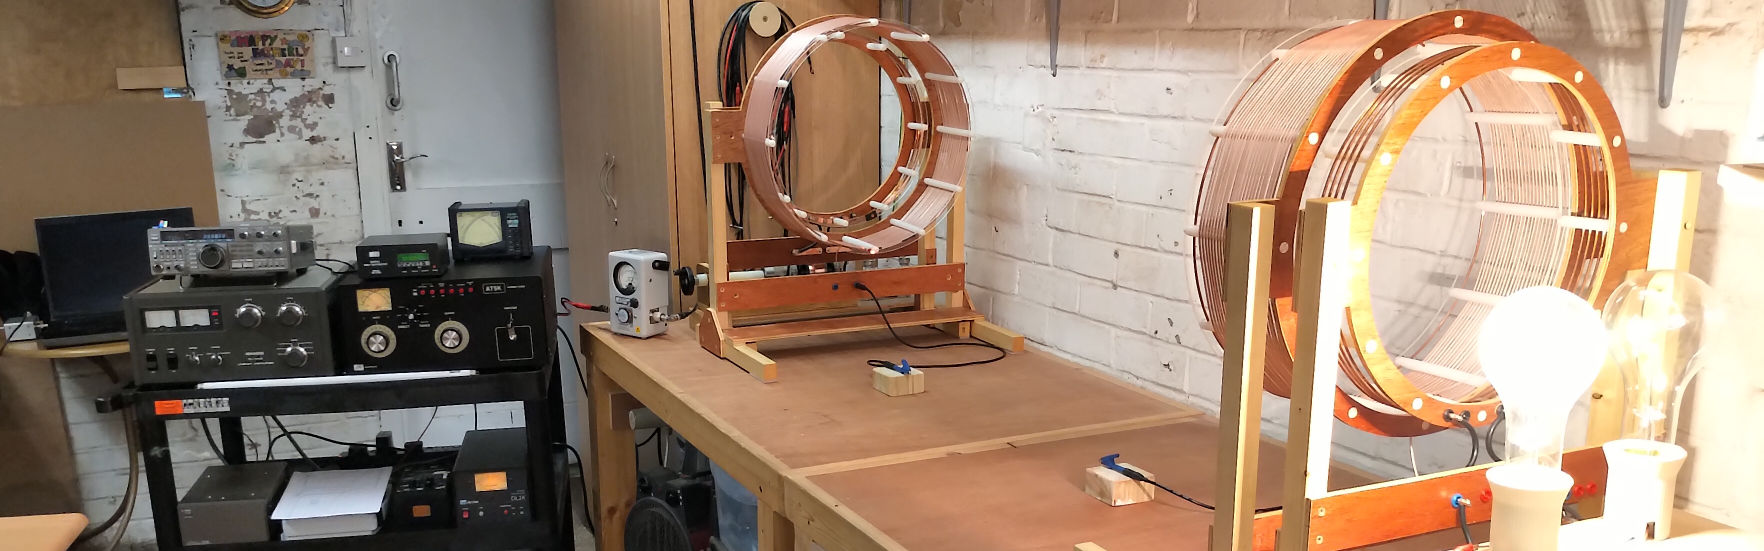
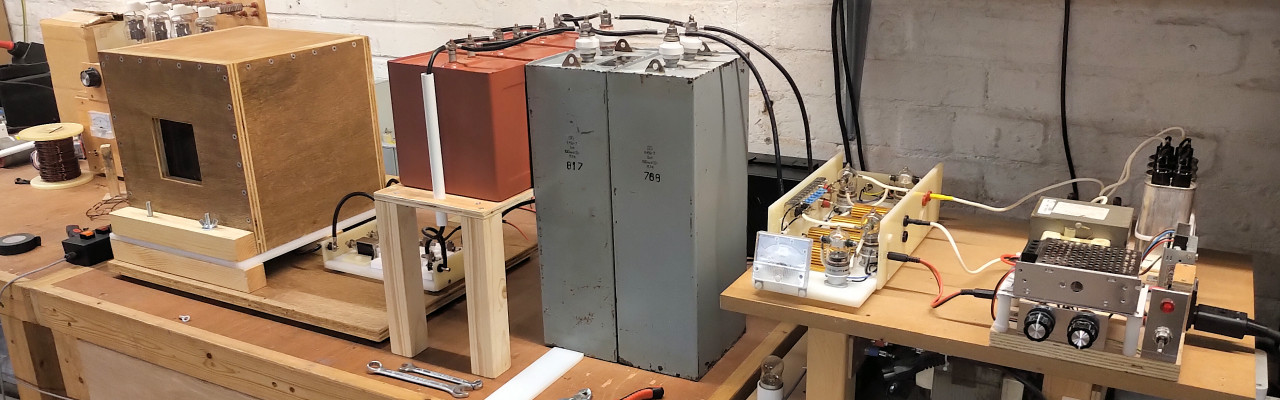
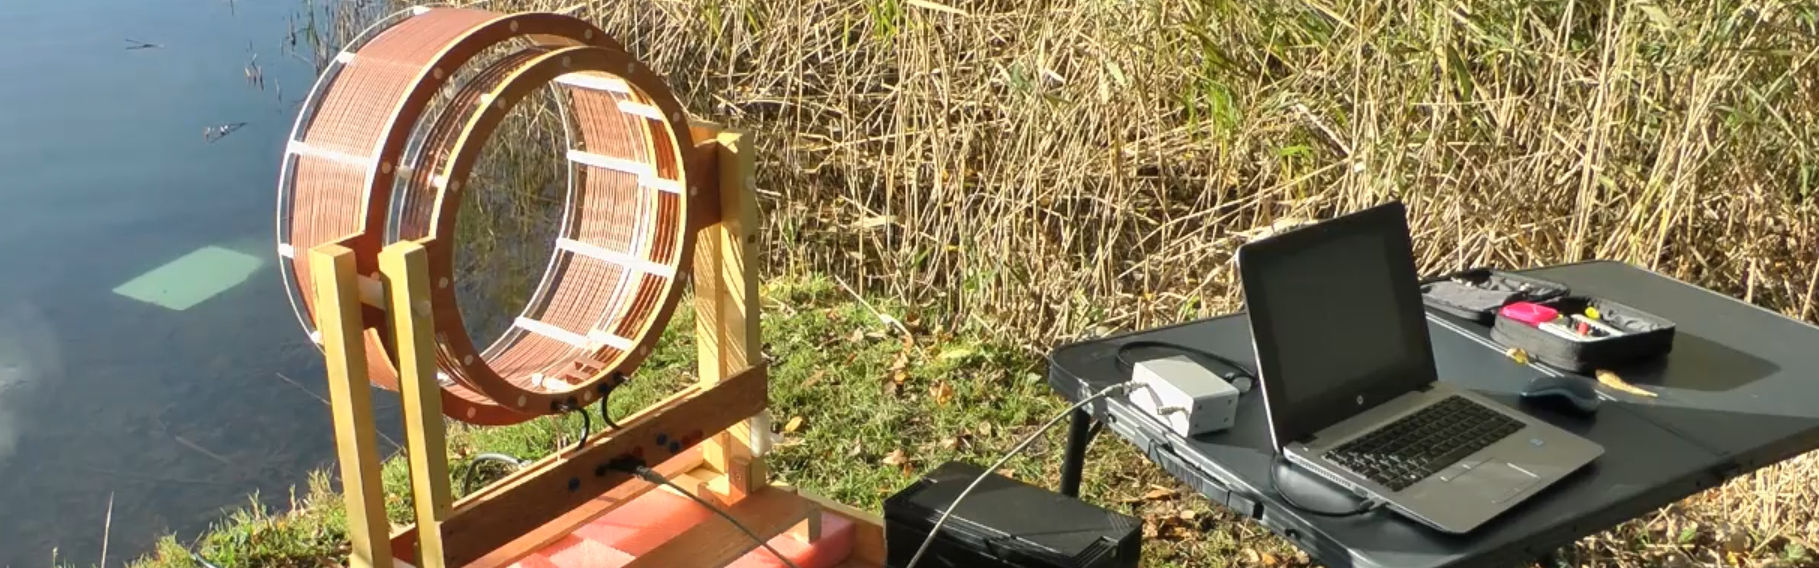
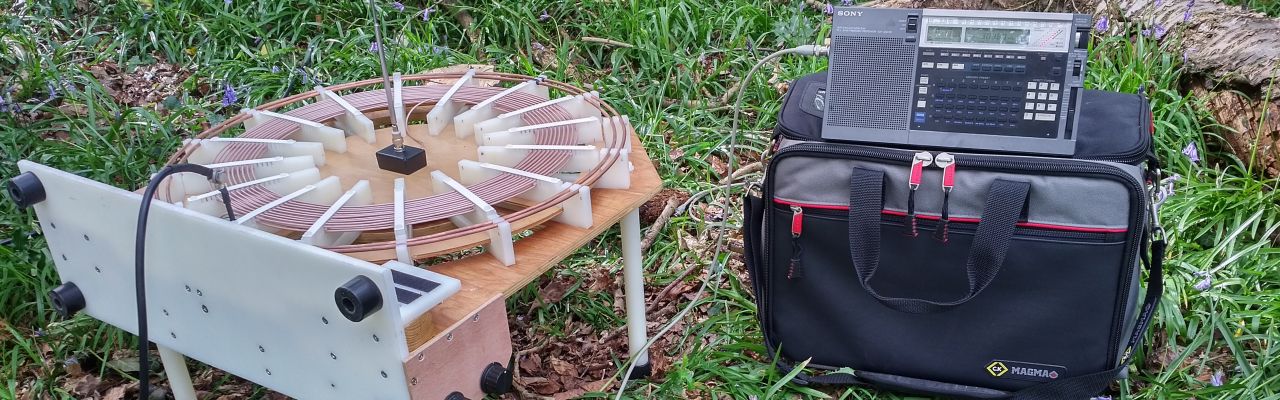
Figures 1. show the measurement arrangement.


VNA-SDR Measurements for 1P Primary
Figures 2. show the wide frequency scan VNA impedance results for Z11 from calibration and through changing load capacitance on the primary. It is recommended to view the full-size scan images where the detail can be seen much clearer, (click on the image to see the full-size image and navigation icons). Below the figures 2. each individual result is considered and explained. In the explanations standard abbreviations are used as follows:
LP = Inductance of the primary coil.
CP = Capacitance box value connected in parallel with the primary coil.
LPCP = Parallel resonant circuit formed by the primary.
CPP = Self-capacitance of the primary including the parasitic capacitance of the capacitance box when set at 0pF, which in total has been measured to be 30.5pF.
FP = Fundamental resonant frequency of the primary.
LS = Inductance of the secondary coil.
CS = Self-capacitance of the secondary coil.
LSCS = Resonant circuit formed by the inductance of the secondary combined with self-capacitance of the secondary.
FS = Fundamental resonant frequency of the secondary (FS1).
FS2 = Second harmonic of FS up to FSN the nth-harmonic.
FØ = Frequency at which a phase change takes place.
FØ180 = Frequency at which a 180° phase change takes place.
FU = Upper resonant frequency of the flat coil.
FL = Lower resonant frequency of the flat coil.
M1 – MN = Frequency markers on the results can be identified with a down pointing arrow on the result curve with a number above it.
Q – The quality factor of an impedance feature. For example, as the Q increases a resonance peak will become sharper and narrower, and as the Q decreases a resonance peak will become more rounded and wider.
|Z| – Magnitude of the impedance, (|ZS| for secondary, |ZP| for primary, |ZU| for the upper frequency of the flat coil, and |ZL| for the lower frequency of the flat coil).
Ø – Phase of the impedance.
To view the large images in a new window whilst reading the explanations click on the figure numbers below:
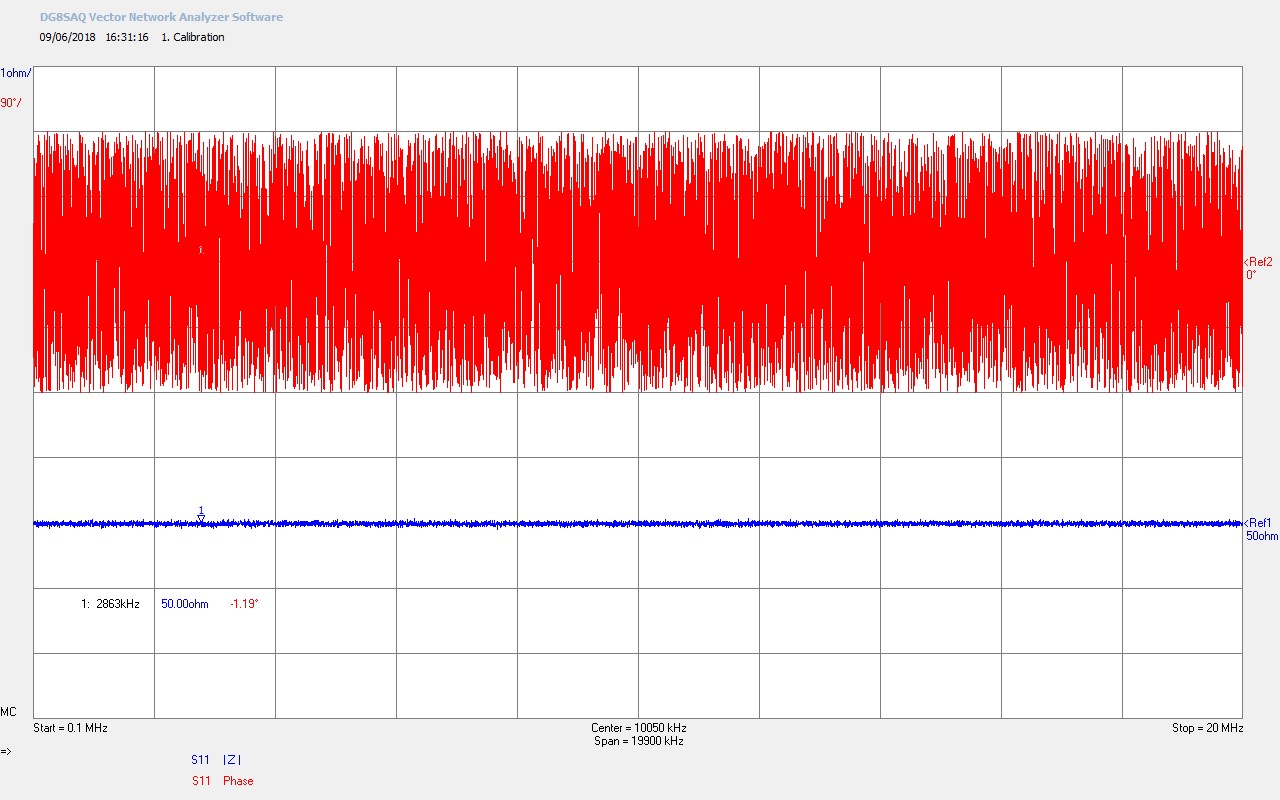
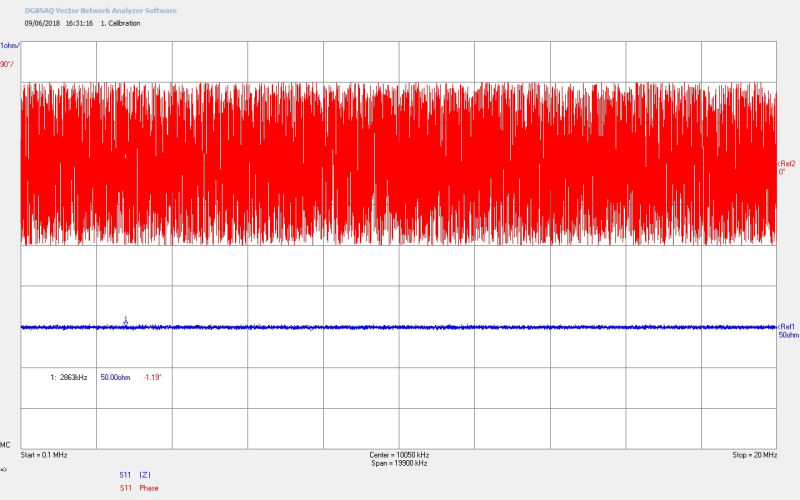
Fig 2.1. Shows the calibration to the end of the bnc connected to the primary capacitance box (CP). For this calibration the bnc was terminated with a standard 50Ω load and can be seen to be constant over the calibrated range of 0.1Mc/s and 20Mc/s. The phase in the calibration will swing repeatedly between ±180° indicating the near perfect match between the output impedance of the VNA (50Ω) and the standard 50Ω termination, as expected for a calibration of this type of instrument. M1 confirms the impedance magnitude 50.00Ω and phase -1.19° at 2863kc/s.
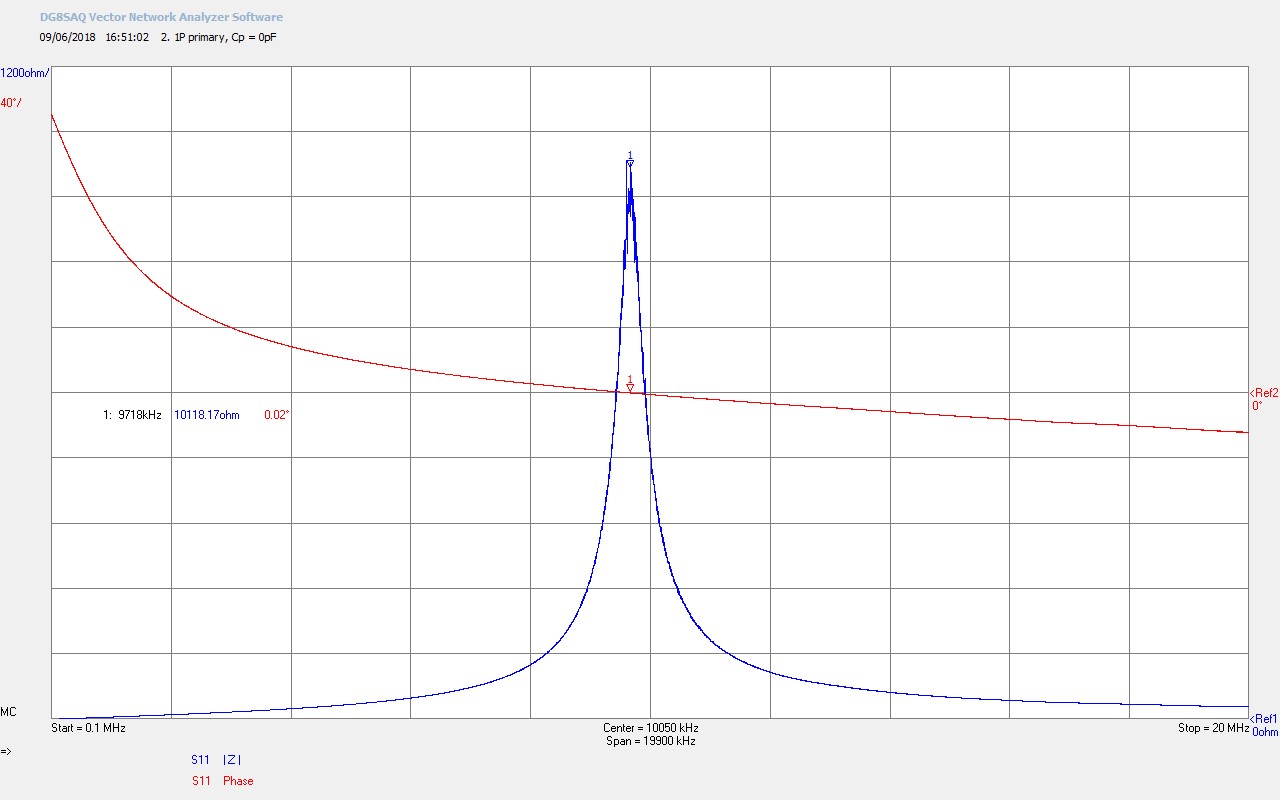
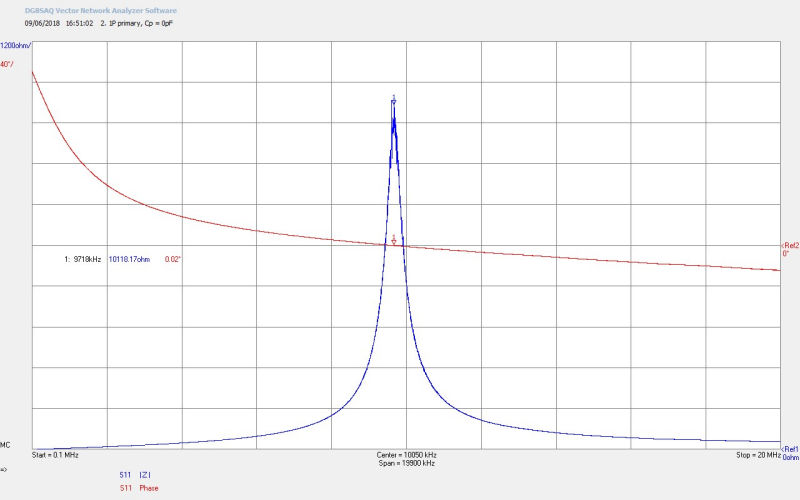
Fig 2.2. Shows the 1P primary with CP=0pF (30.5pF from the self-capacitance of the primary turns and parasitic capacitance combined, CPP). There is a strong parallel self-resonance of the primary coil which results from combination LPCP. From marker M1 the fundamental resonant frequency FP=9718kc/s with the 180° phase change, characteristic of a resonant circuit, shifted to a much higher frequency above the upper limit of the scan (20Mc/s). The large shift between FØ180 and FP results from the large imbalance between the inductance of the coil LP and the very small self-capacitance CP . As CP starts to rise in the following figures FØ180 will start to fall in frequency.
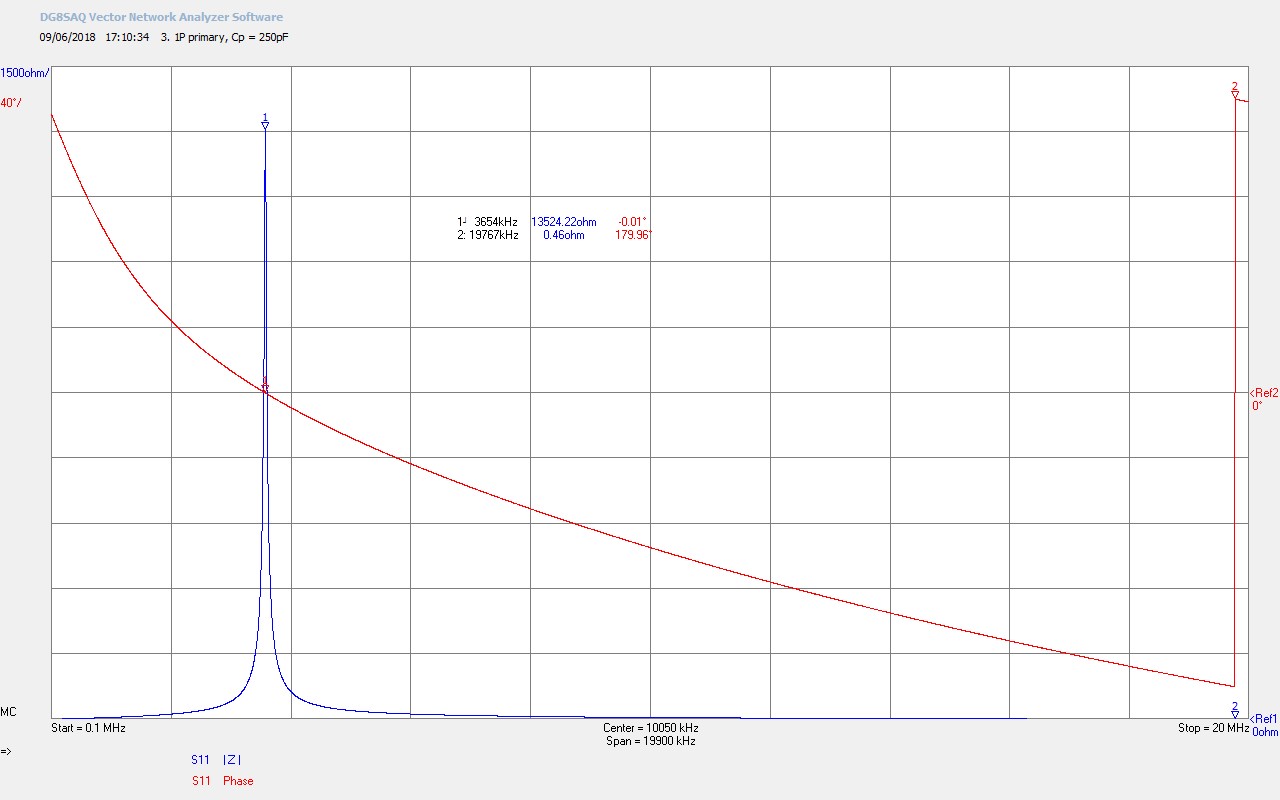
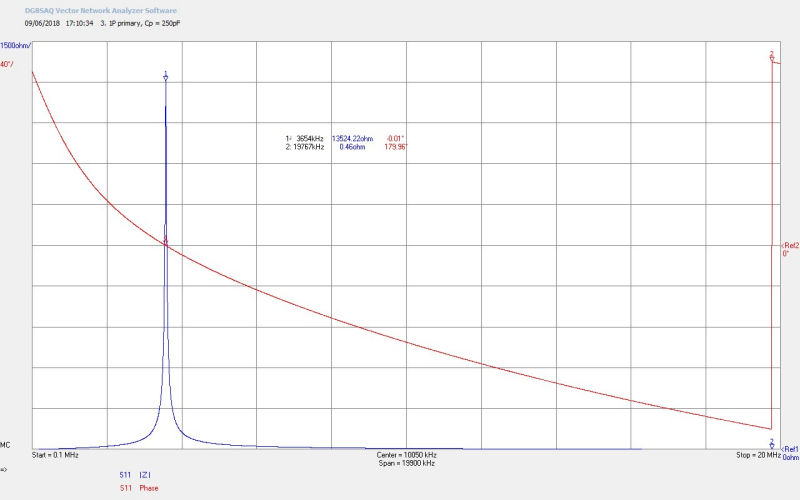
Fig 2.3. Shows the effect of increasing CP=250pF. FP has now dropped considerably to 3654kc/s and FØ180 has just entered at the far end of the scan at 19767kc/s. The magnitude of the impedance has increased as the resonance has strengthened, and the Q of the coil has also increased as lumped element capacitance stabilises the electrical properties of the circuit and dominates over the self-capacitance of the coil.
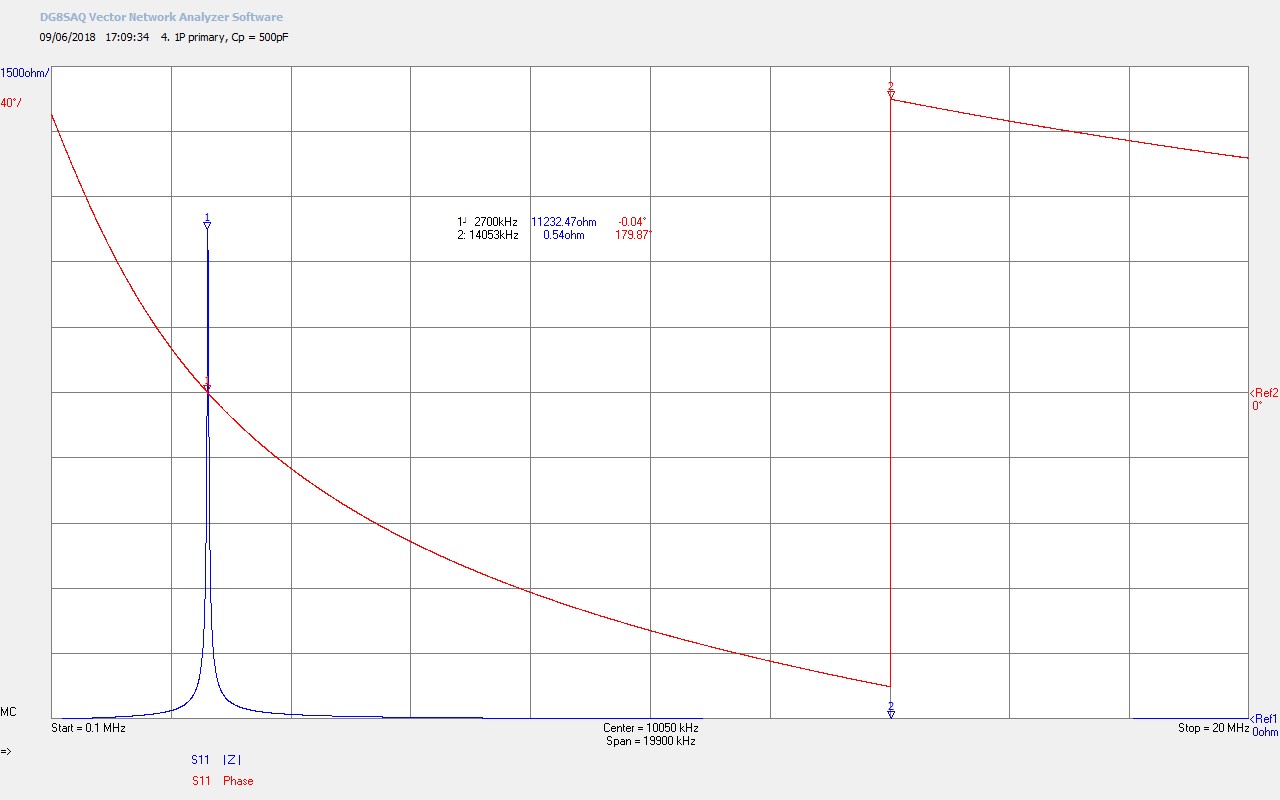
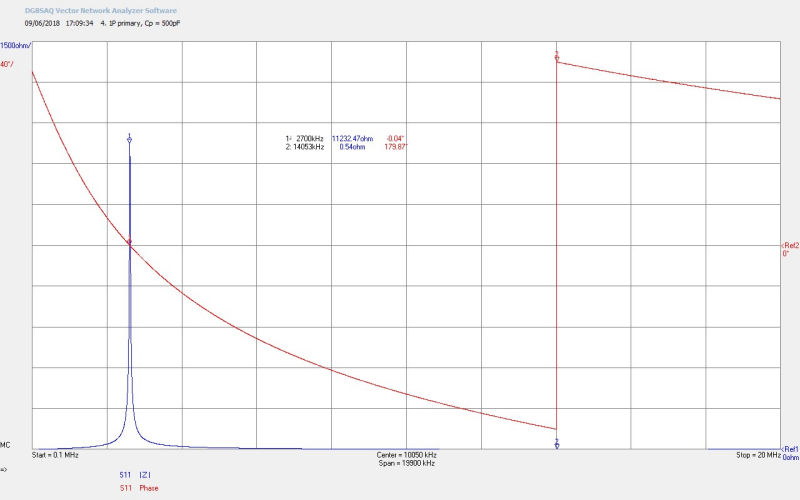
Fig 2.4. Increasing CP=500pF continues to reduce FP and FØ180. The magnitude of the impedance |Z| continues to fall and the Q reduces slightly.
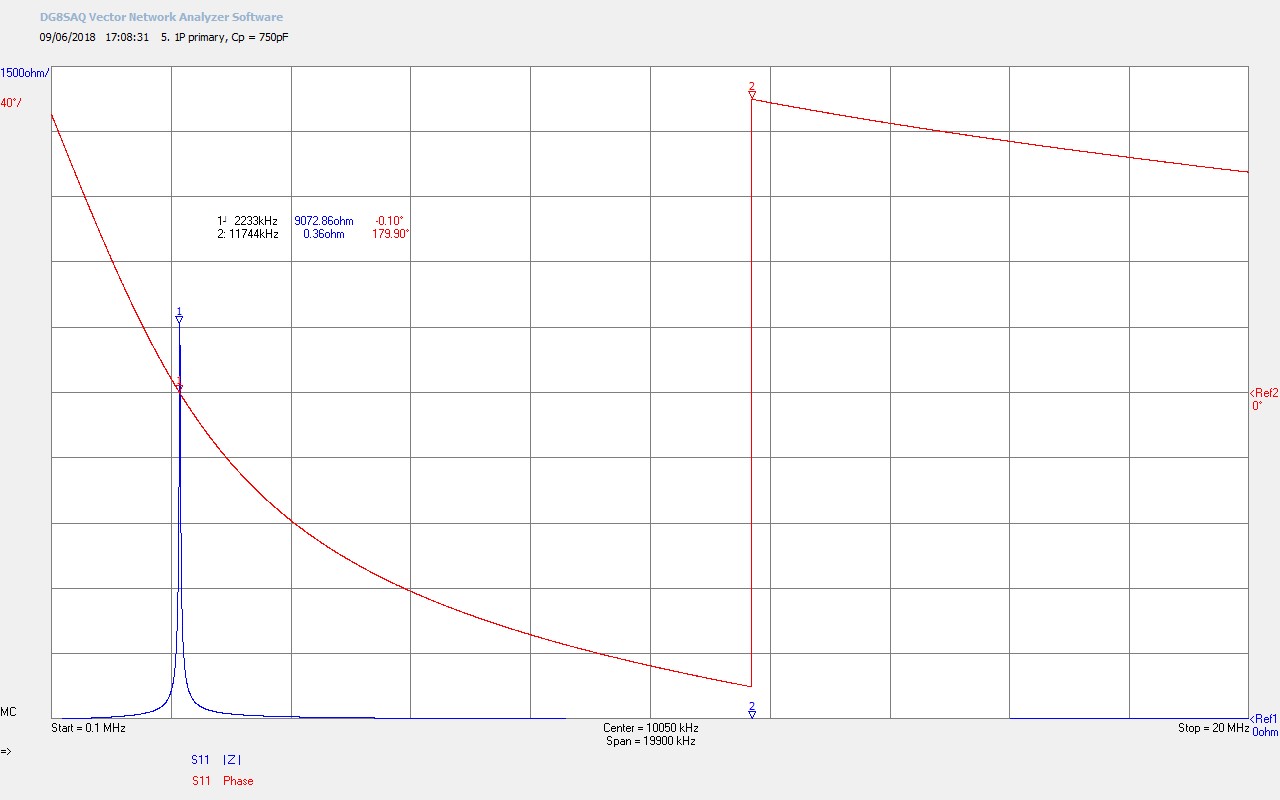
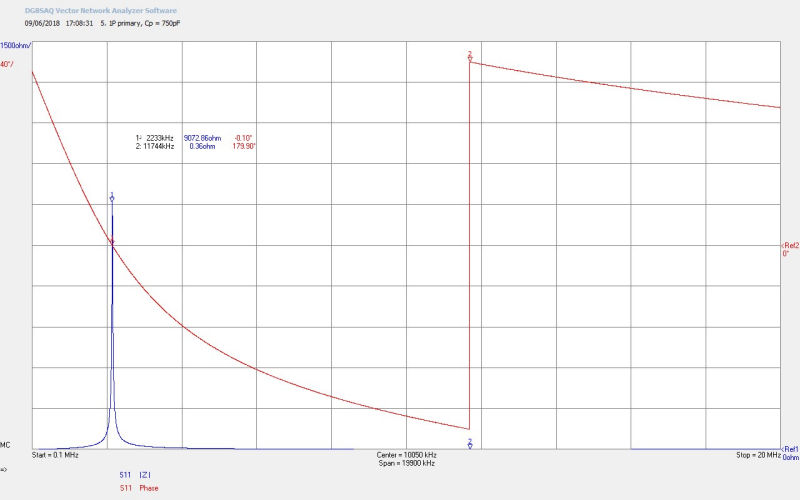
Fig 2.5. Increasing CP=750pF continues to reduce FP and FØ180. |Z| continues to fall as the parallel resonance weakens, and FP passes through what will be FØ180 of the secondary coil when added to the primary.
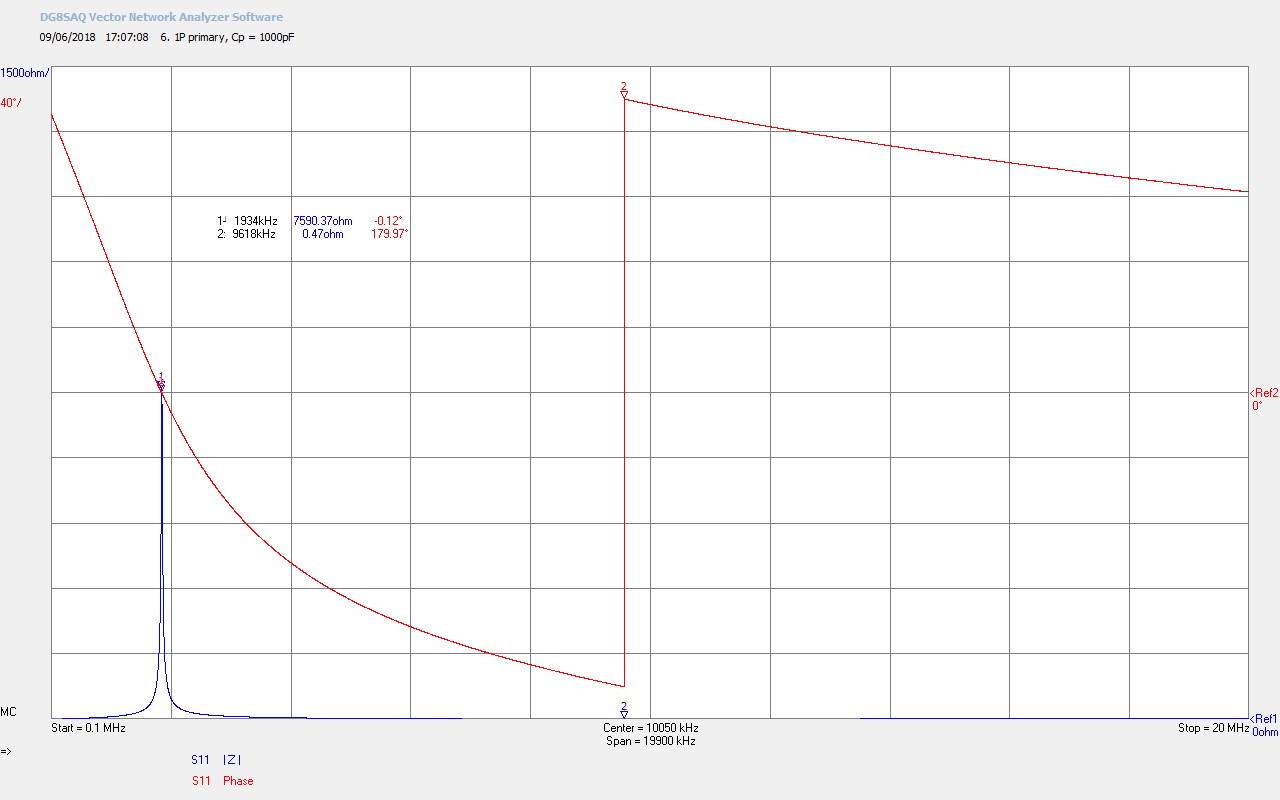
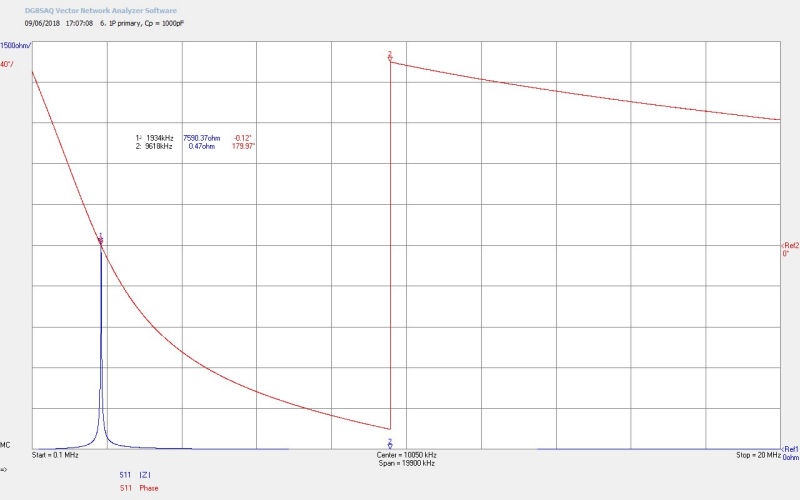
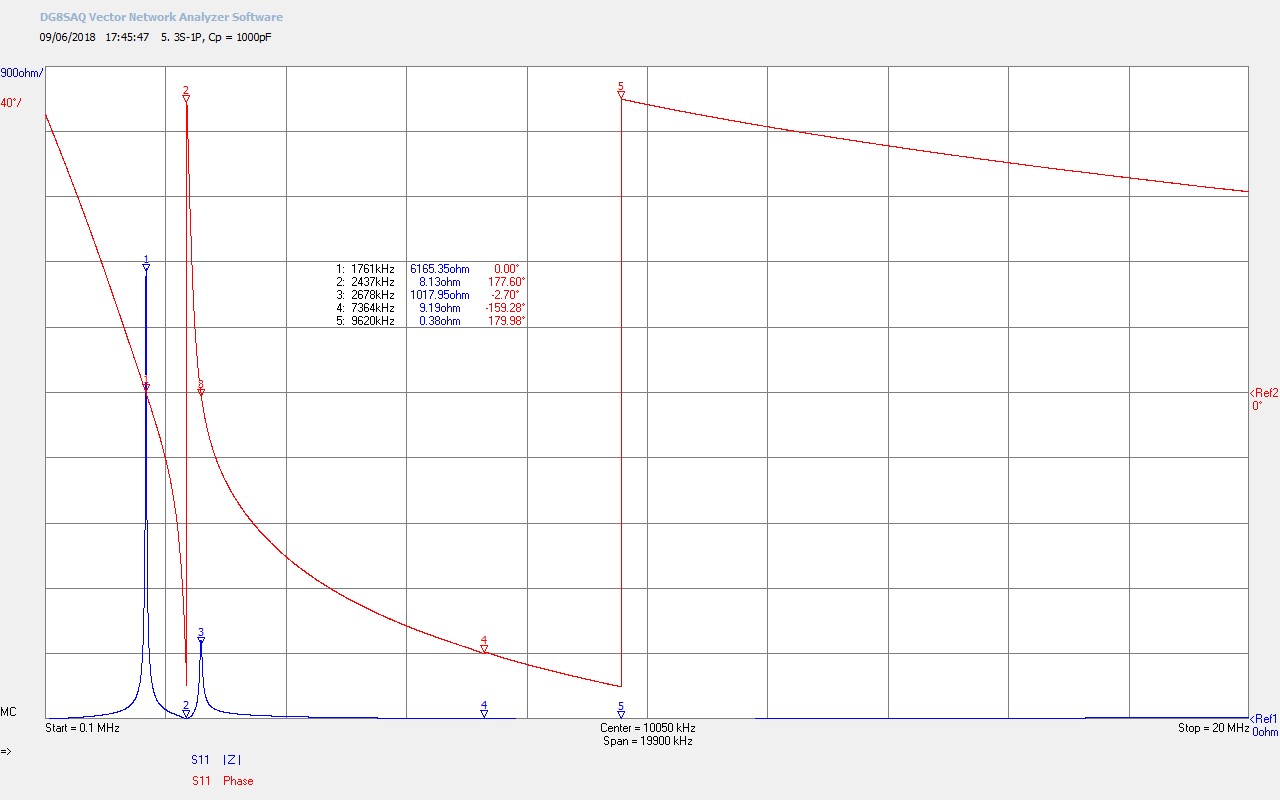
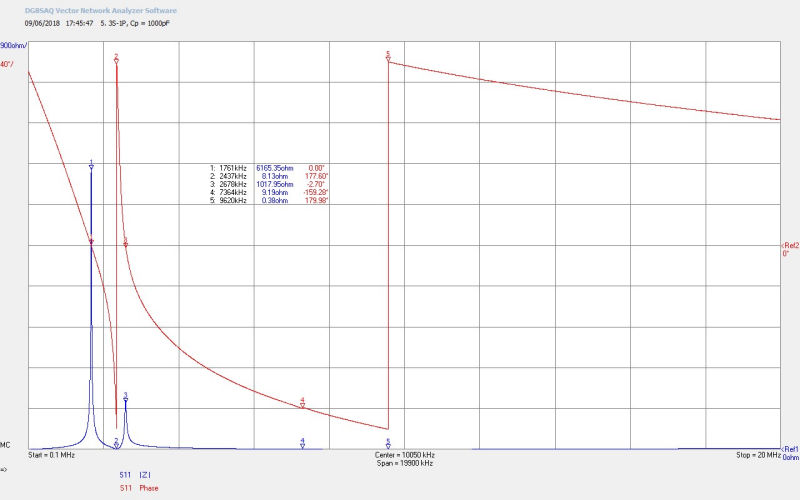
Fig 2.6. Increasing CP=1000pF continues to reduce FP and FØ180. |Z| continues to fall, and FP comes into the fundamental band of operation (1810-2000kc/s).
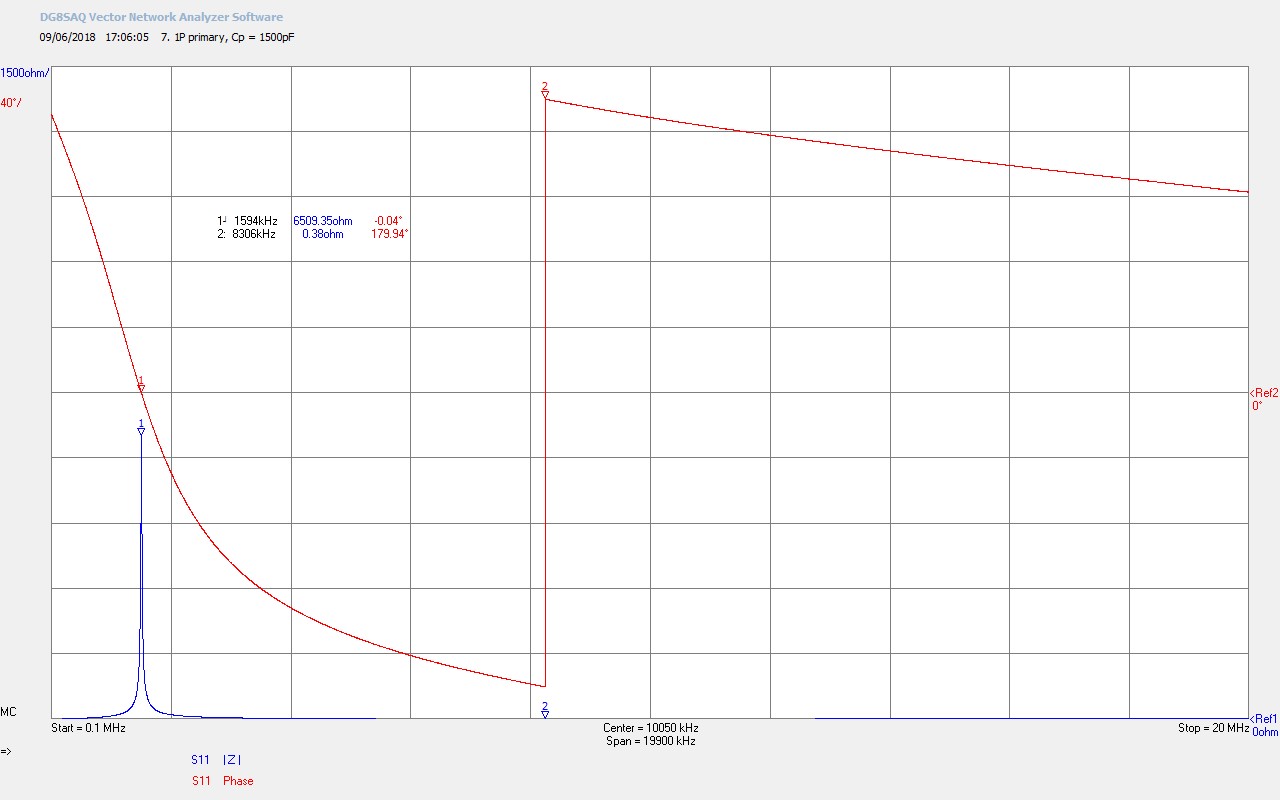
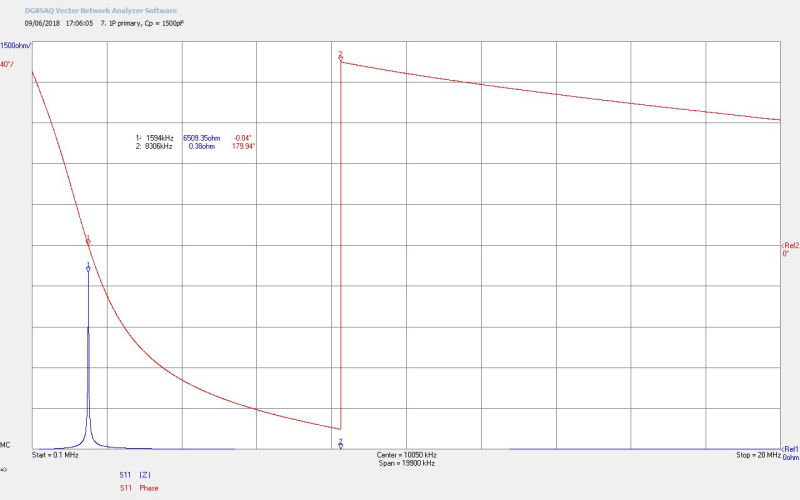
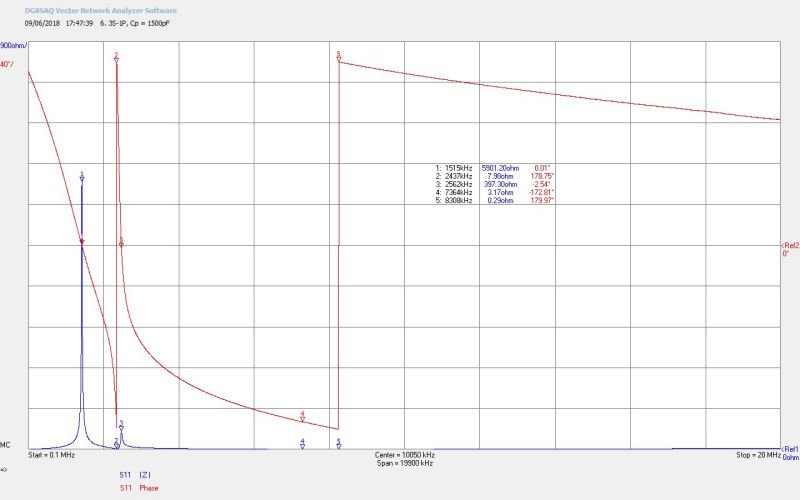
Fig 2.7. Increasing CP=1500pF continues to reduce FP and FØ180. |Z| continues to fall, and FP goes below the fundamental band of operation and into the medium wave (MW) band.
Overall the effect of increasing the primary capacitance CP is to progressively reduce the primary’s fundamental resonant frequency FP. As a better balance between LPCP is established the wide gap between FP and FØ180 reduces. FP appears to go through an optimal point of resonance where the impedance |Z| is maximum and the Q is maximum at a resonant frequency FP ~ 4500kc/s and CP ~ 195pF. The shifting of FP with CP will allow the complete flat coil 3S-1P to be tuned, as the resonant circuit in the primary interacts with the resonant circuit in the secondary. These two coupled resonant circuits form the overall impedance characteristics of the flat coil as investigated below. No harmonics of the fundamental where observed in the impedance scans of the primary.
VNA-SDR Measurements for 3S-1P
Figures 3. show the wide frequency scan VNA impedance results for Z11 with changing load capacitance on the primary.


To view the large images in a new window whilst reading the explanations click on the figure numbers below:
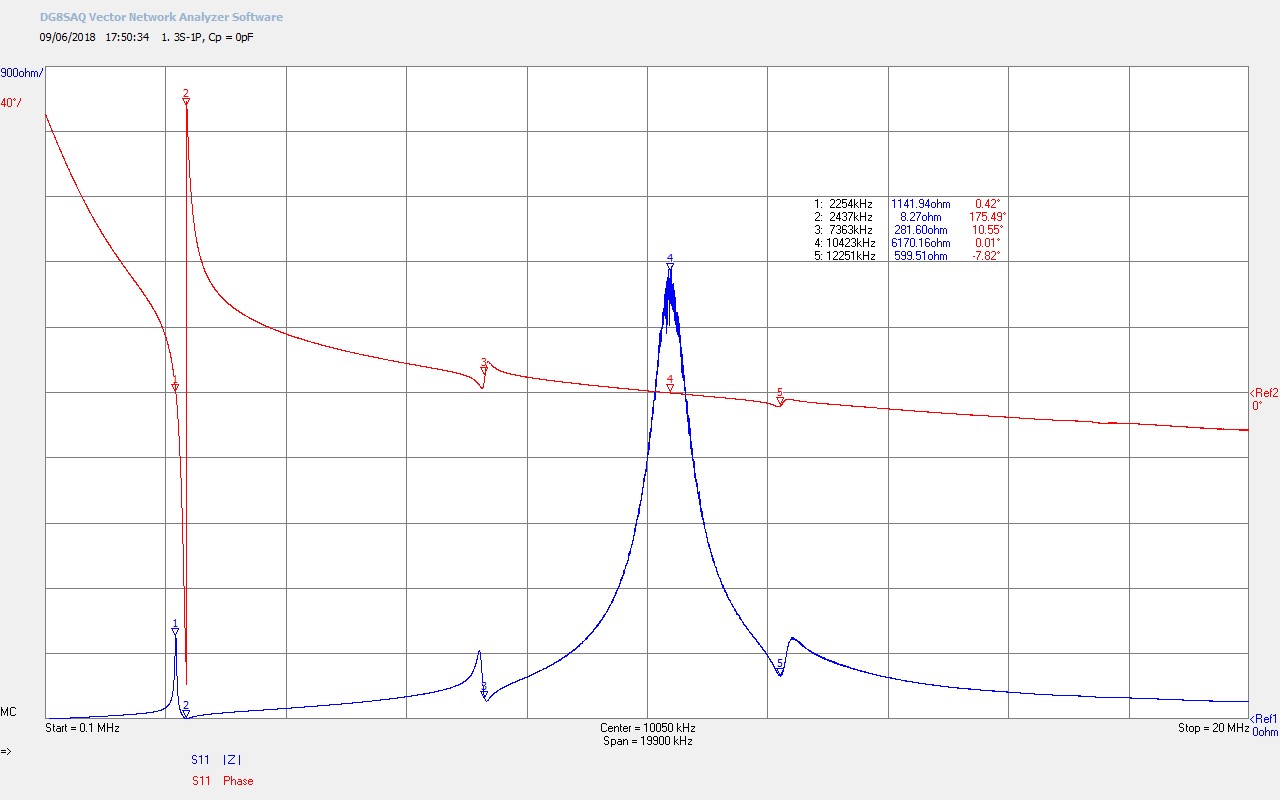
Fig 3.1. Shows the secondary and the primary combined together in frequency and with CP = 0pF. Here the two resonant characteristics appear superimposed on one another. The self-resonance of the primary is very clearly defined at M4, and is very similar to that measured in the primary only results of Fig 2.2. The self-resonance of the secondary has generated the fundamental FS = 2254kc/s at M1 and FØ180 = 2437kc/s at M2. For the secondary FØ180 is defined by the effective wire length used in λ/4 mode with the addition of an impedance lowering extension at the bottom-end of the coil. In Part 1 of the design the wire length was to be arranged to give FØ180 = 2400kc/s which is very close to the result measured. The fundamental operating frequency was designed to fall into the 160m amateur band (1810-2000kc/s), and currently FS = 2254kc/s slightly above this band. In operation CP in the primary will be adjusted in order to tune the resonant operating frequency into the required band. The balance between LSCS is much better in the secondary as the self-capacitance of the many turns is much bigger and more stable than that for the primary, and so the gap between FP and FØ180 is smaller, and in this case also contributed to by the series resistance of the secondary coil. Q appears reasonable at this stage and the impedance |Z| is much lower than that for the primary which most likely results from the inter-winding capacitive network of the secondary. There are 2 odd harmonics above the fundamental FS2 at M3 and FS3 at M5 which occur at 3λ/4 and 5λ/4 respectively. It maybe by chance but it is interesting to note that FP is not that far away from 4λ/4 for the secondary. Whether this will have any impact on the performance of the flat coil remains to be established.
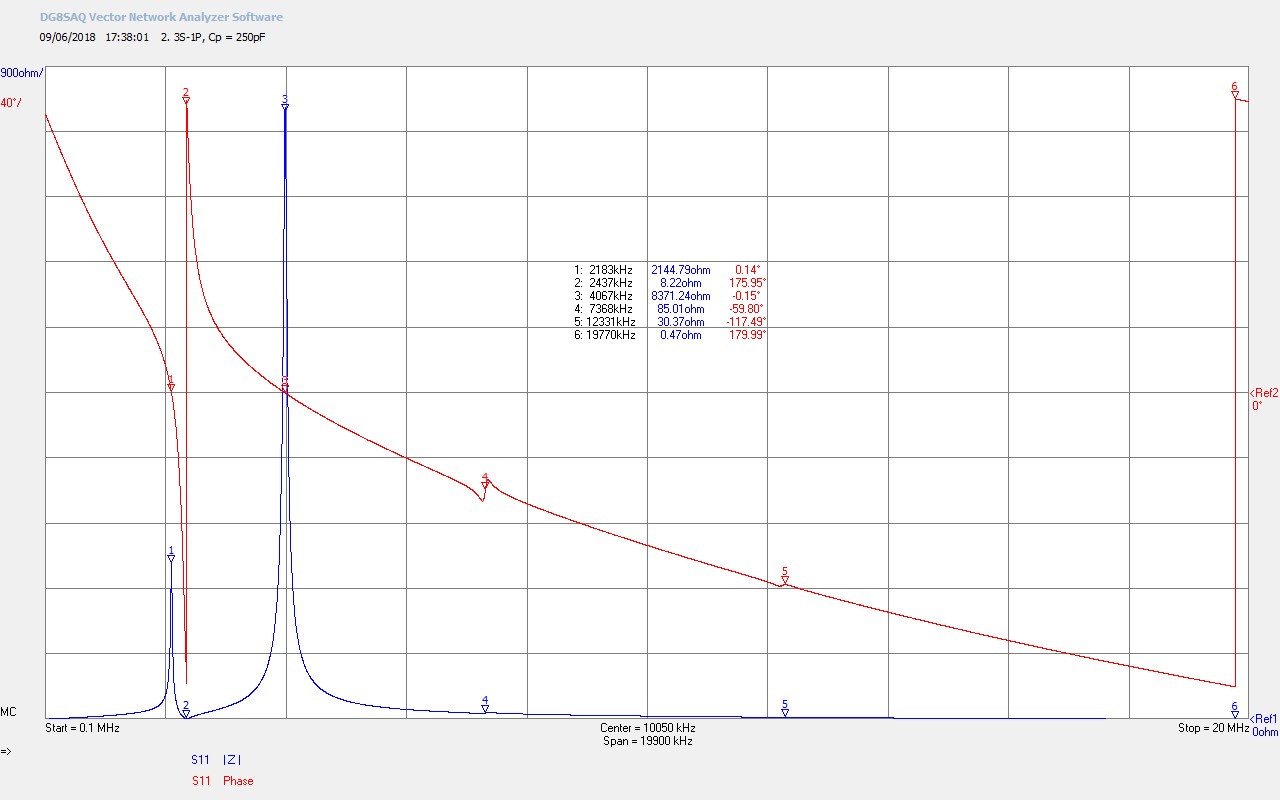
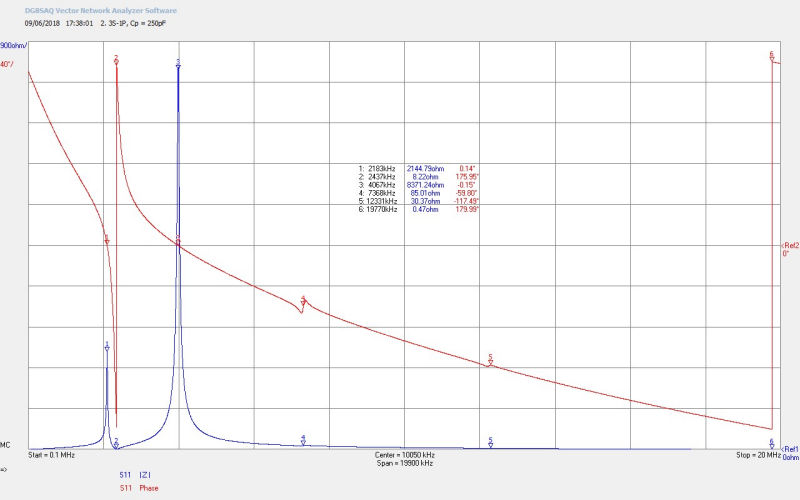
Fig 3.2. Increasing CP = 250pF has mainly, and as expected from figures 1, reduced the primary resonant frequency FP down to a frequency much closer to the secondary. Here we can see the start of the formation of the flat coil upper and lower resonant frequencies. The FØ180 point at M2 stays constant as the effective wire length of the secondary is not changing and dominates the fundamental FS of the secondary. The lower frequency FS at M1 from the secondary forms the lower frequency of the flat coil, and starts to move away from FØ180 as CP is increased, which allows tuning of FS to the required frequency using CP. The upper frequency FP at M3 from the primary forms the upper frequency of the flat coil, and moves progressively down towards FØ180 as CP is increased. As two coupled circuits cannot resonate at exactly the same frequency when CP is continued to be increased > 1000pF FS and FP will appear to swap position, with FP emerging below FS and whilst close to FS appearing to push FS slightly above FØ180. When two or more coupled resonant circuits interact the energy exchange between the modes of vibration creates beating and a particular mode becomes dominant (drives) coupling energy from one resonant circuit to the other. It is in this region that the flat coil is most interesting to investigate, and an important factor in the study of the displacement and transference of electric power. These coupled modes of FP and FS will be investigated in more detail on Figures 4., and practically within the experiments.
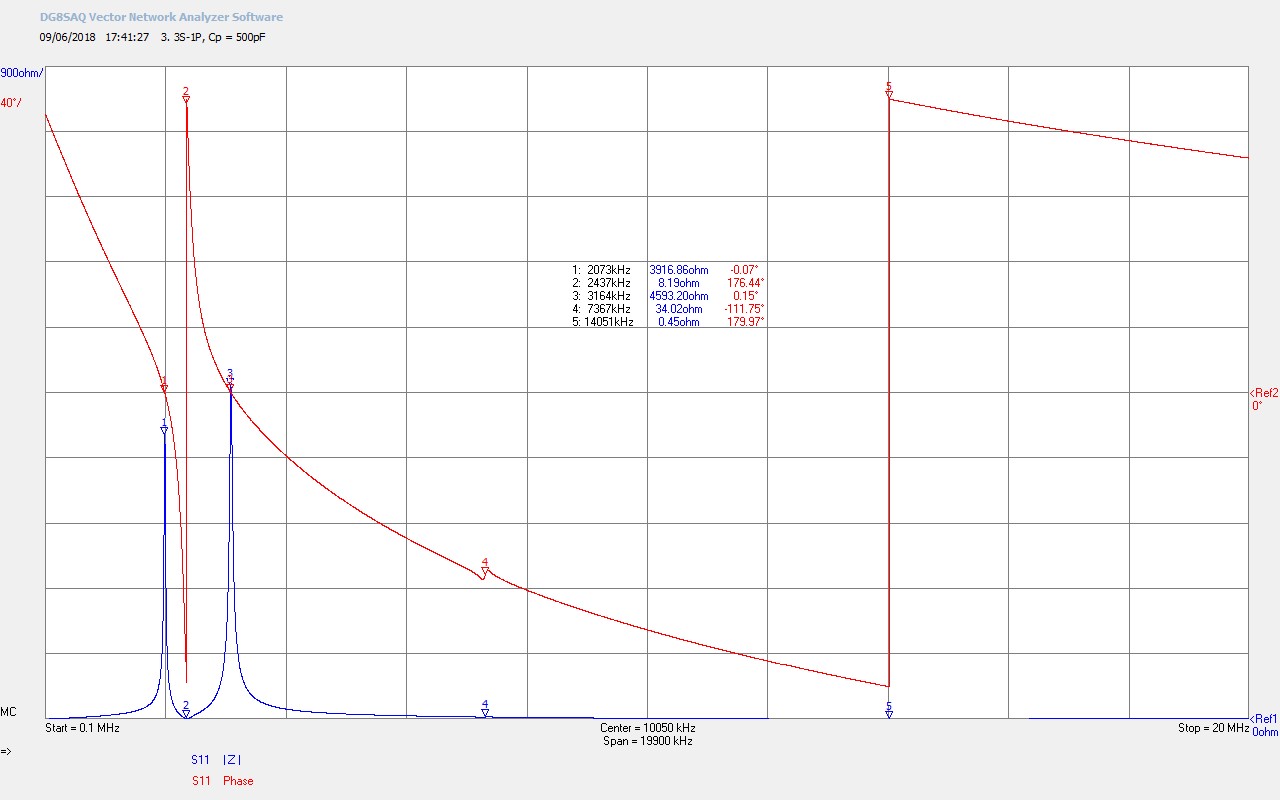
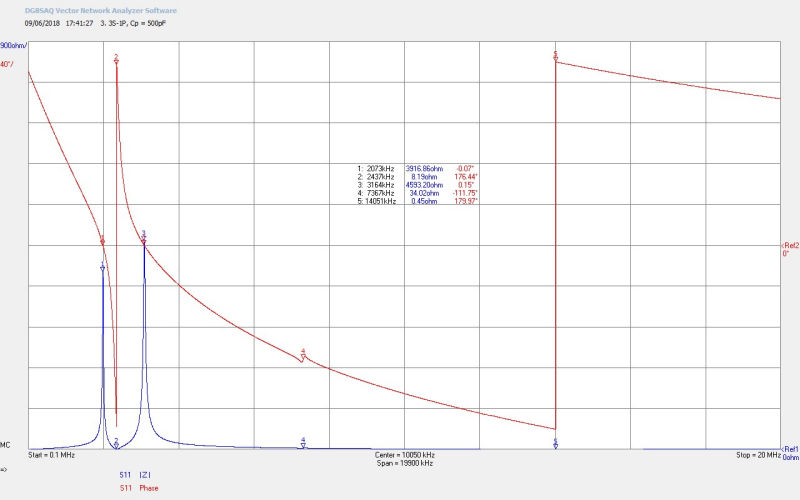
Fig 3.3. Increasing CP=500pF starts to bring the upper and lower frequencies of the flat coil into closer balance. |ZS| at M1 is increasing in impedance as the parallel resonance in the secondary is strengthened by coupling from the primary, whilst |ZP| at M3 is reducing. The overall effect is to bring the electric and magnetic fields of induction, across the primary and the secondary, towards a more balanced point. It is this point of balance (harmony between the two induction fields) that is conjectured to be the optimal point to trigger a non-linear event. It is conjectured that a non-linear event at this point of balance, and dependent on the form of the load connected, will generate a coherent displacement event between the generator (source) and the load(s). This consideration will be developed further during the experimental reporting, and in conjunction with actual results obtained.
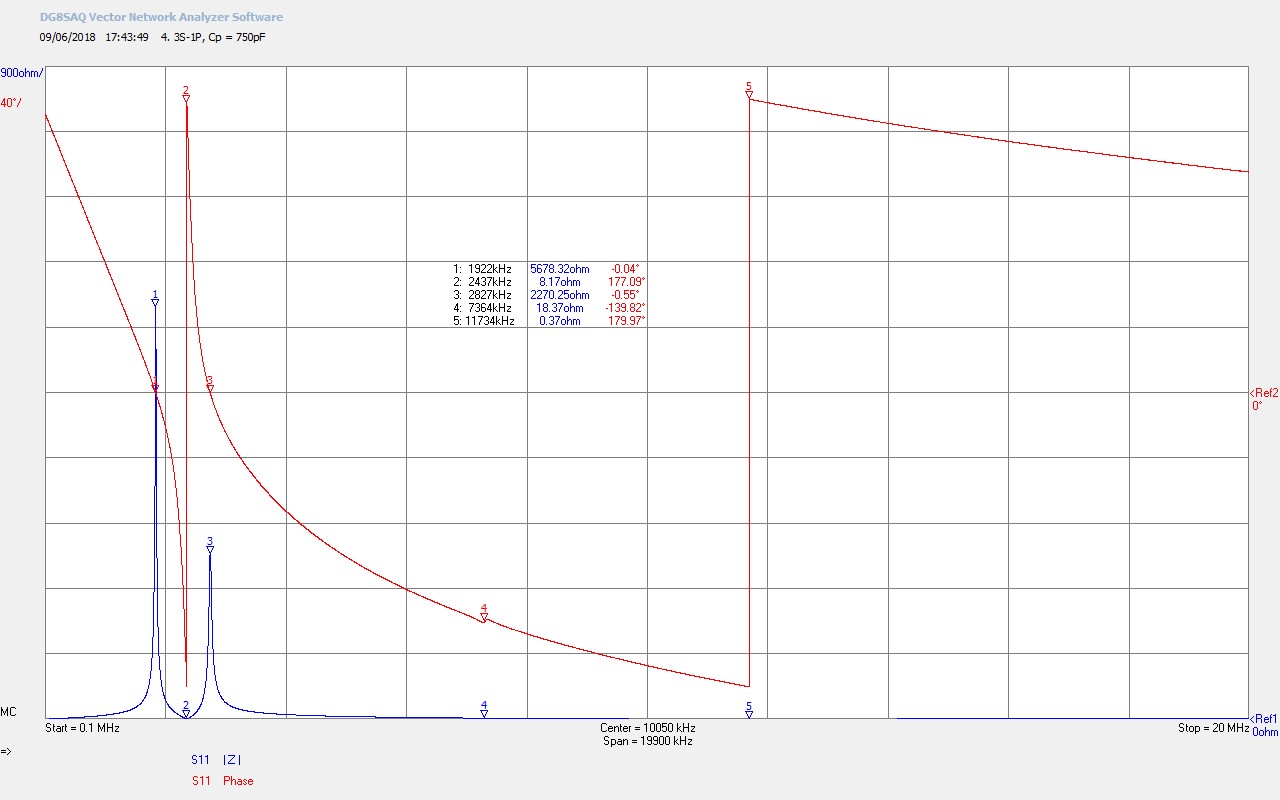
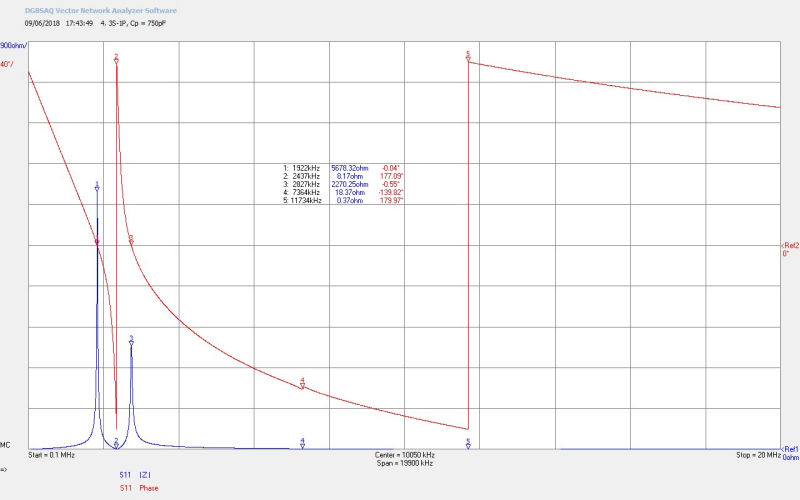
Fig 3.4. Increasing CP=750pF has now passed through the balance point between the fields of induction and to where the lower frequency starts to dominate the resonance of the flat coil, and the upper frequency will now continue to diminish. The lower frequency FS at M1 is now within the 160m of operation. FØ180 remains unchanged. Harmonics are diminishing as the resonance of the secondary starts to be suppressed by the high capacitive loading of the primary.
Fig 3.5. Increasing CP=1000pF the primary resonance FP is dominating the overall resonance at the lower frequency of the flat coil. Secondary coil harmonics have almost completely been suppressed by the high capacitive loading of CP. The lower resonant frequency at M1 has now moved out of the lower end of the 160m amateur band.
Fig 3.6. Increasing CP=1500pF the primary resonance FP is now totally dominating the overall resonance at the lower frequency of the flat coil. The lower resonant frequency at M1 has now moved into the medium wave band at 1515kc/s.
When CP is lower, and in the range ~200 – 450pF, the overall resonance of the flat coil is dominated by FP the fundamental resonant frequency of the primary, and what has formed the upper resonant frequency of the flat coil ~ 2700kc/s – 4500kc/s. When CP is larger, and >950pF, the overall resonance of the flat coil is again dominated by FP the fundamental resonant frequency of the primary at the lower resonant frequency of the flat coil < 1750kc/s. In between, in the range 450pF < CP < 950pF, there is a more established balance between FS and FP and the upper and lower resonant frequencies of the flat coil are determined by the interaction and energetic exchange between the secondary and the primary. It is this region that is most interesting to experiments in the displacement and transference of electric power, and whose impedance characteristics are investigated in more detail below.
Figures 4. show the narrow frequency scan VNA impedance results for Z11 at a key set of different load capacitance.
To view the large images in a new window whilst reading the explanations click on the figure numbers below:
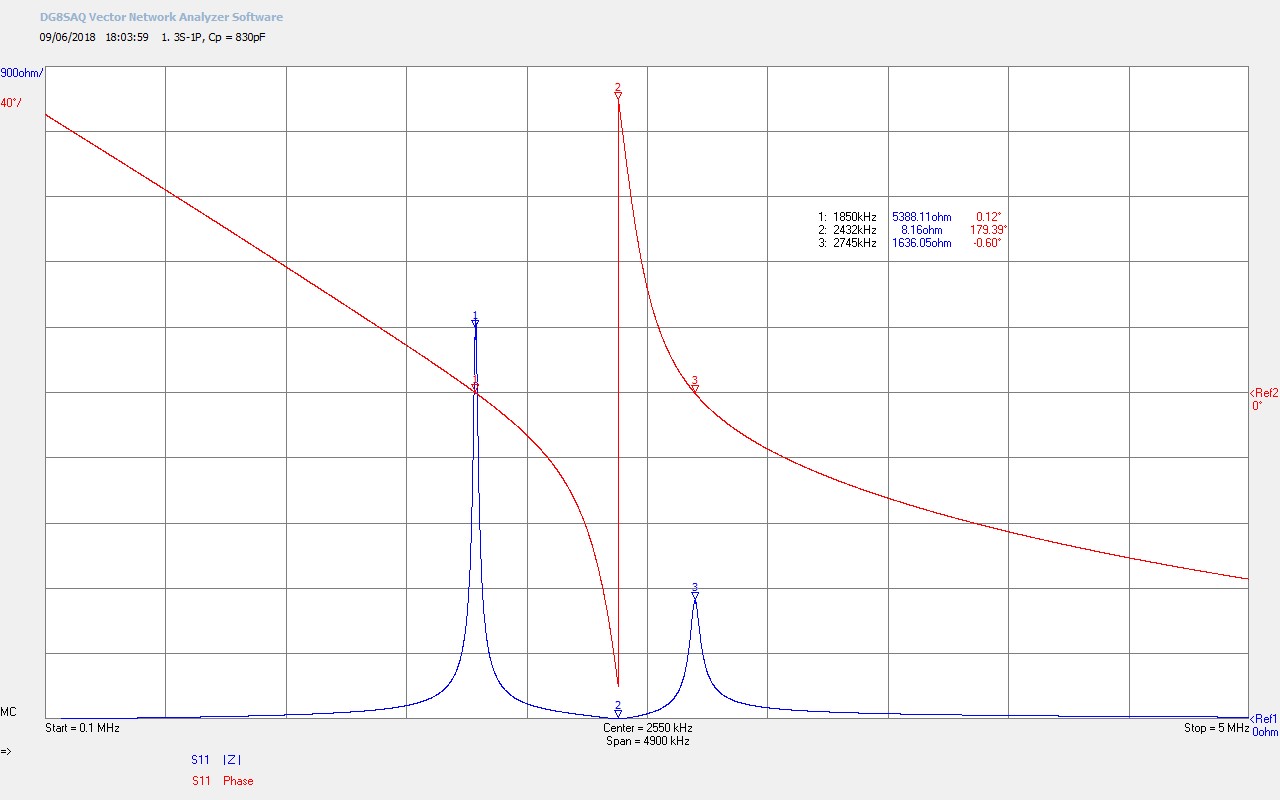
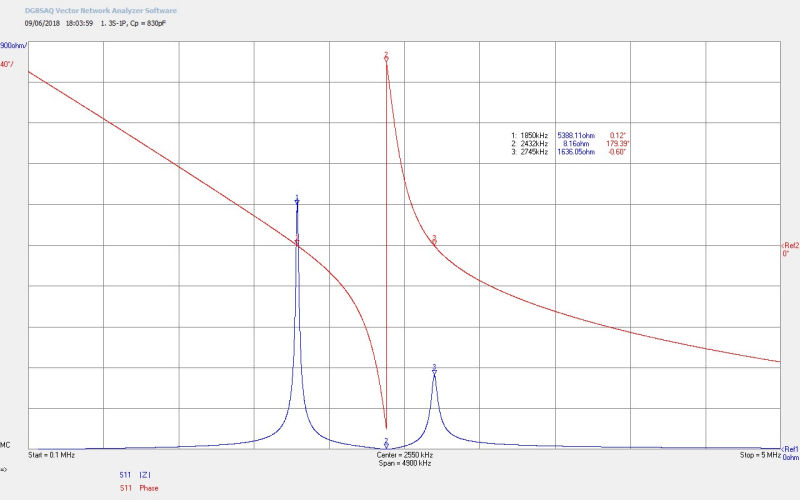
Fig 4.1. Here the primary capacitance CP = 830pF has been adjusted so that the lower resonant frequency of the flat coil FL at M1 is at the nominal designed point of 1850kc/s in the 160m amateur band. When setup to self-resonate with feedback from the flat coil to the generator the flat coil will stably oscillate at FL, and will form a base starting point for the experiments in the displacement and transference of electric power.
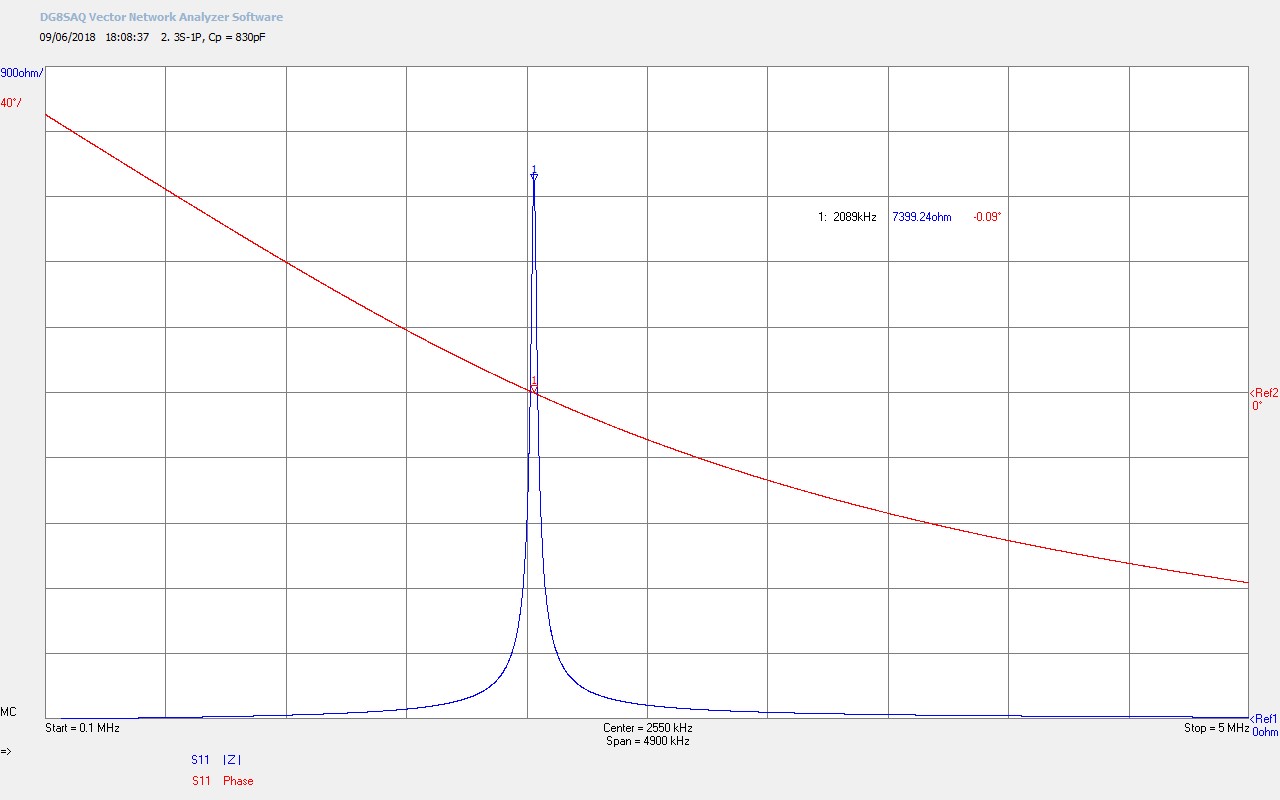
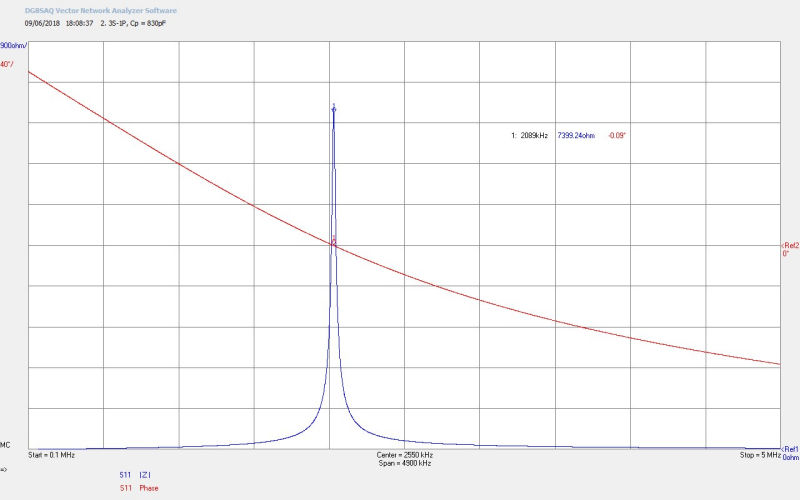
Fig 4.2. Shows the resonant frequency of the primary FP when the secondary is removed from the flat coil, and all other conditions and setup are kept the same. FP is closer to the lower resonant frequency of the flat coil FL than the upper FU, which corresponds with a stronger resonance at FL, and a weaker one at FU, and hence |ZL| > |ZU|.
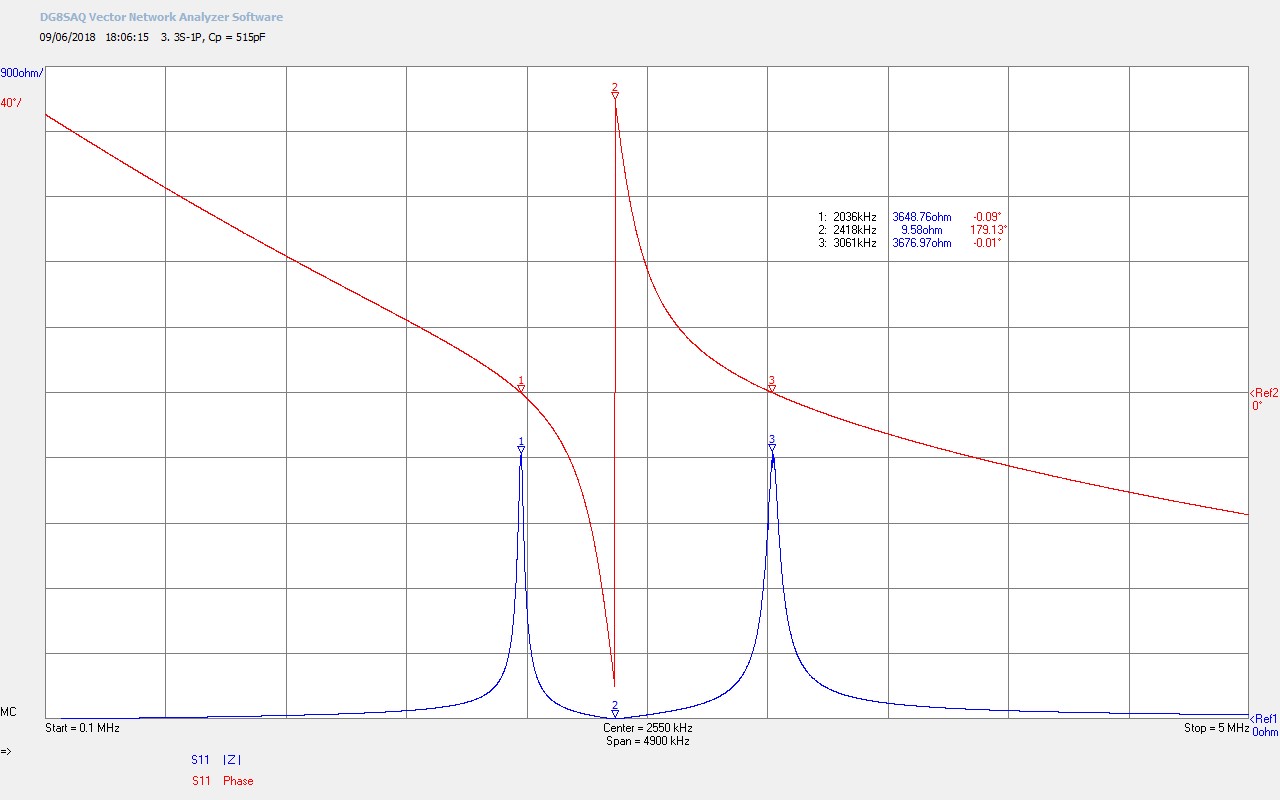
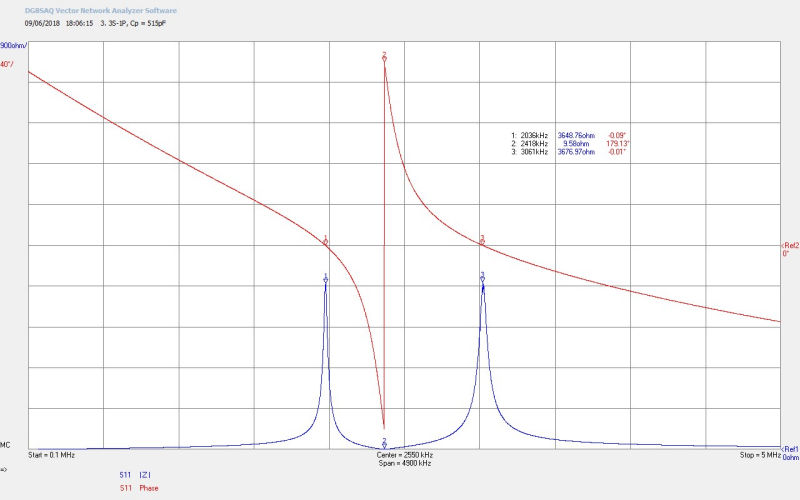
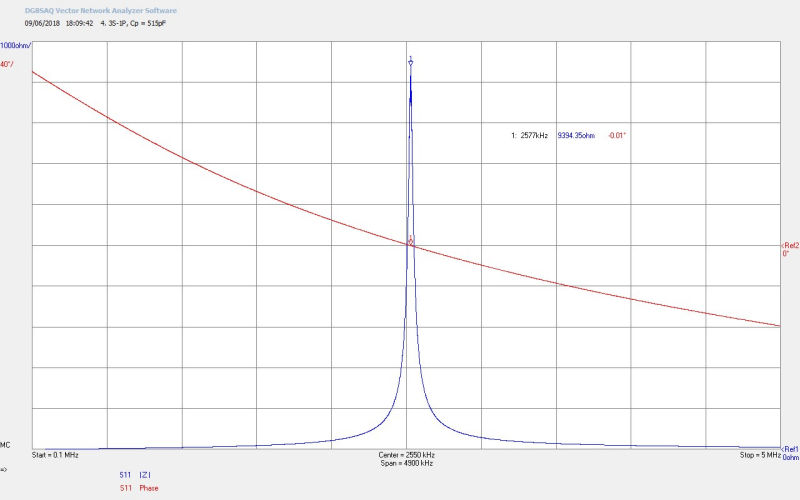
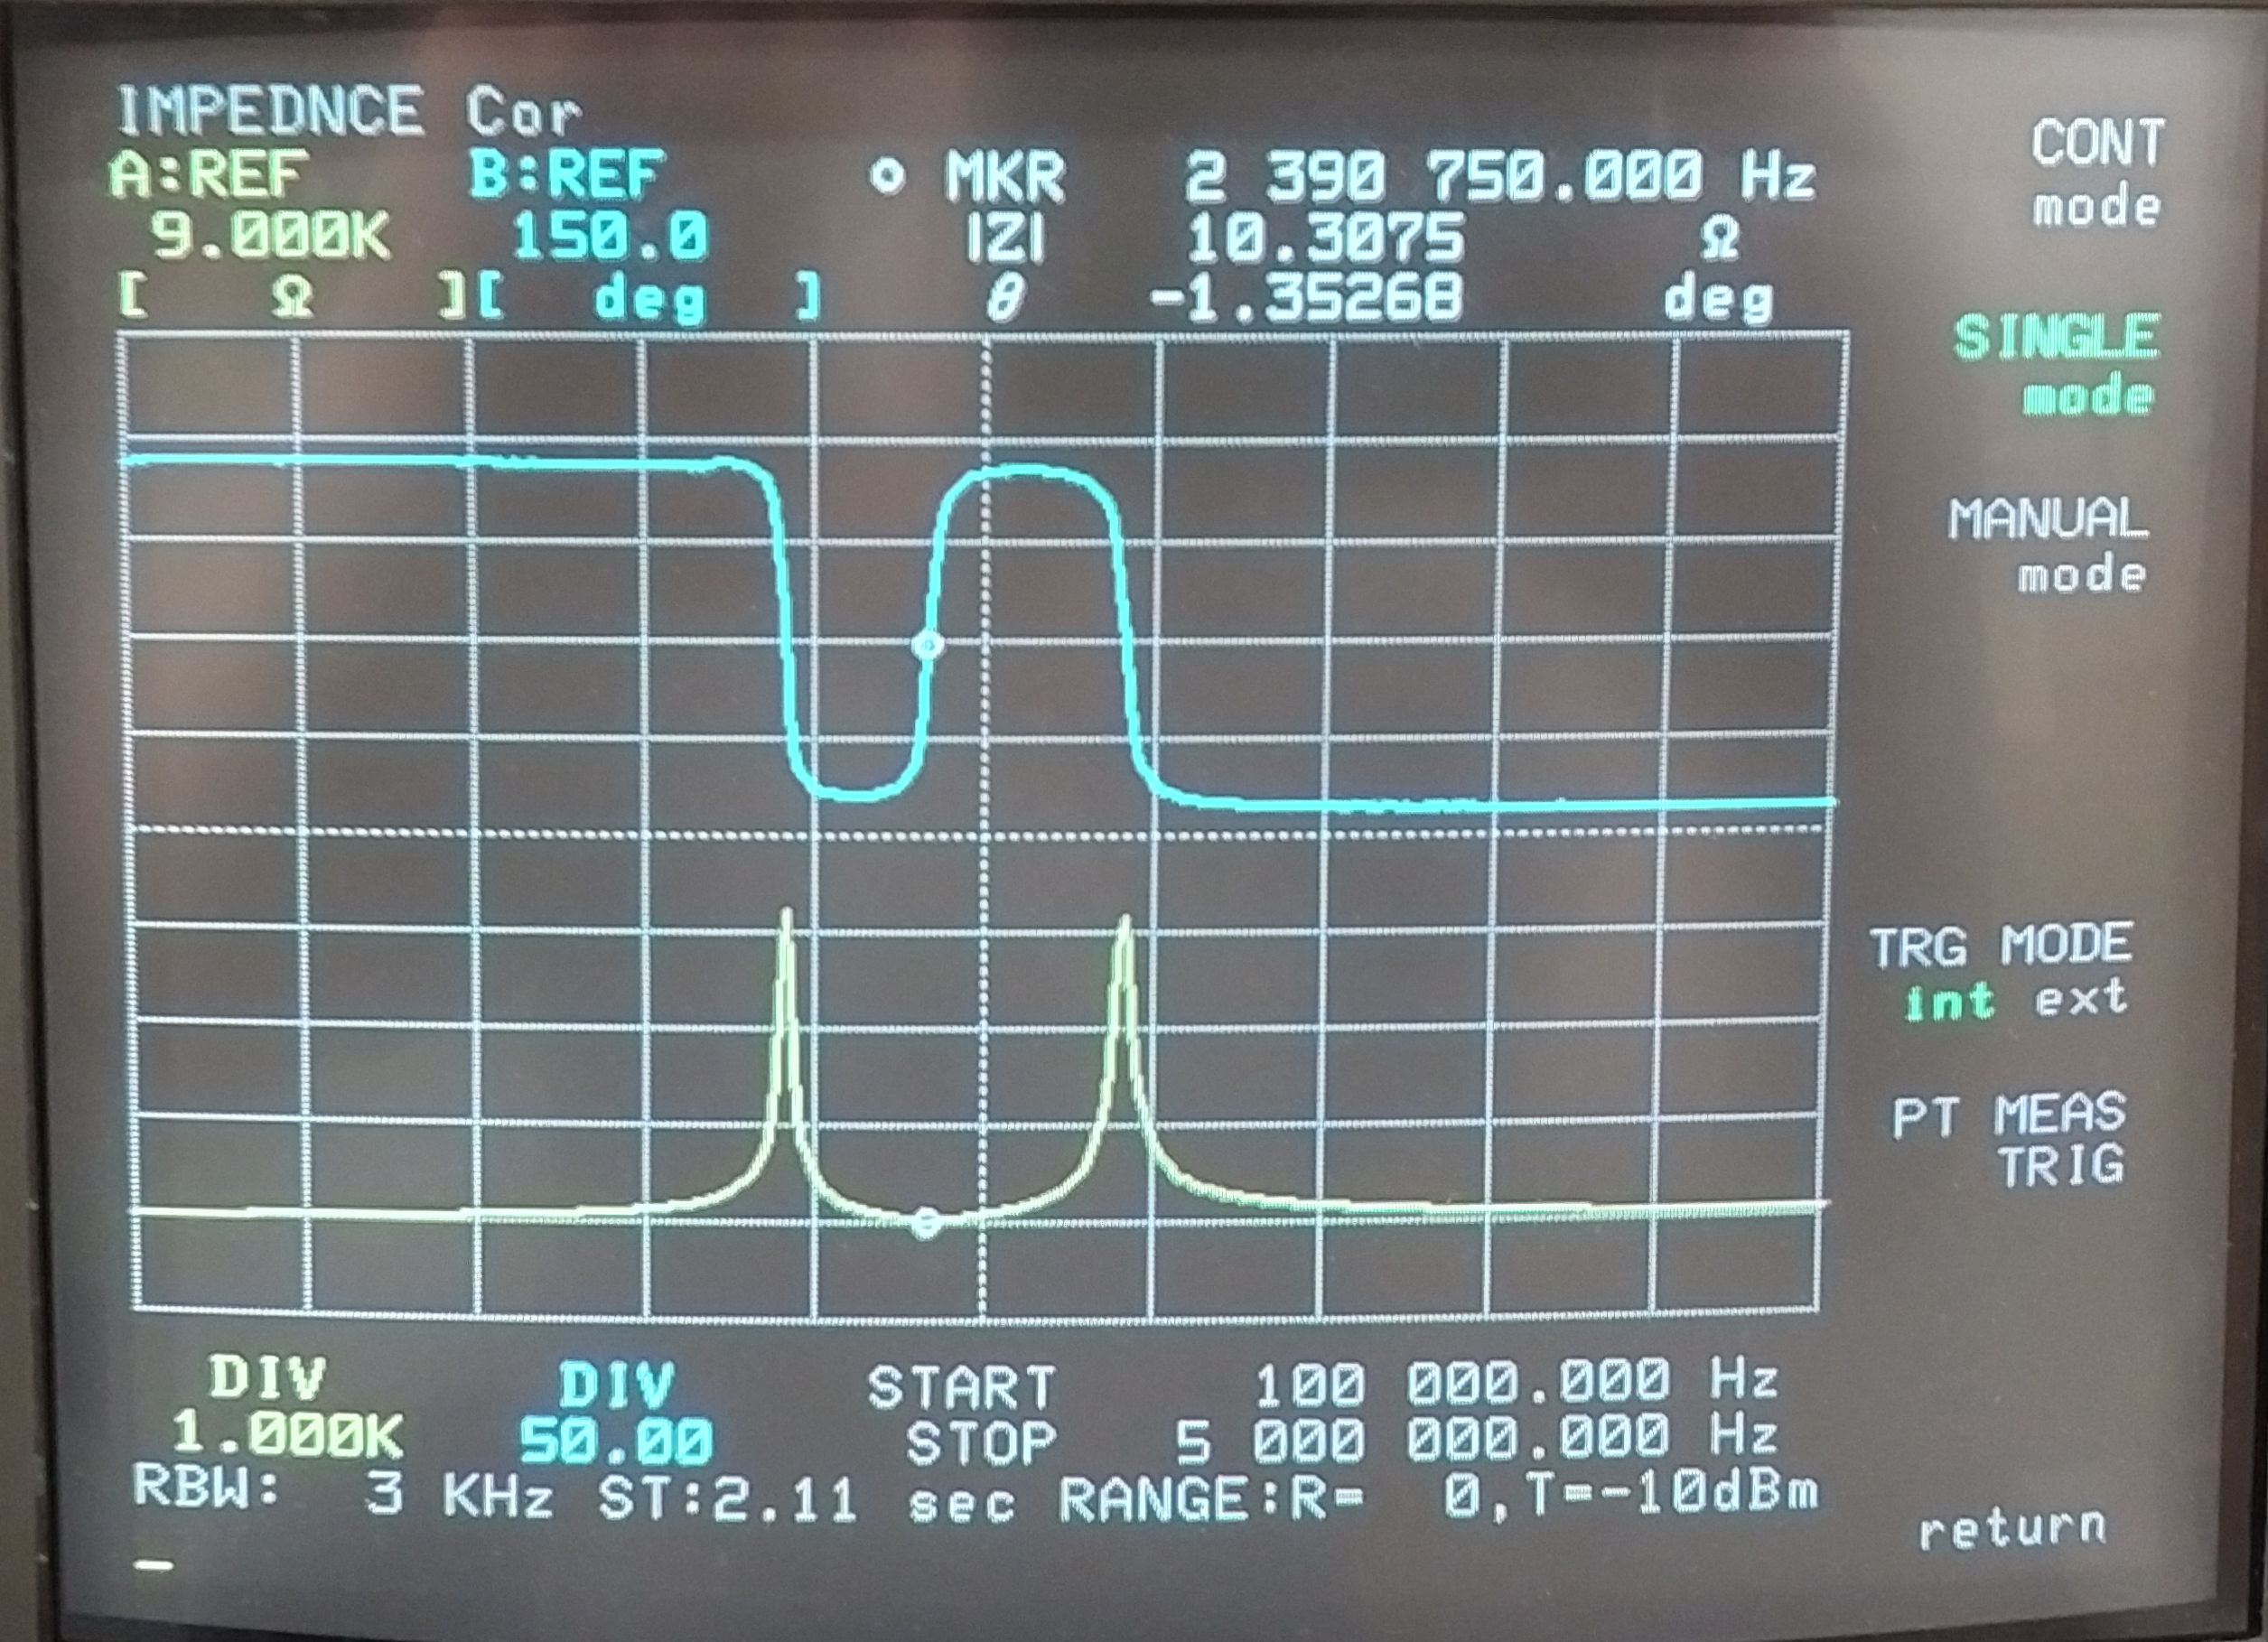
Fig 4.3. Here the primary capacitance CP = 515pF has been adjusted so that the magnitude of the impedance at the upper resonant frequency is equal to the magnitude of the impedance at the lower resonant frequency |ZU| = |ZL|. It is conjectured that at this point there is balanced interaction between the secondary and primary resonance points which is optimal for the balanced energetic inter-exchange between the electric and magnetic fields of induction between the two coils. It is at this point where best coherence between the two fields of induction can be established, and hence a significant pre-condition to displacement established. It is also conjectured that the initiation of a displacement event requires a non-linear trigger within the system being tested whether that originates from the generator, the coils, or is stimulated as a response (pulled by) the load. It is the purpose of the experimental measurements to establish if this or another mechanism is the case, and the properties and characteristics under which they occur.
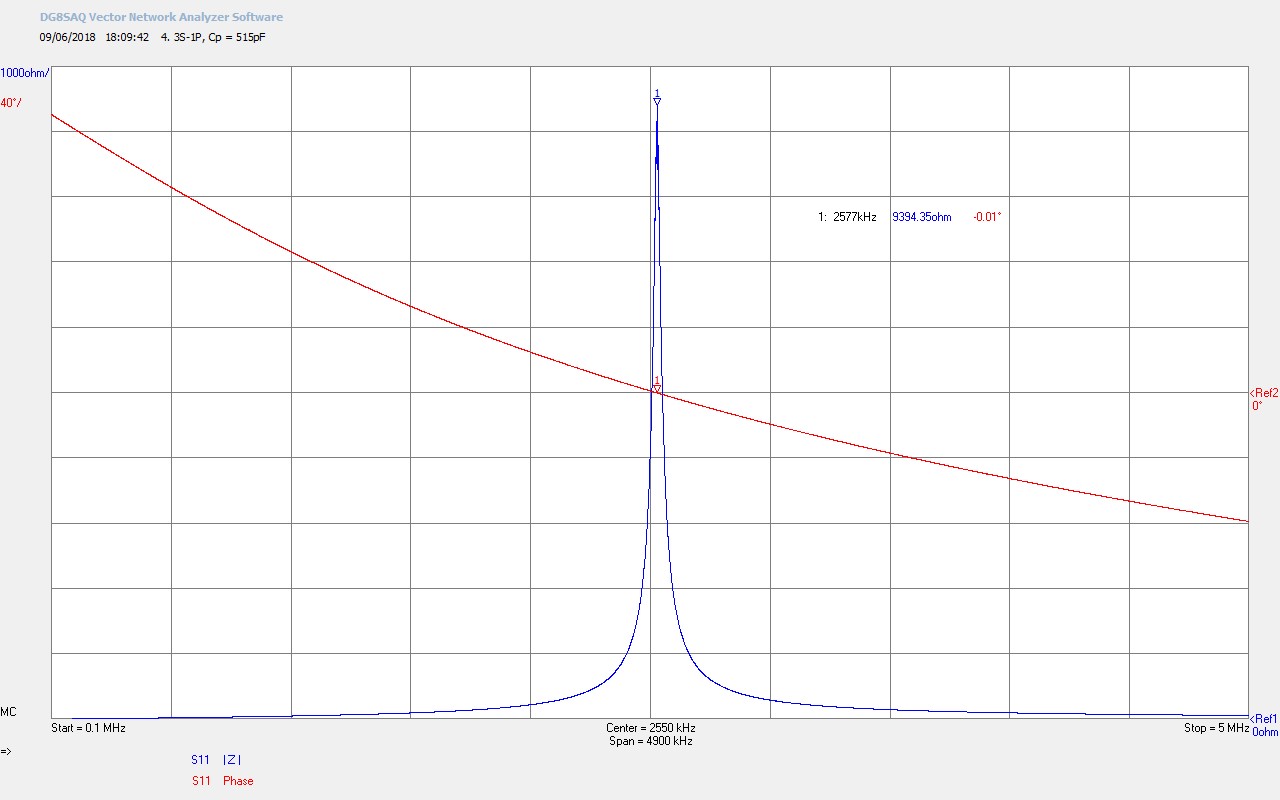
Fig 4.4. Again shows the resonant frequency of the primary FP when the secondary is removed from the flat coil, and all other conditions and setup are kept the same. Here we can see that FP at M1 (2577kc/s) occurs almost exactly equi-distant between FS and FP with the secondary added to the flat coil. From Fig. 4.1. (FP – FS) / 2 + FS = 2548.5kc/s, and from Fig. 4.2. FP = 2577kc/s (<2% difference). Here the resonance of the primary FP has inter-acted with the resonance of the FS so that both contribute equally to the overall flat-coil characteristic and hence establishing the balance between the electric and magnetic fields of induction as discussed in Fig. 4.1.
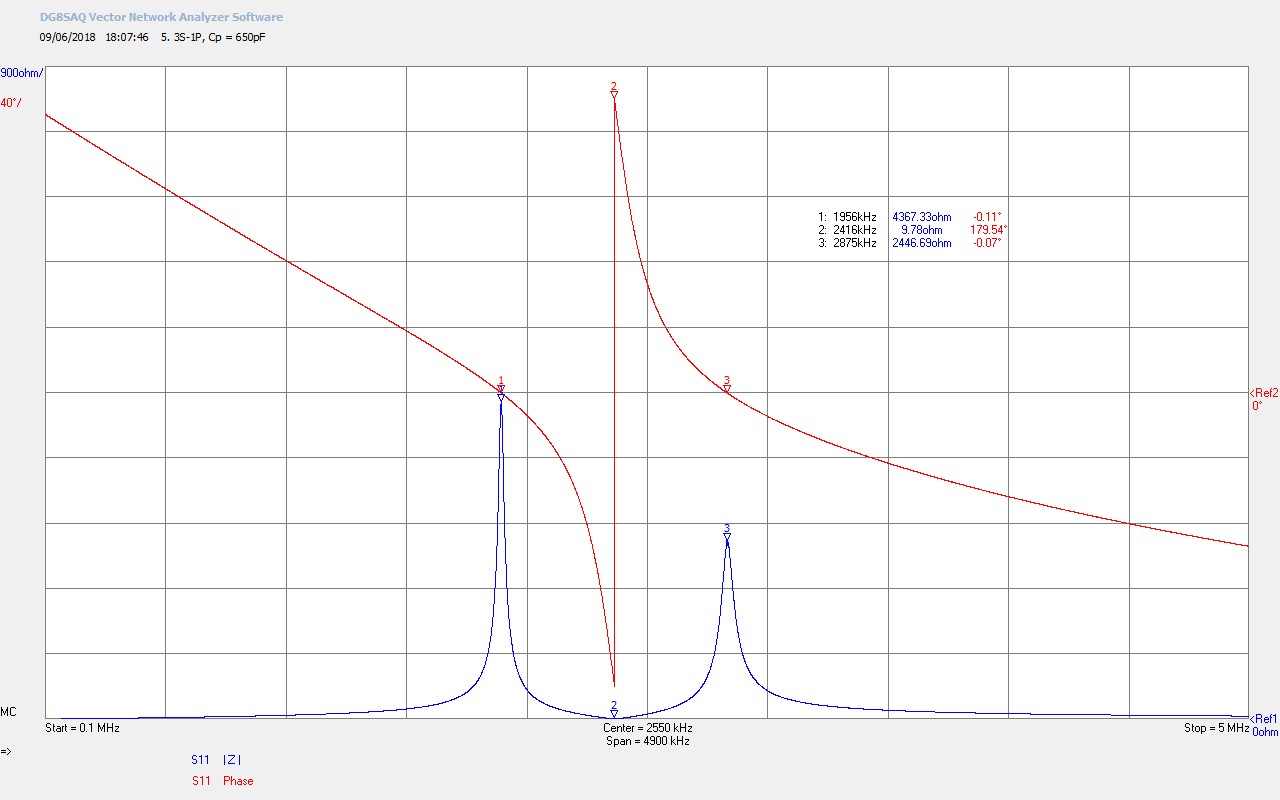
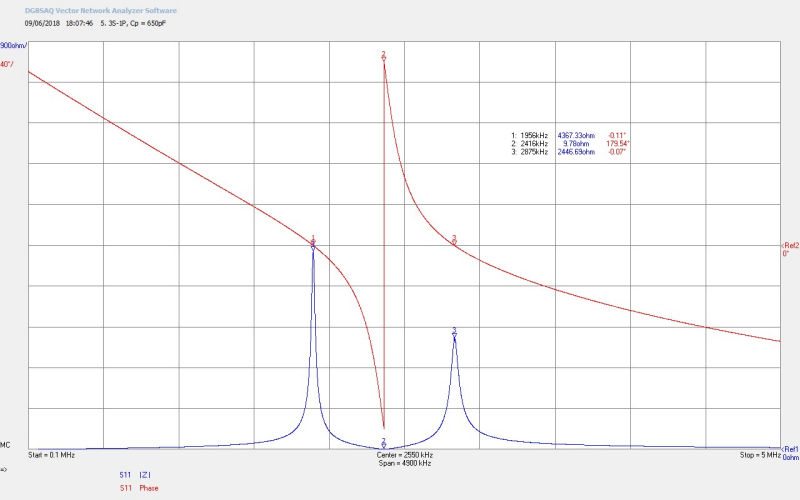
Fig 4.5. Here the primary capacitance CP = 650pF has been adjusted so that the upper FU and lower FL resonant frequencies of the flat-coil are equi-distant from the 180° phase change frequency of the secondary, FØ180. The resonant frequency of the secondary FS (FL) has just moved into the 160m amateur band at 1956kc/s, and |ZS| wil start to dominate the resonance of the flat coil. When allowed to self-resonate with feedback to the generator the flat coil will stably oscillate at FS.
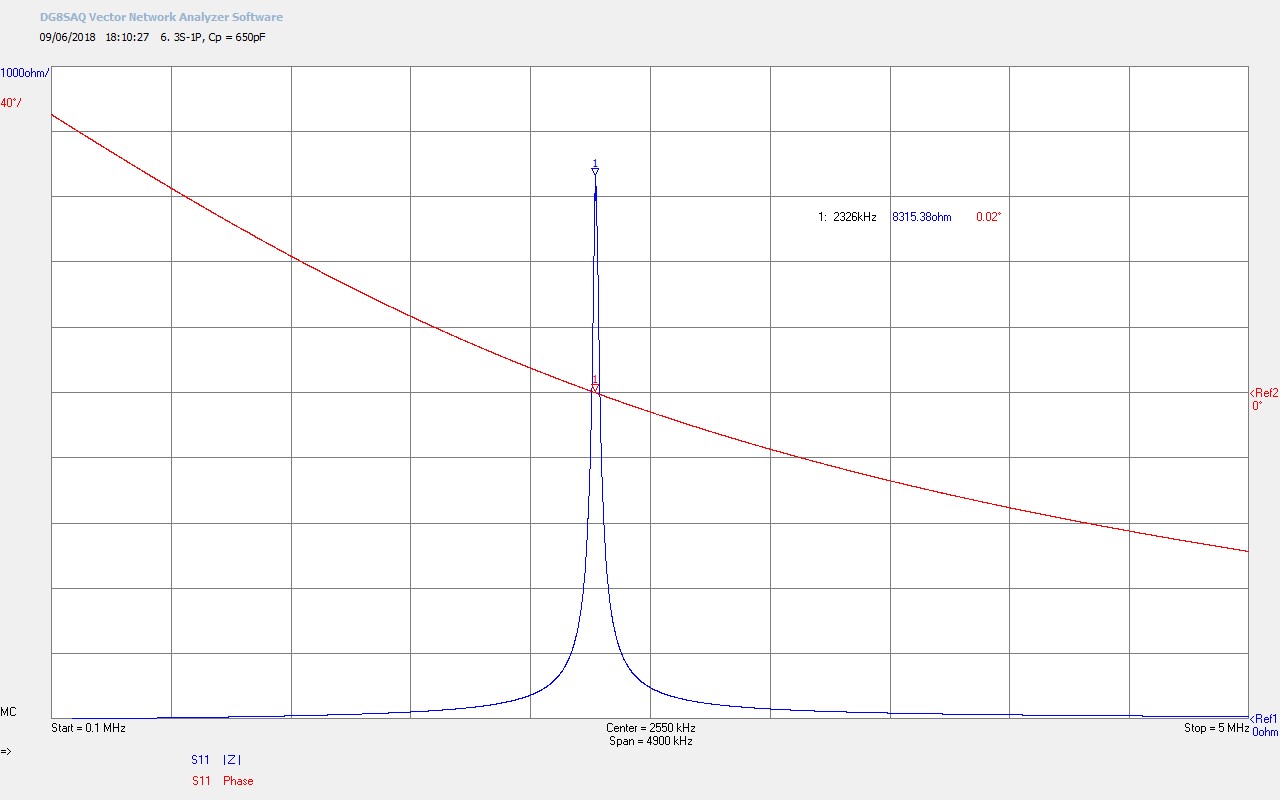
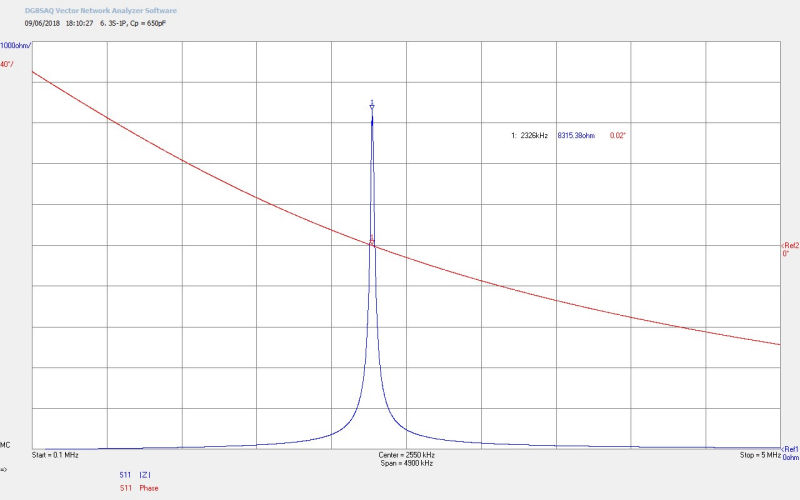
Fig 4.6. Again shows the resonant frequency of the primary FP when the secondary is removed from the flat coil, and all other conditions and setup are kept the same. FP has progressed down slightly in frequency with increased CP from Fig. 4.4. as expected.
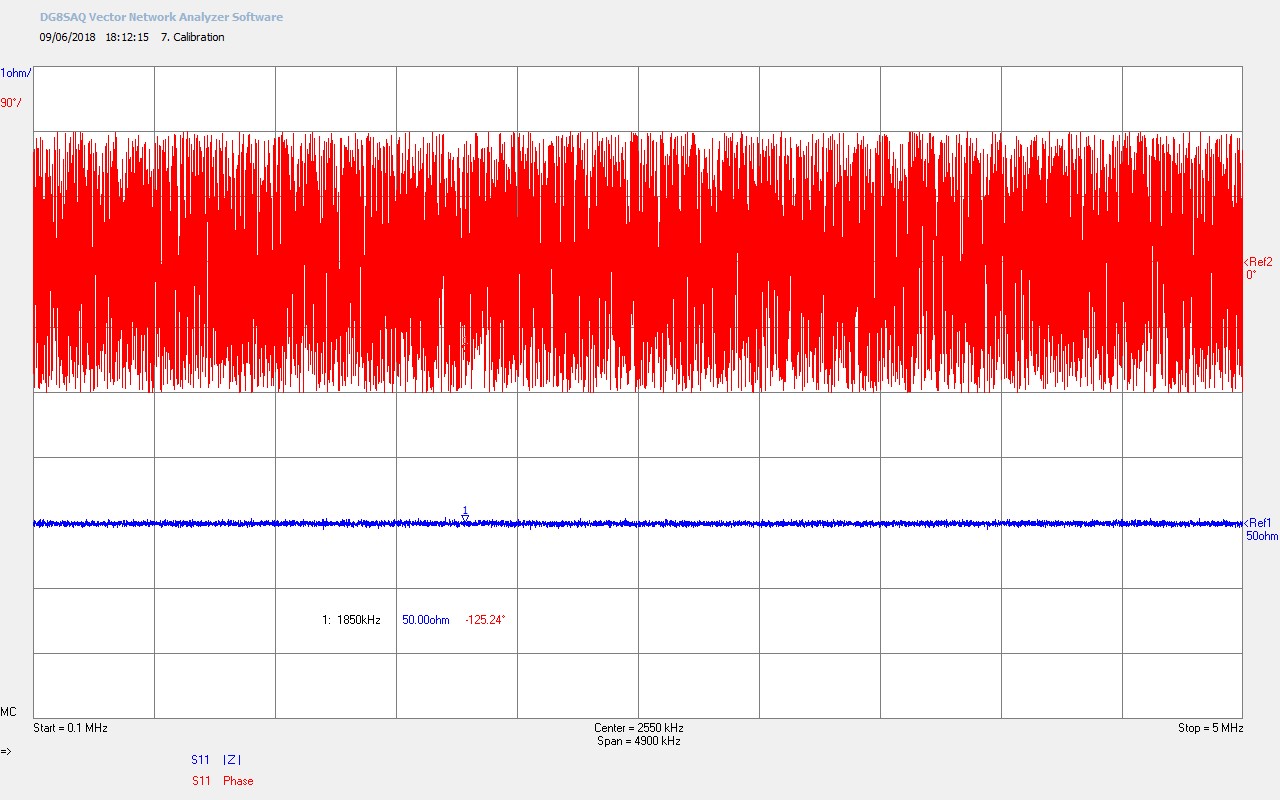
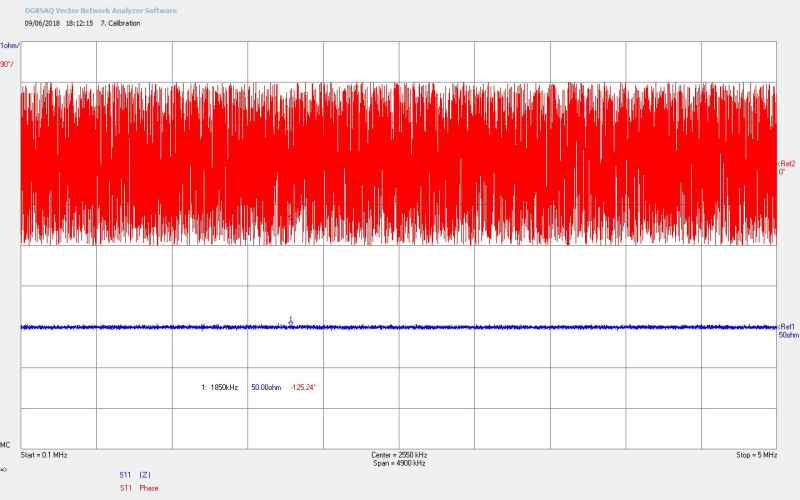
Fig 4.7. Calibration test at the end of the measurement period using a standard 50Ω load, with M1 confirming 50Ω at 1850kc/s.
VNA-HP Measurements for 3S-1P
Figures 5. show a selection of frequency results to confirm and check the accuracy of the results from two different VNAs, and also a basic equivalent circuit analysis for the primary S3 the narrow frequency scan VNA impedance results for Z11 at a key set of different load capacitance.


To view the large images in a new window whilst reading the explanations click on the figure numbers below:
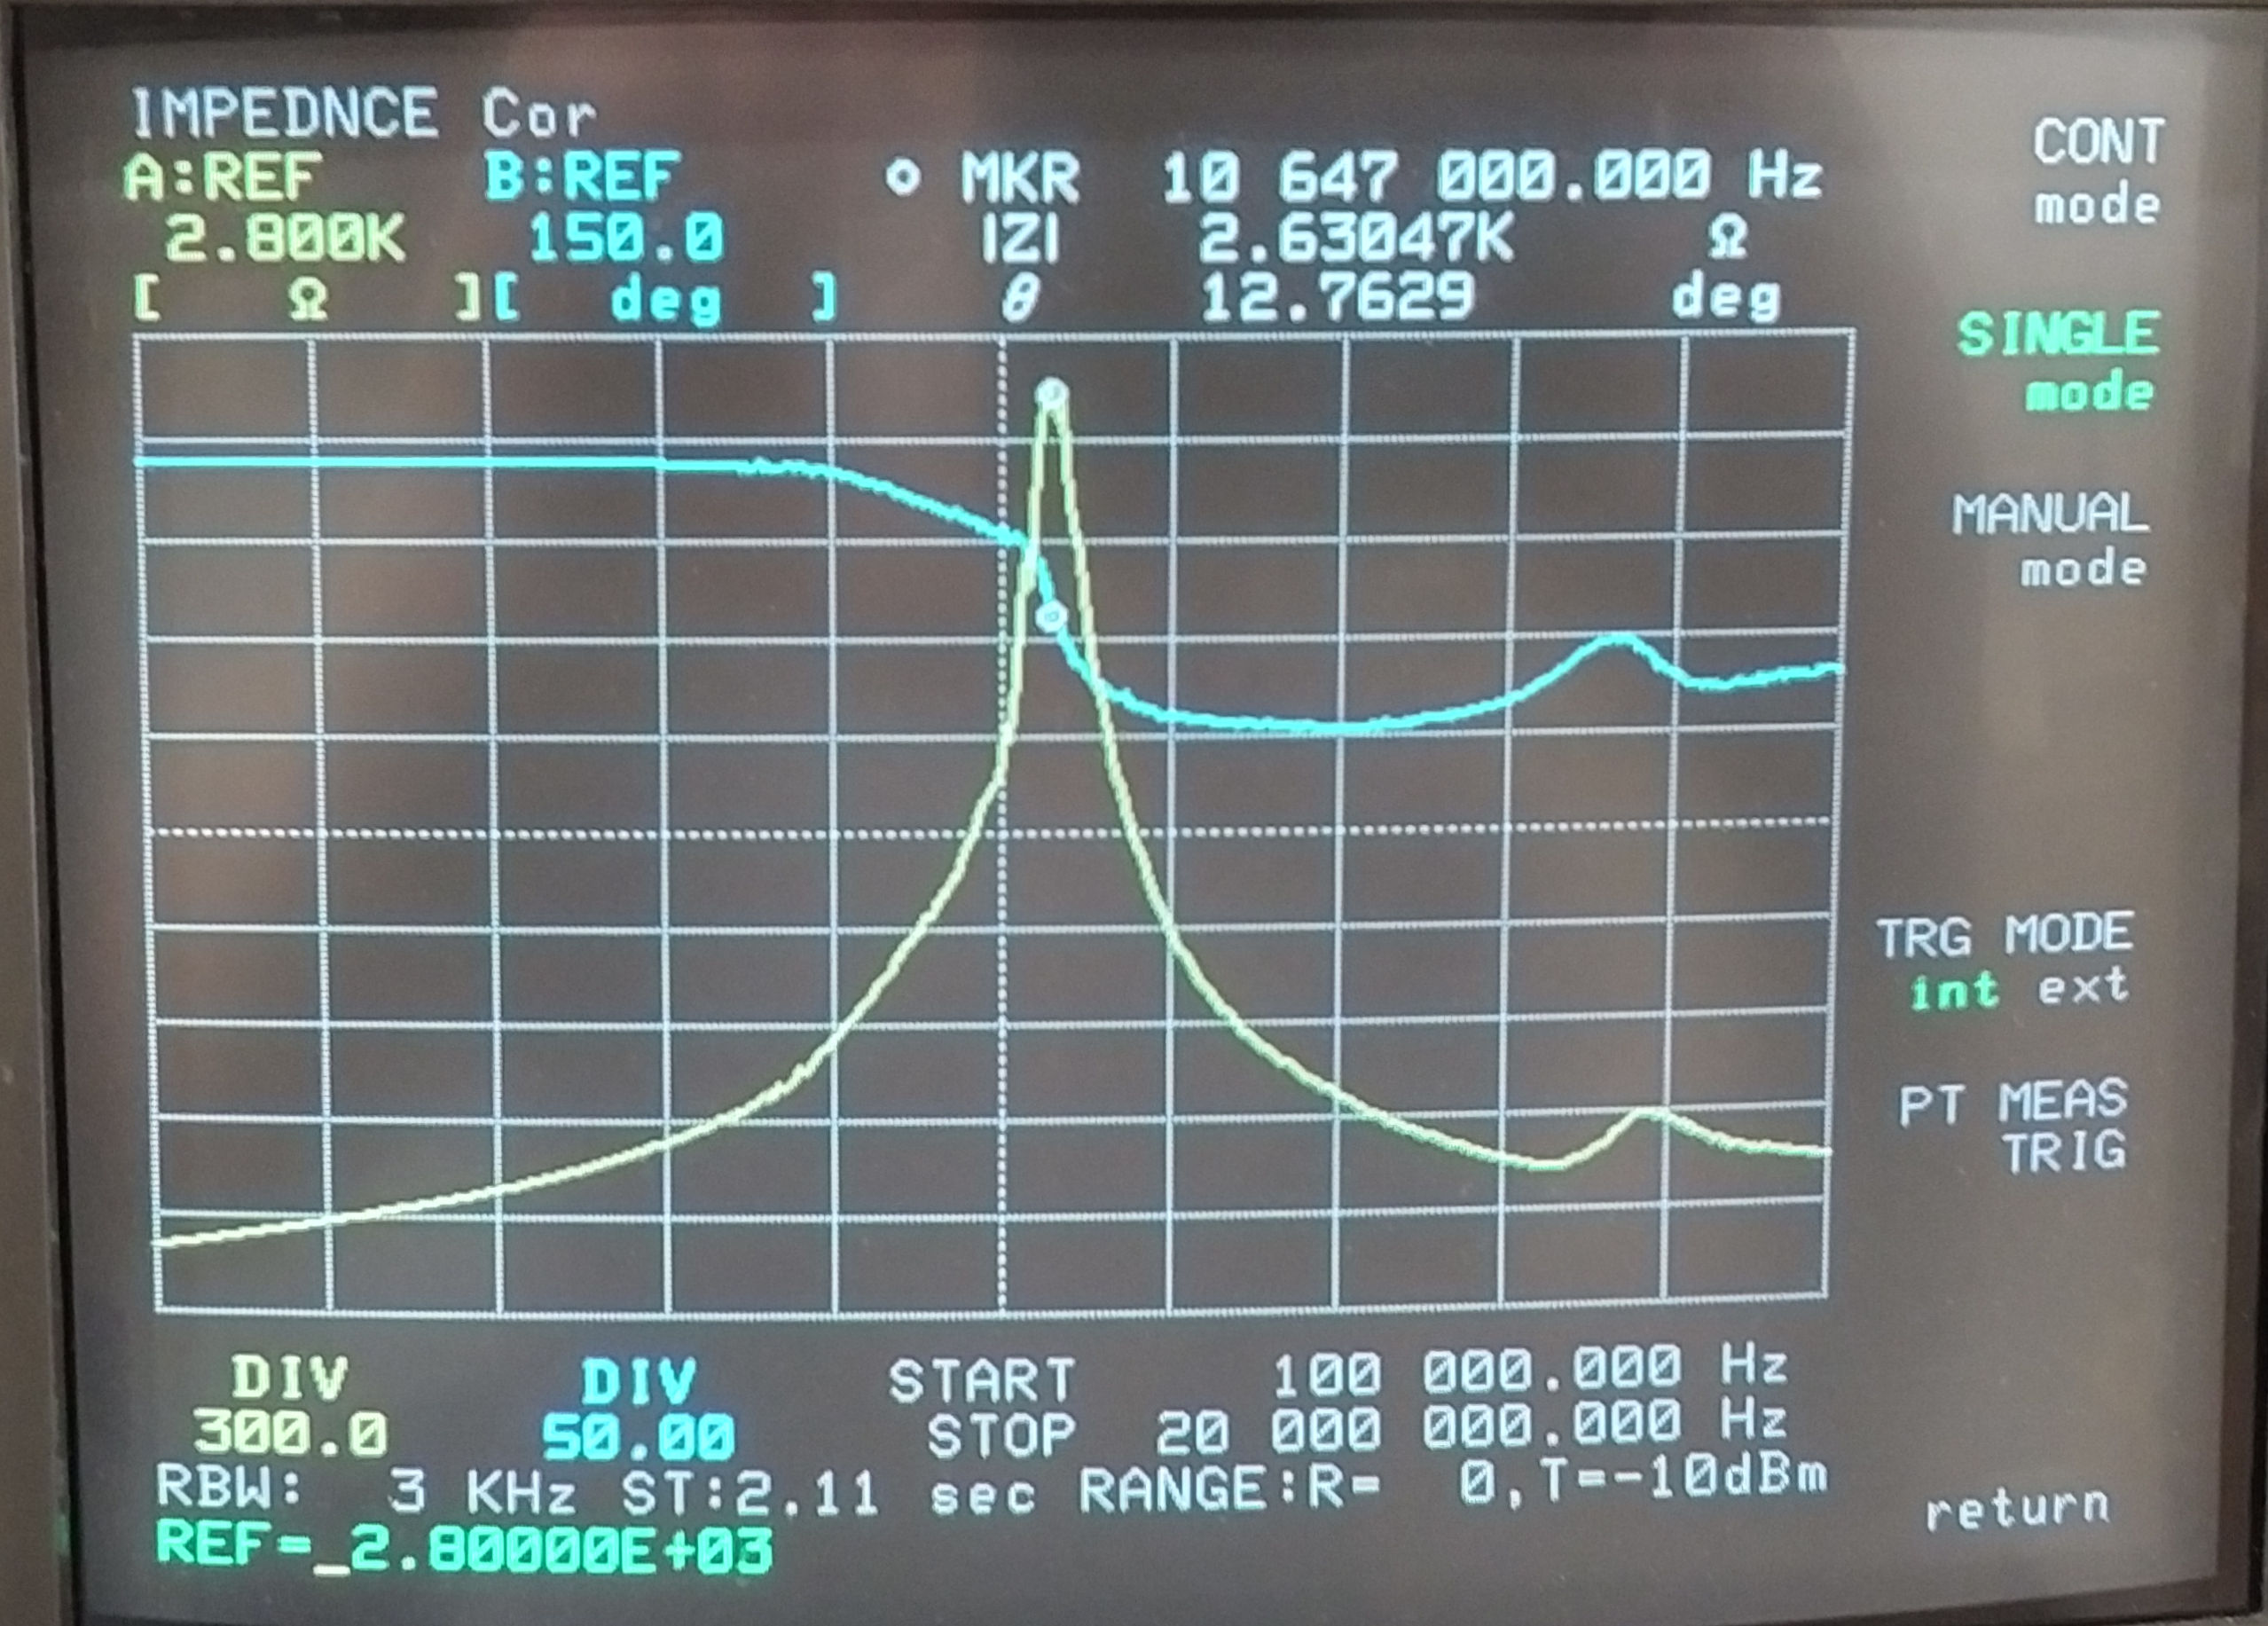
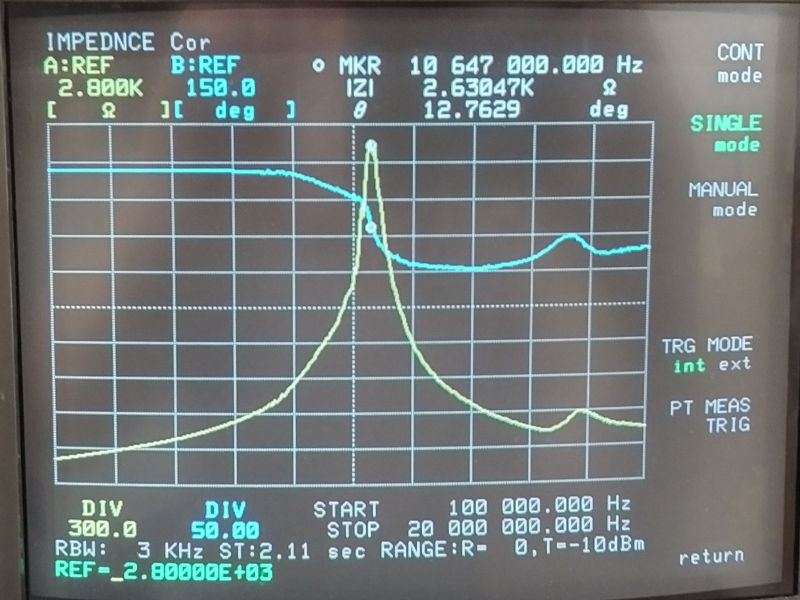
Fig 5.1. Shows the 1P primary with CP=0pF as per the measurement of Fig. 2.2. FP at the MKR frequency is 10647kc/s as measured by the VNA-HP, and was previously measured as 9718kc/s as measured by the VNA-SDR which represents ~ 9% variation in this measurements between the two methods. The phase curve indicated by the VNA-HP also shows a large variation corresponding to FP indicating the fundamental resonant frequency of the primary, and some further small impedance variation and phase change at ~18Mc/s. This highlights the difficulty of making measurements directly on the primary where there is a large imbalance between LP and CP which easily leads to varying measurement conditions easily influenced by the surrounding factors such as earthing structures, conductors, and other electrical loading influences. As LP and CP come into better balance this stabalises and a much greater measurement accuracy is obtained between both measurement machines.
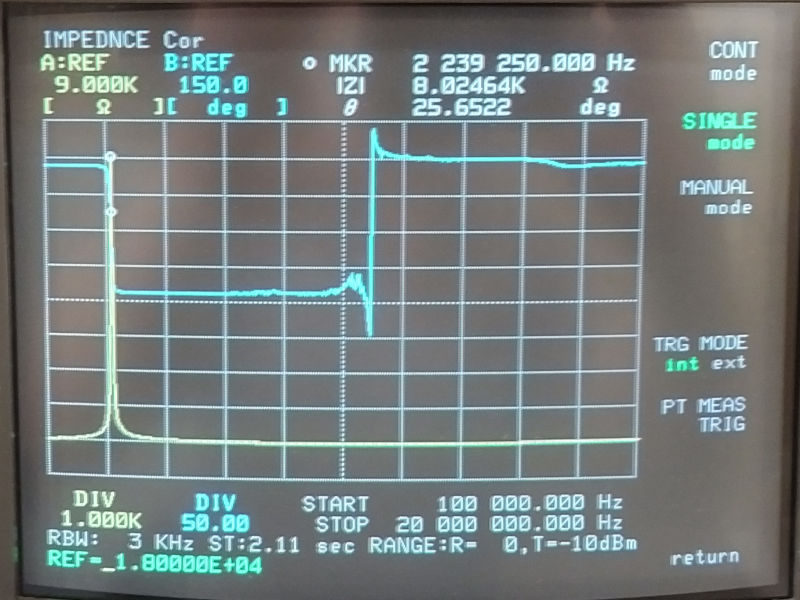
Fig 5.2. Increasing CP=750pF as per the measurement in Fig., 2.5. the 1P primary resonant frequency has moved to 2239.25kc/s, and was previously measured as 2233kc/s by the VNA-SDR showing < 0.5% variation in the frequency. |Z| measures as 8.02kΩ, and was previously 9.072kΩ showing ~12% variation. FØ180 measures as 11000kc/s and was previously 11744kc/s ~7% variation.
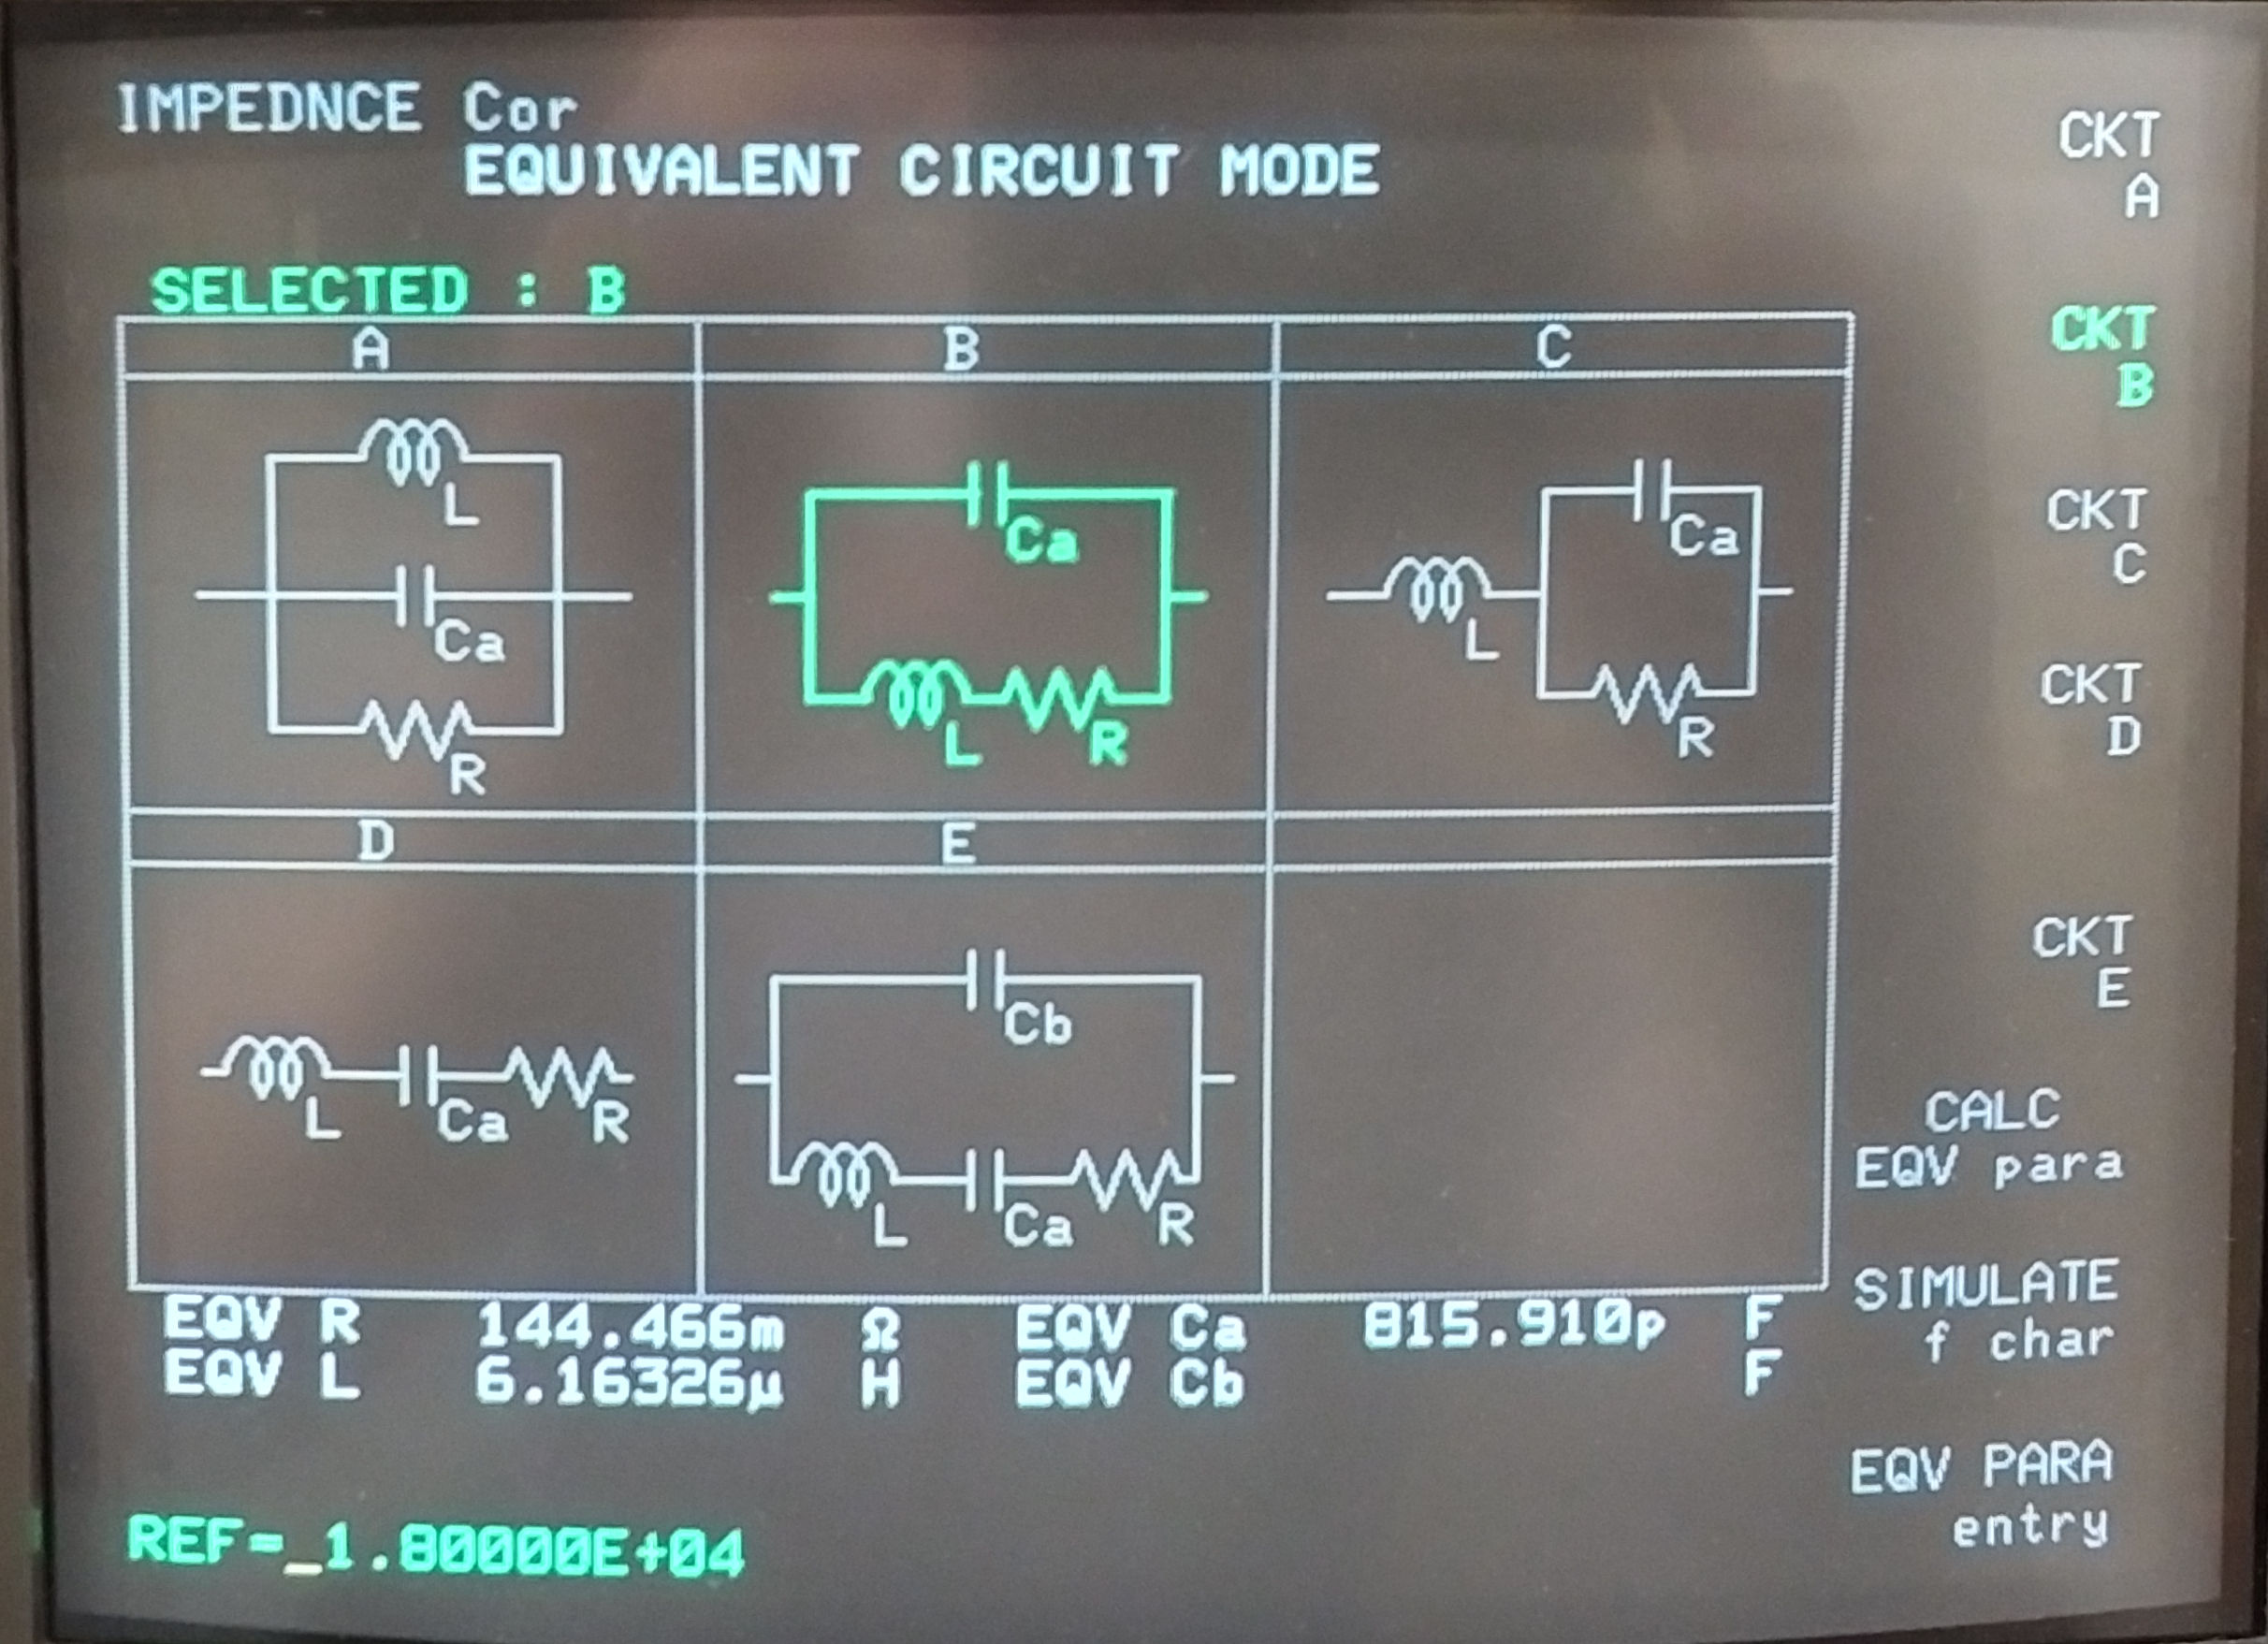
Fig 5.3. Shows the computed equivalent circuit of the 1P primary conditions as per Fig. 5.2. The equivalent circuit is calculated by the HP4195A based on a fit model to the measured curve. In part 1 of the impedance measurements the inductance of the 1P primary was measured at 6.453µH, and here is modelled as 6.163µH ~5% variation. The 1P capacitance CP + Cpp =750 + 30.5 = 785.5pF, and here is modelled as 815.91pF ~9% variation. The dc resistance from part 1 was 1.31mΩ and here is modelled as 144.47mΩ. The resonant circuit LPCP shows a reasonably good fit between the measured values and the modelled values. The series resistance of the coil modelled does not correspond to that measured, although it is considered that this difference does not significantly effect the quality factor of the flat coil, or assessment of the small signal impedance measurements thus far.
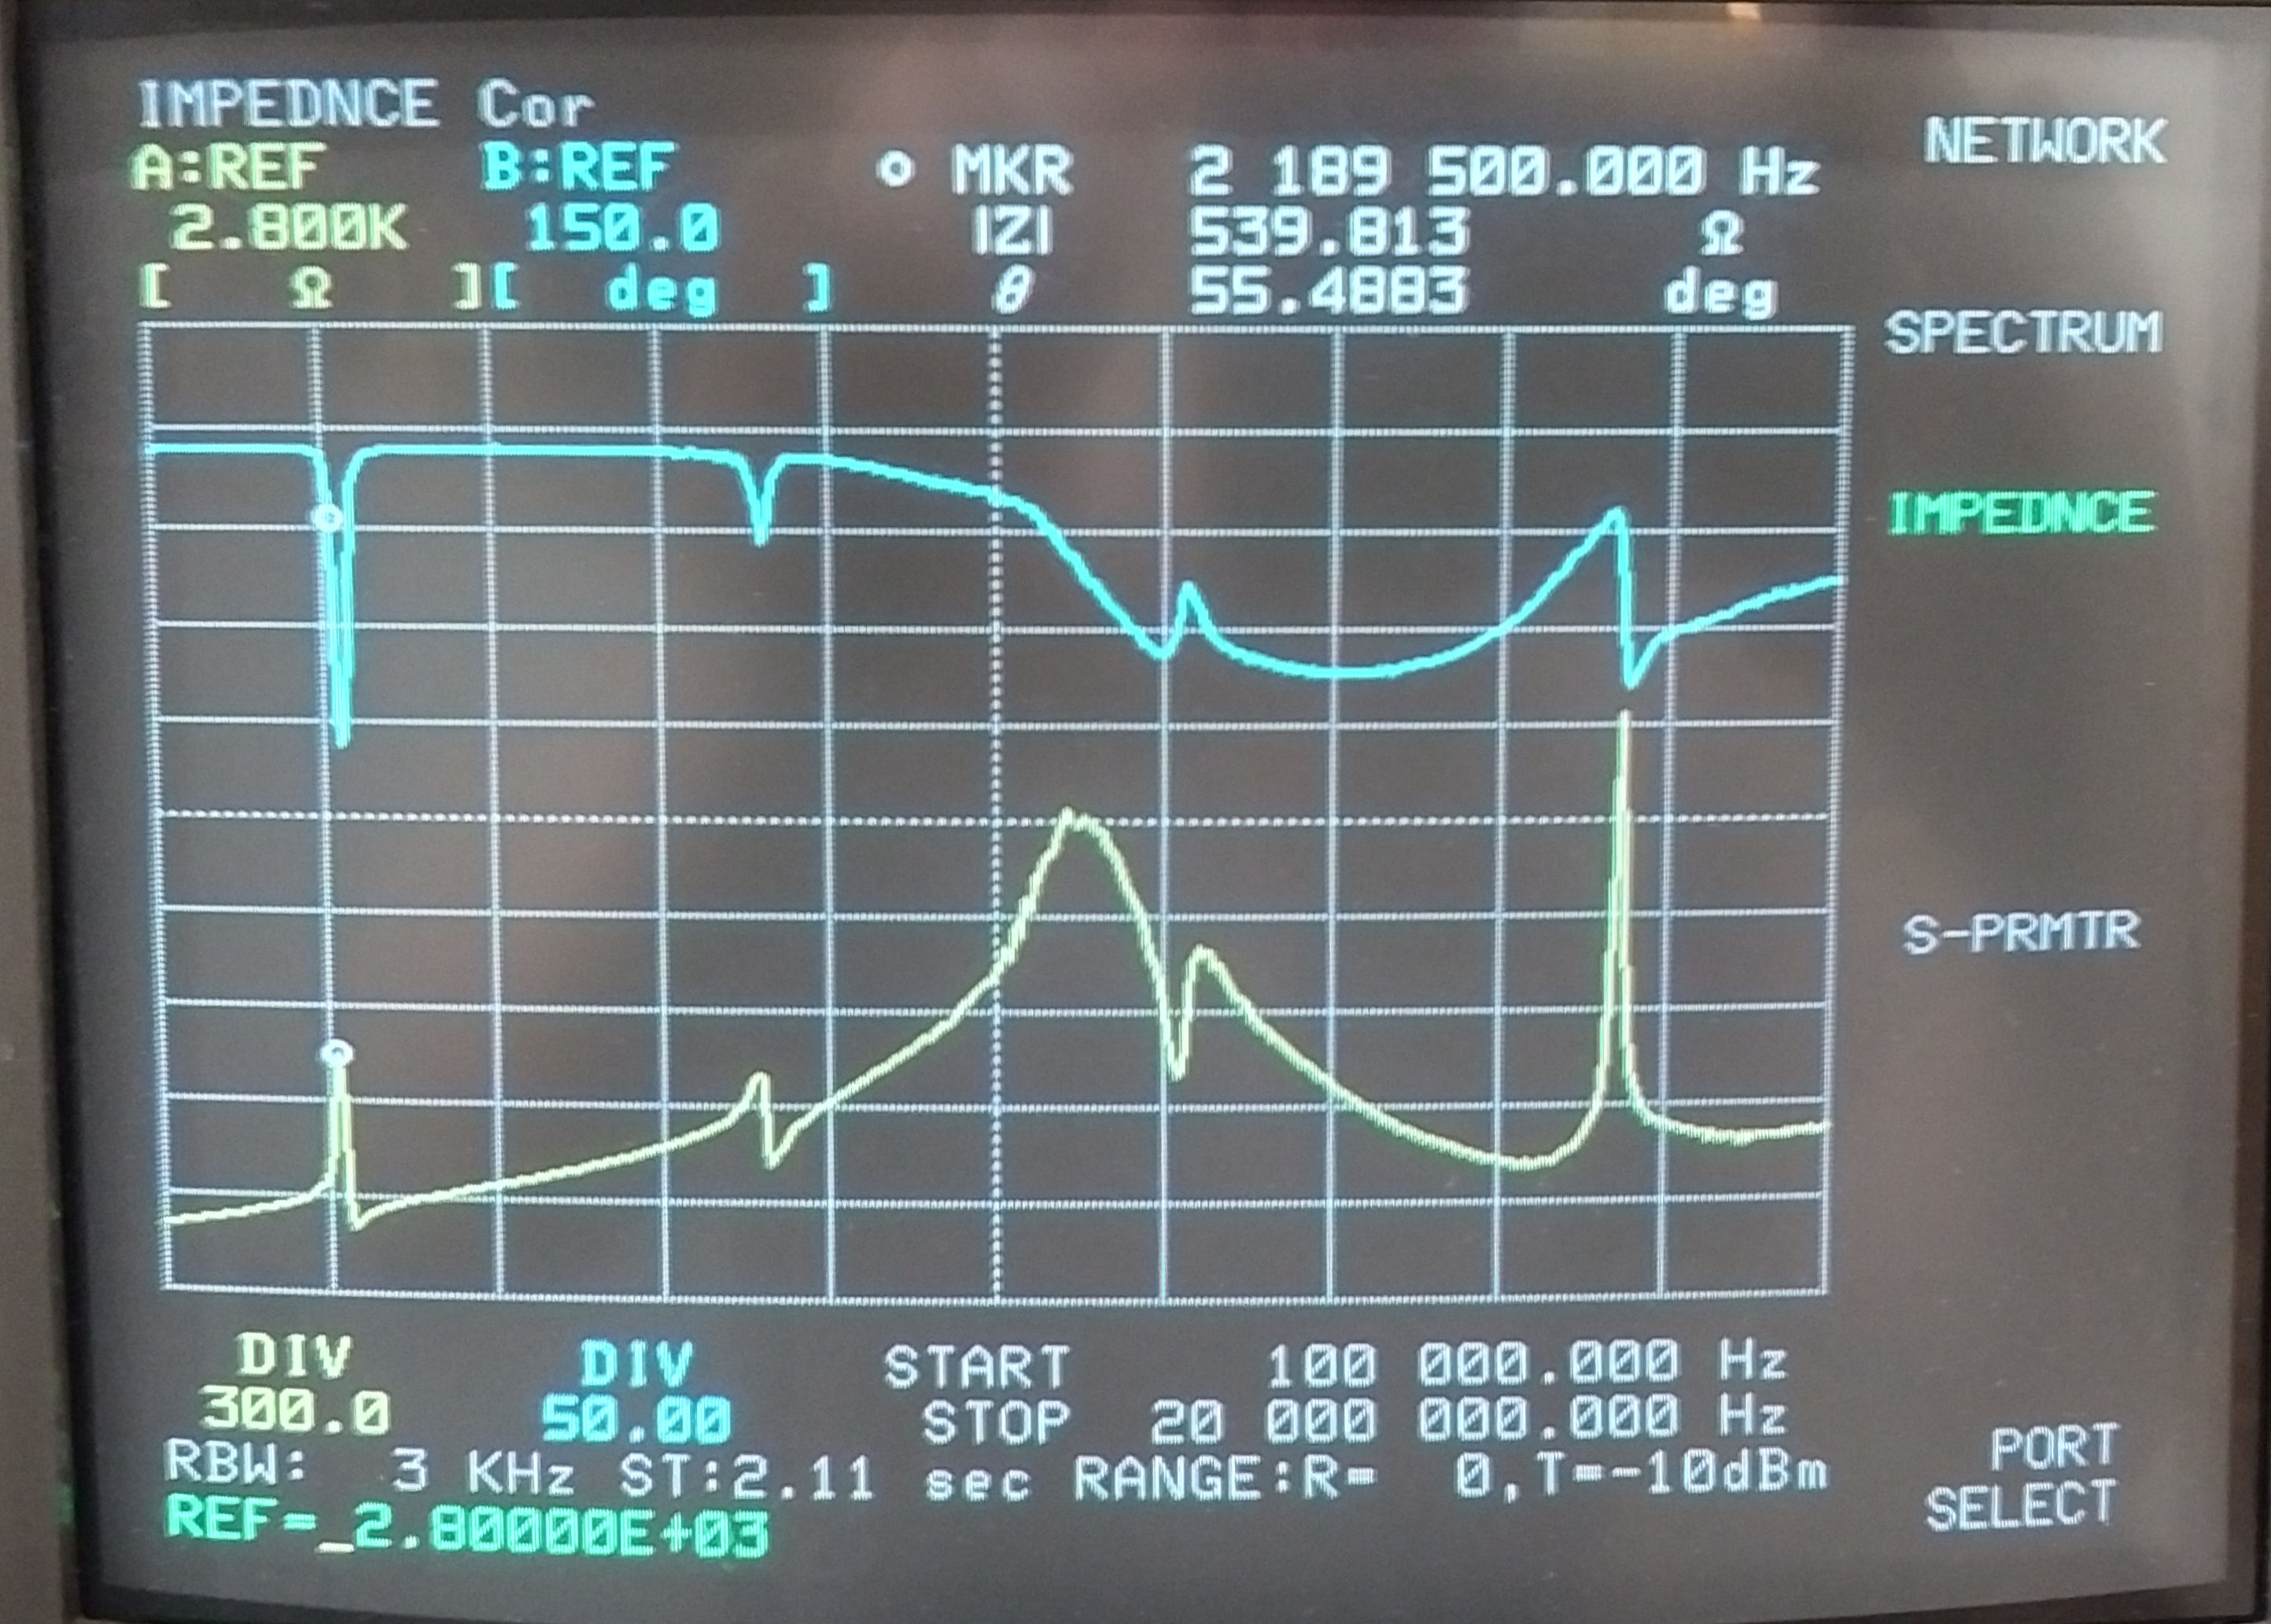
Fig 5.4. Shows the secondary added to form the flat coil 3S-1P where CP=0pF. As per Fig. 3.1 for the secondary and primary impedance-frequency responses become superimposed on one another. The primary resonance FP can be identified clearly at 11000kc/s along with the gradual phase chanhge, along with the secondary resonance FS at 2189.5kc/s with a variation of ~3% from the VNA-SDR measurement of 2254kc/s. Secondary harmonics can be identified in a similar way in a corresponding frequencies as per Fig. 3.1. The greater sensitivity and more finally tuned input circuits of the VNA-HP also show a strong additional resonance at FS4 at ~17.5Mc/s which is not identified in Fig. 3.1.
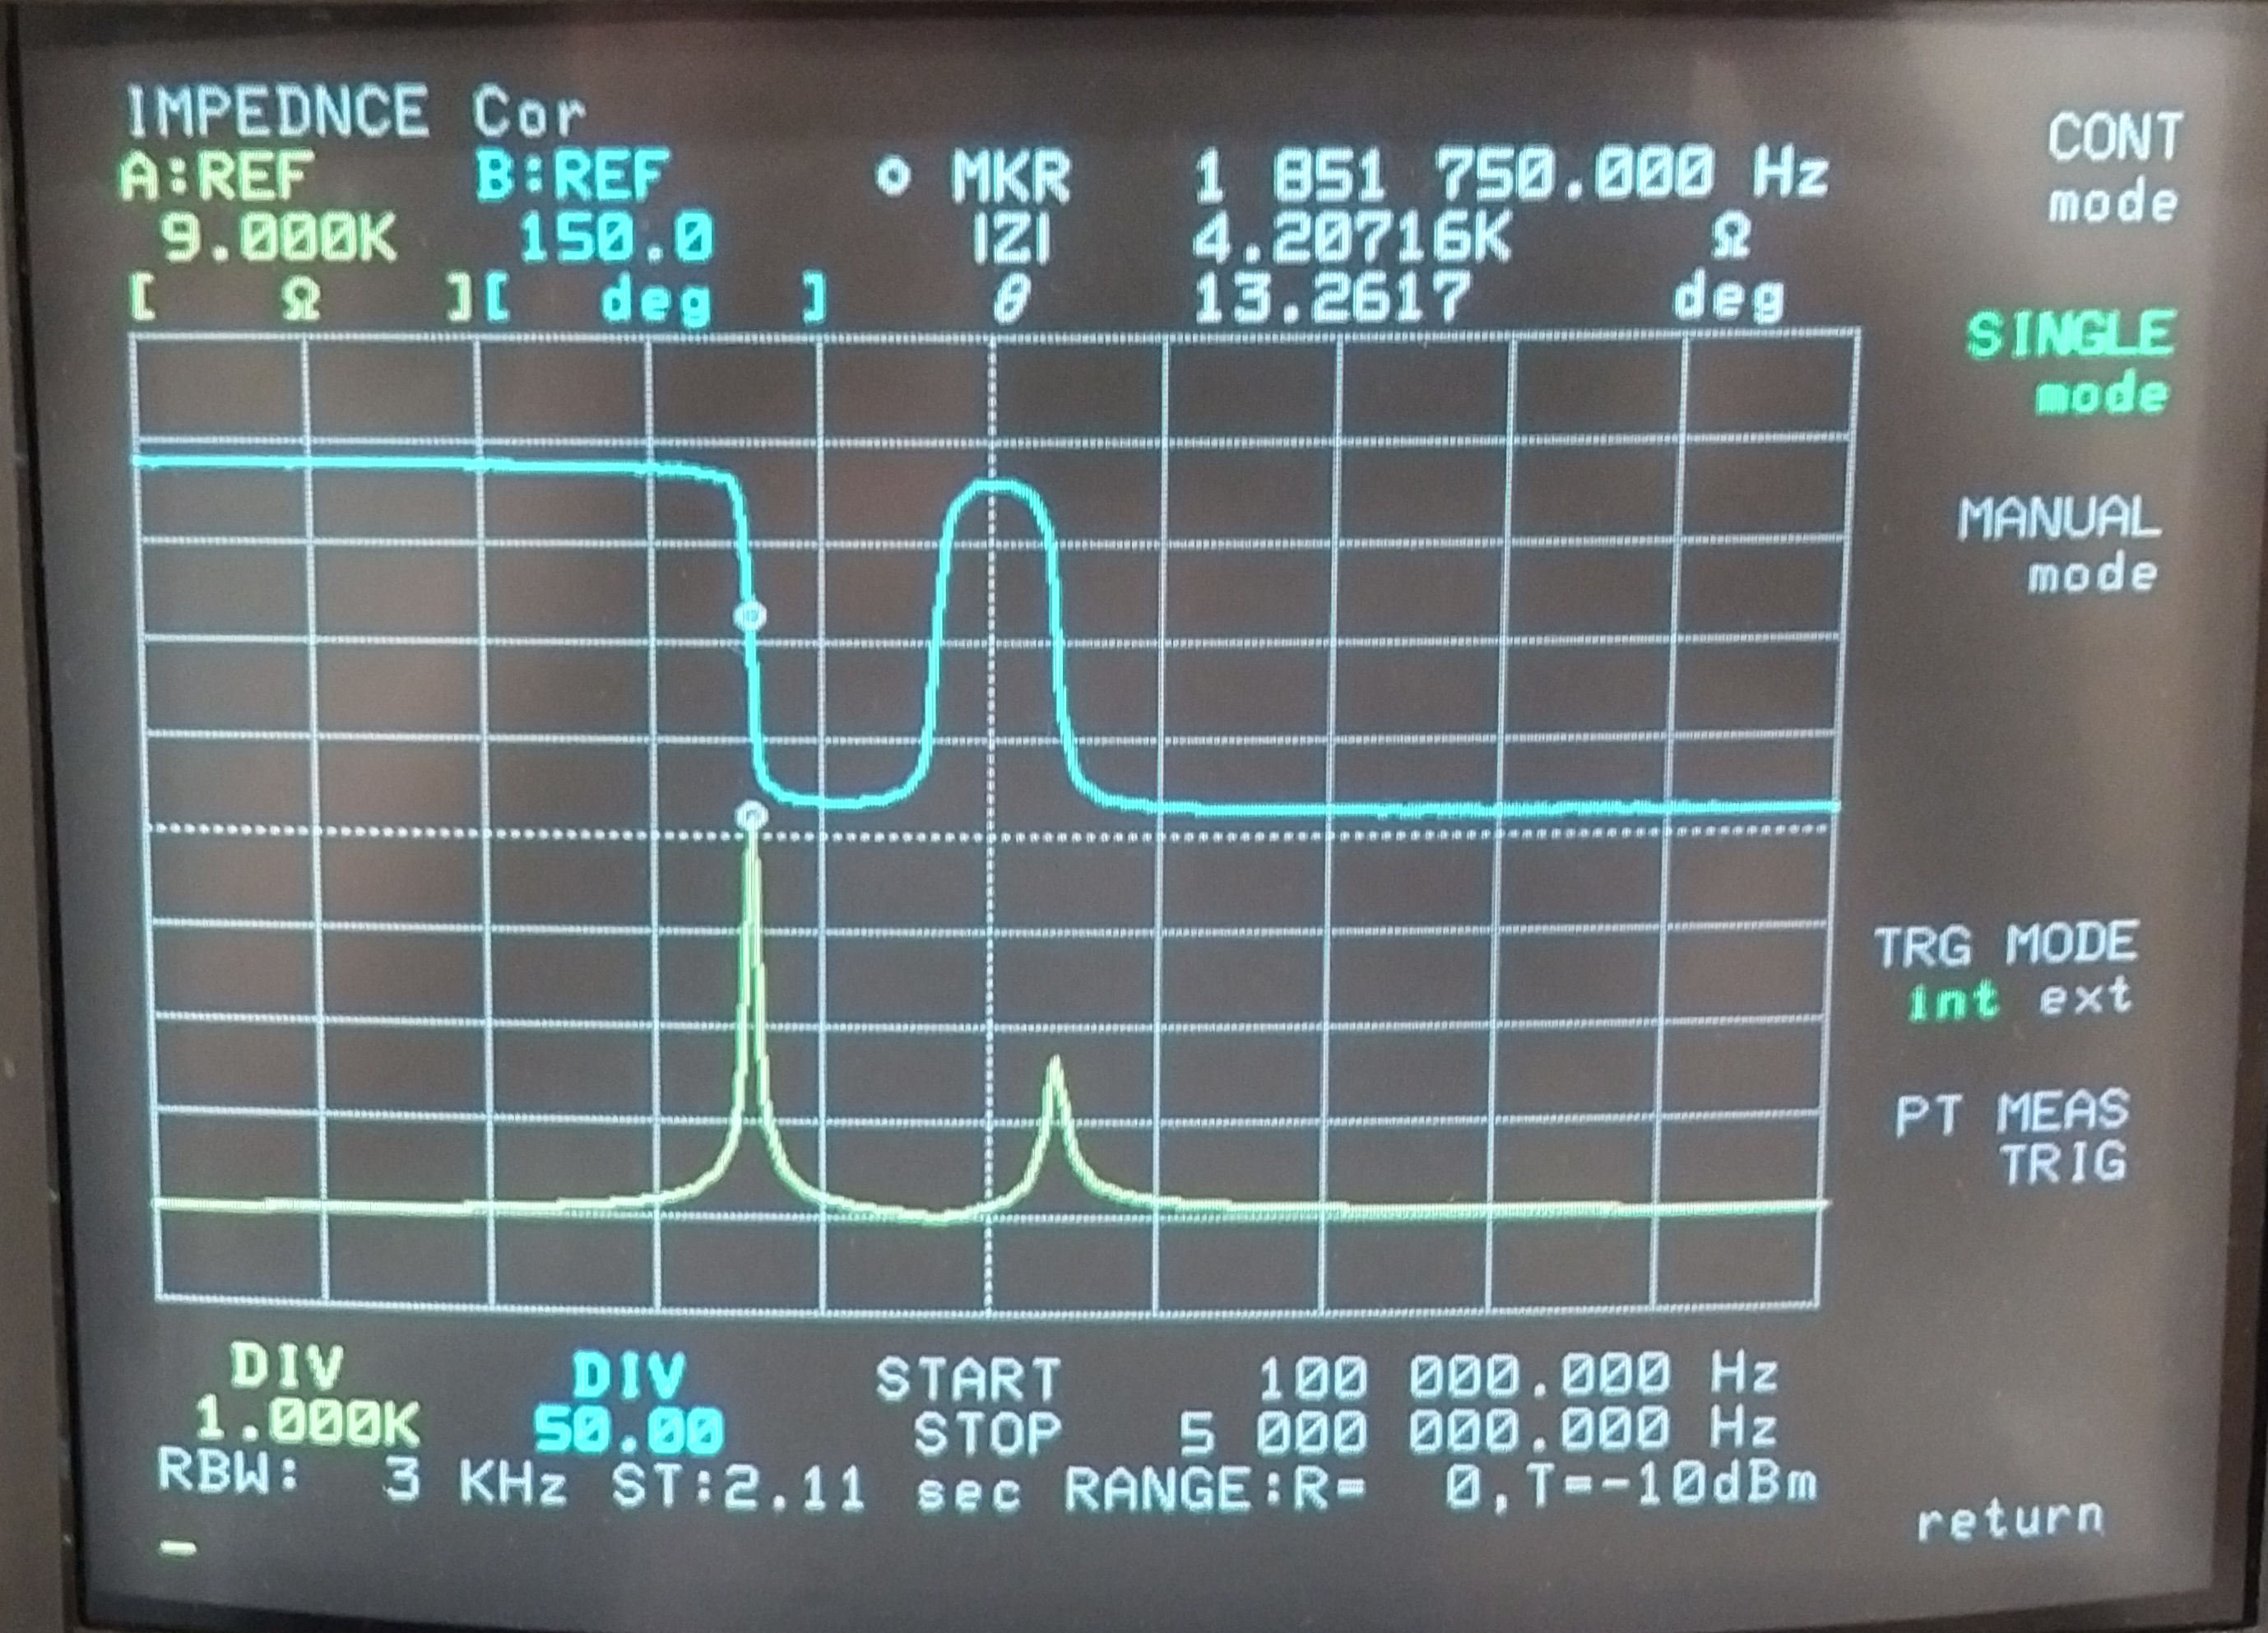
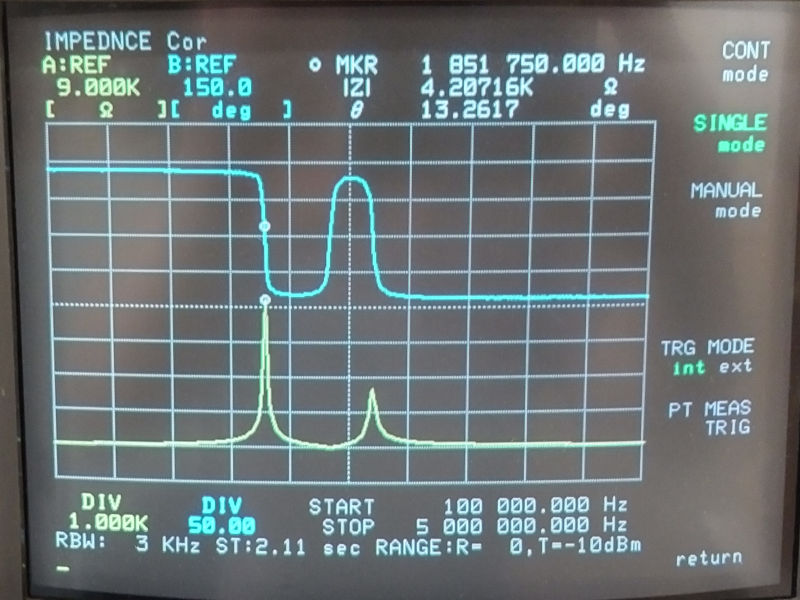
Fig 5.5. Shows primary capacitance CP= 830pF as per Fig. 4.1 where the lower resonant frequency of the flat coil FL has been adjusted to be at the designed frequency of 1850kc/s. The VNA-HP shows a close correlation at 1851.75kc/s ~1% variation, and corresponsing close correlation of FØ180 and FU.
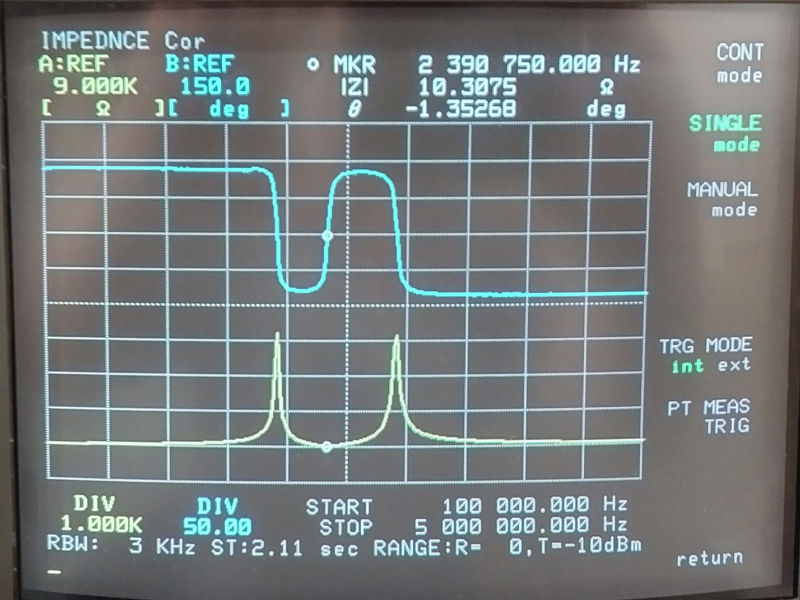
Fig 5.6. Shows primary capacitance CP= 515pF as per Fig. 4.3. Here the FØ180 point is compared at 2390.75kc/s and 2418kc/s a variation of ~3%.
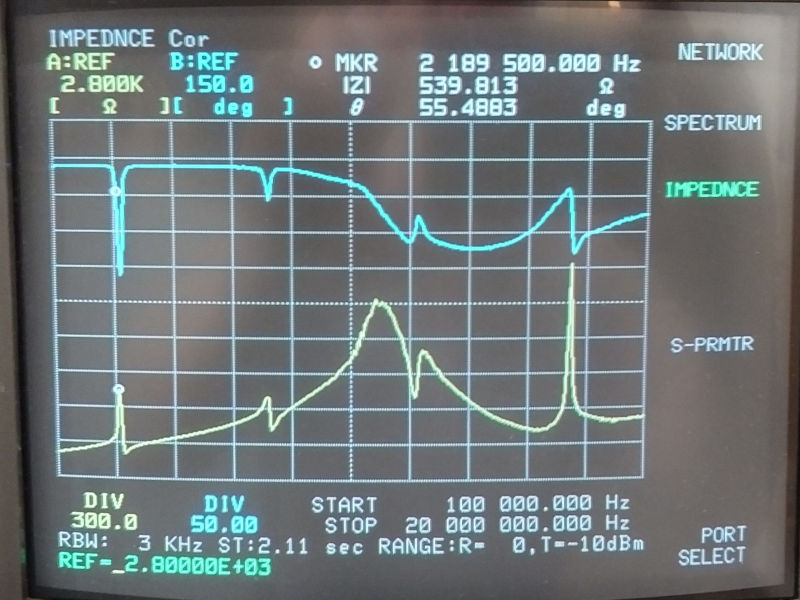
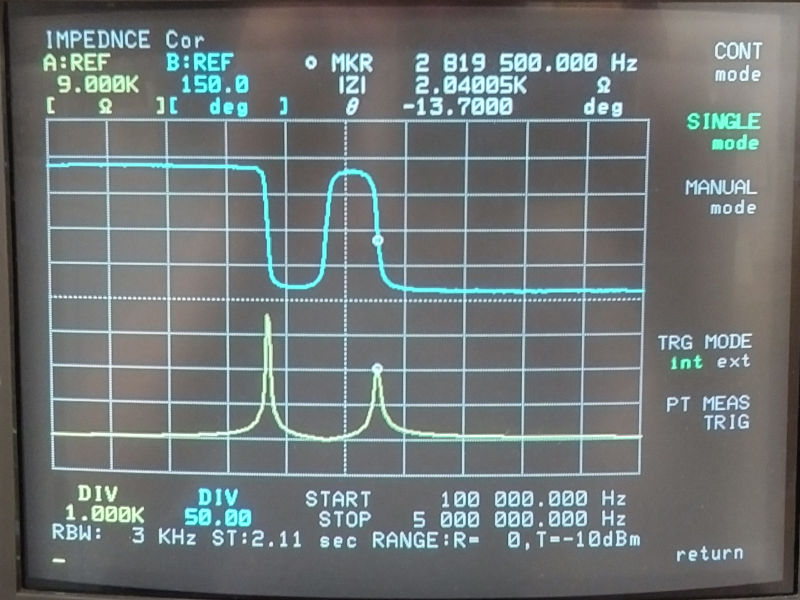
Fig 5.7. Shows primary capacitance CP= 650pF as per Fig. 4.5. Here the FU point is compared at 2819.5kc/s and 2875kc/s a variation of ~2%.
It has been shown that there is good correspondence of the key impedance features of flat coil 3S-1P when measured on both VNA-SDR and VNA-HP. The variation between measured parameters is acceptable for the intended purpose of the flat coil, and all the various measurements correlate well in drawing key conclusions regarding the impedance-frequency properties in part 2.
Summary of the VNA results and conclusions so far:
1. The fundamental resonant frequency impedance characteristics of the primary FP, have been shown to interact with that of the secondary FS to produce an upper and lower resonant frequency for the flat coil, FU and FL.
2. FU and FL can be adjusted in frequency by adjusting CP, which also leads to changes in |ZU| and |ZL|. Adjustment of CP allows the frequency band of operation to be selected, and occurs for FL within the target operation band, the 160m amateur band.
3. The balance of |ZU| and |ZL| leads to several important operating points for the experiments in displacement and transference of electric power. Most particularly when |ZU| = |ZL| and it is conjectured that the magnetic and electric fields of induction are in balance between the primary and secondary, which will lead to the best operating point for coherence between the induction fields and hence displacement events stimulated by non-linear events in the system.
4. The correspondence between measurements using different VNAs is good with variations in most key parameters being < 5%.
5. Equivalent circuit elements yield circuit values in reasonable correlation to those expected and those measured in part 1.
6. Small signal input impedance measurements Z11 have provided greater understanding and insight into the mechanisms governing the characteristics of the flat coil, how best to experiment using the flat coil, and how best to drive and match the coil to the various generators and loads.
Click here to continue to the flat coil impedance measurements part 3.
1. A & P Electronic Media, AMInnovations by Adrian Marsh, 2019, EMediaPress
2. Dollard, E. and Energetic Forum Members, Energetic Forum, 2008 onwards.