


Part 1 of single wire currents investigates the voltages and currents generated in the secondary coil, and connected load circuit, when the primary is driven from a suitable generator. In this part the generator used is a high voltage vacuum tube oscillator which derives the feedback for oscillation directly from the dominant flat coil resonant frequency.
The design, construction, and measurement of this generator, and its matching and tuning circuit, will be reported in subsequent posts. For clarity here the following different types of generator have been built and tested in a wide range of different experiments:
1. Vacuum tube generator driven either by an external high power oscillator, or directly as a self-tuned oscillator using feedback from the secondary coil. Can be driven in CW (carrier or continuous wave), burst, or modulated modes.
2. Spark gap generator, (static or rotary), driving directly a primary matching and tuning circuit, (tuning circuit as shown in Fig. 1.4 below).
3. Spark gaps driving a modern replica of an H.G. Fischer diathermy generator.
4. An original 1920’s H.G. Fischer diathermy generator.
Experiments in single wire currents investigate the interesting and unusual properties that result from high voltage and often high frequency waves emitted from a suitable source or generator and guided by a single wire to a load. The single wire nature means that power is passed from the generator to the load, and where the load is able to utilise this power to do work, through only a single wire. In a standard electric circuit a source of electric power such as a battery or an oscillator would be connected from both the +ve and -ve terminals for a current (dc or ac) to move around the circuit, and doing work in the circuit dependent on the characteristics and nature of the circuit. In this case if one of the terminals were removed, the circuit would be considered open-circuit, no current would flow, and no power could be utilised to do work within the circuit. In the single wire case the power conveyed through the electric and magnetic fields of induction easily do measurable work e.g. lighting an incandescent bulb, whilst the current in the circuit appears to be guided only by a single wire, that is, there is no obvious return wire for the current to pass back to the generator and create the required “circuit” for the classical conduction of electric current.
In part 1 of this experiment a vacuum tube generator is used to apply an rf sinusoidal (ac) current to the primary of the flat coil in CW mode. By extension of the magnetic field of induction to the secondary coil a magnified electric field of induction (emf) is induced across the secondary of the coil. When the secondary coil is further connected to a load via a wire at the bottom-end, or outer-end, an oscillating current (resulting from a reciprocal inter-action between the electric and magnetic fields of induction) is guided by the conductor of the wire to the load. In conjunction a pick-up coil is used behind the secondary to induce a small part of the magnified wave and feed this back to the vacuum tube oscillator. This positive feedback signal drives the oscillator at the dominant (tuned) frequency of the flat coil, in this case the lower resonant frequency FL at ~ 1850kc/s where CP ~ 900pF. In this way the circuit can be measured at a single frequency which can be tuned and adjusted using the primary capacitance CP.
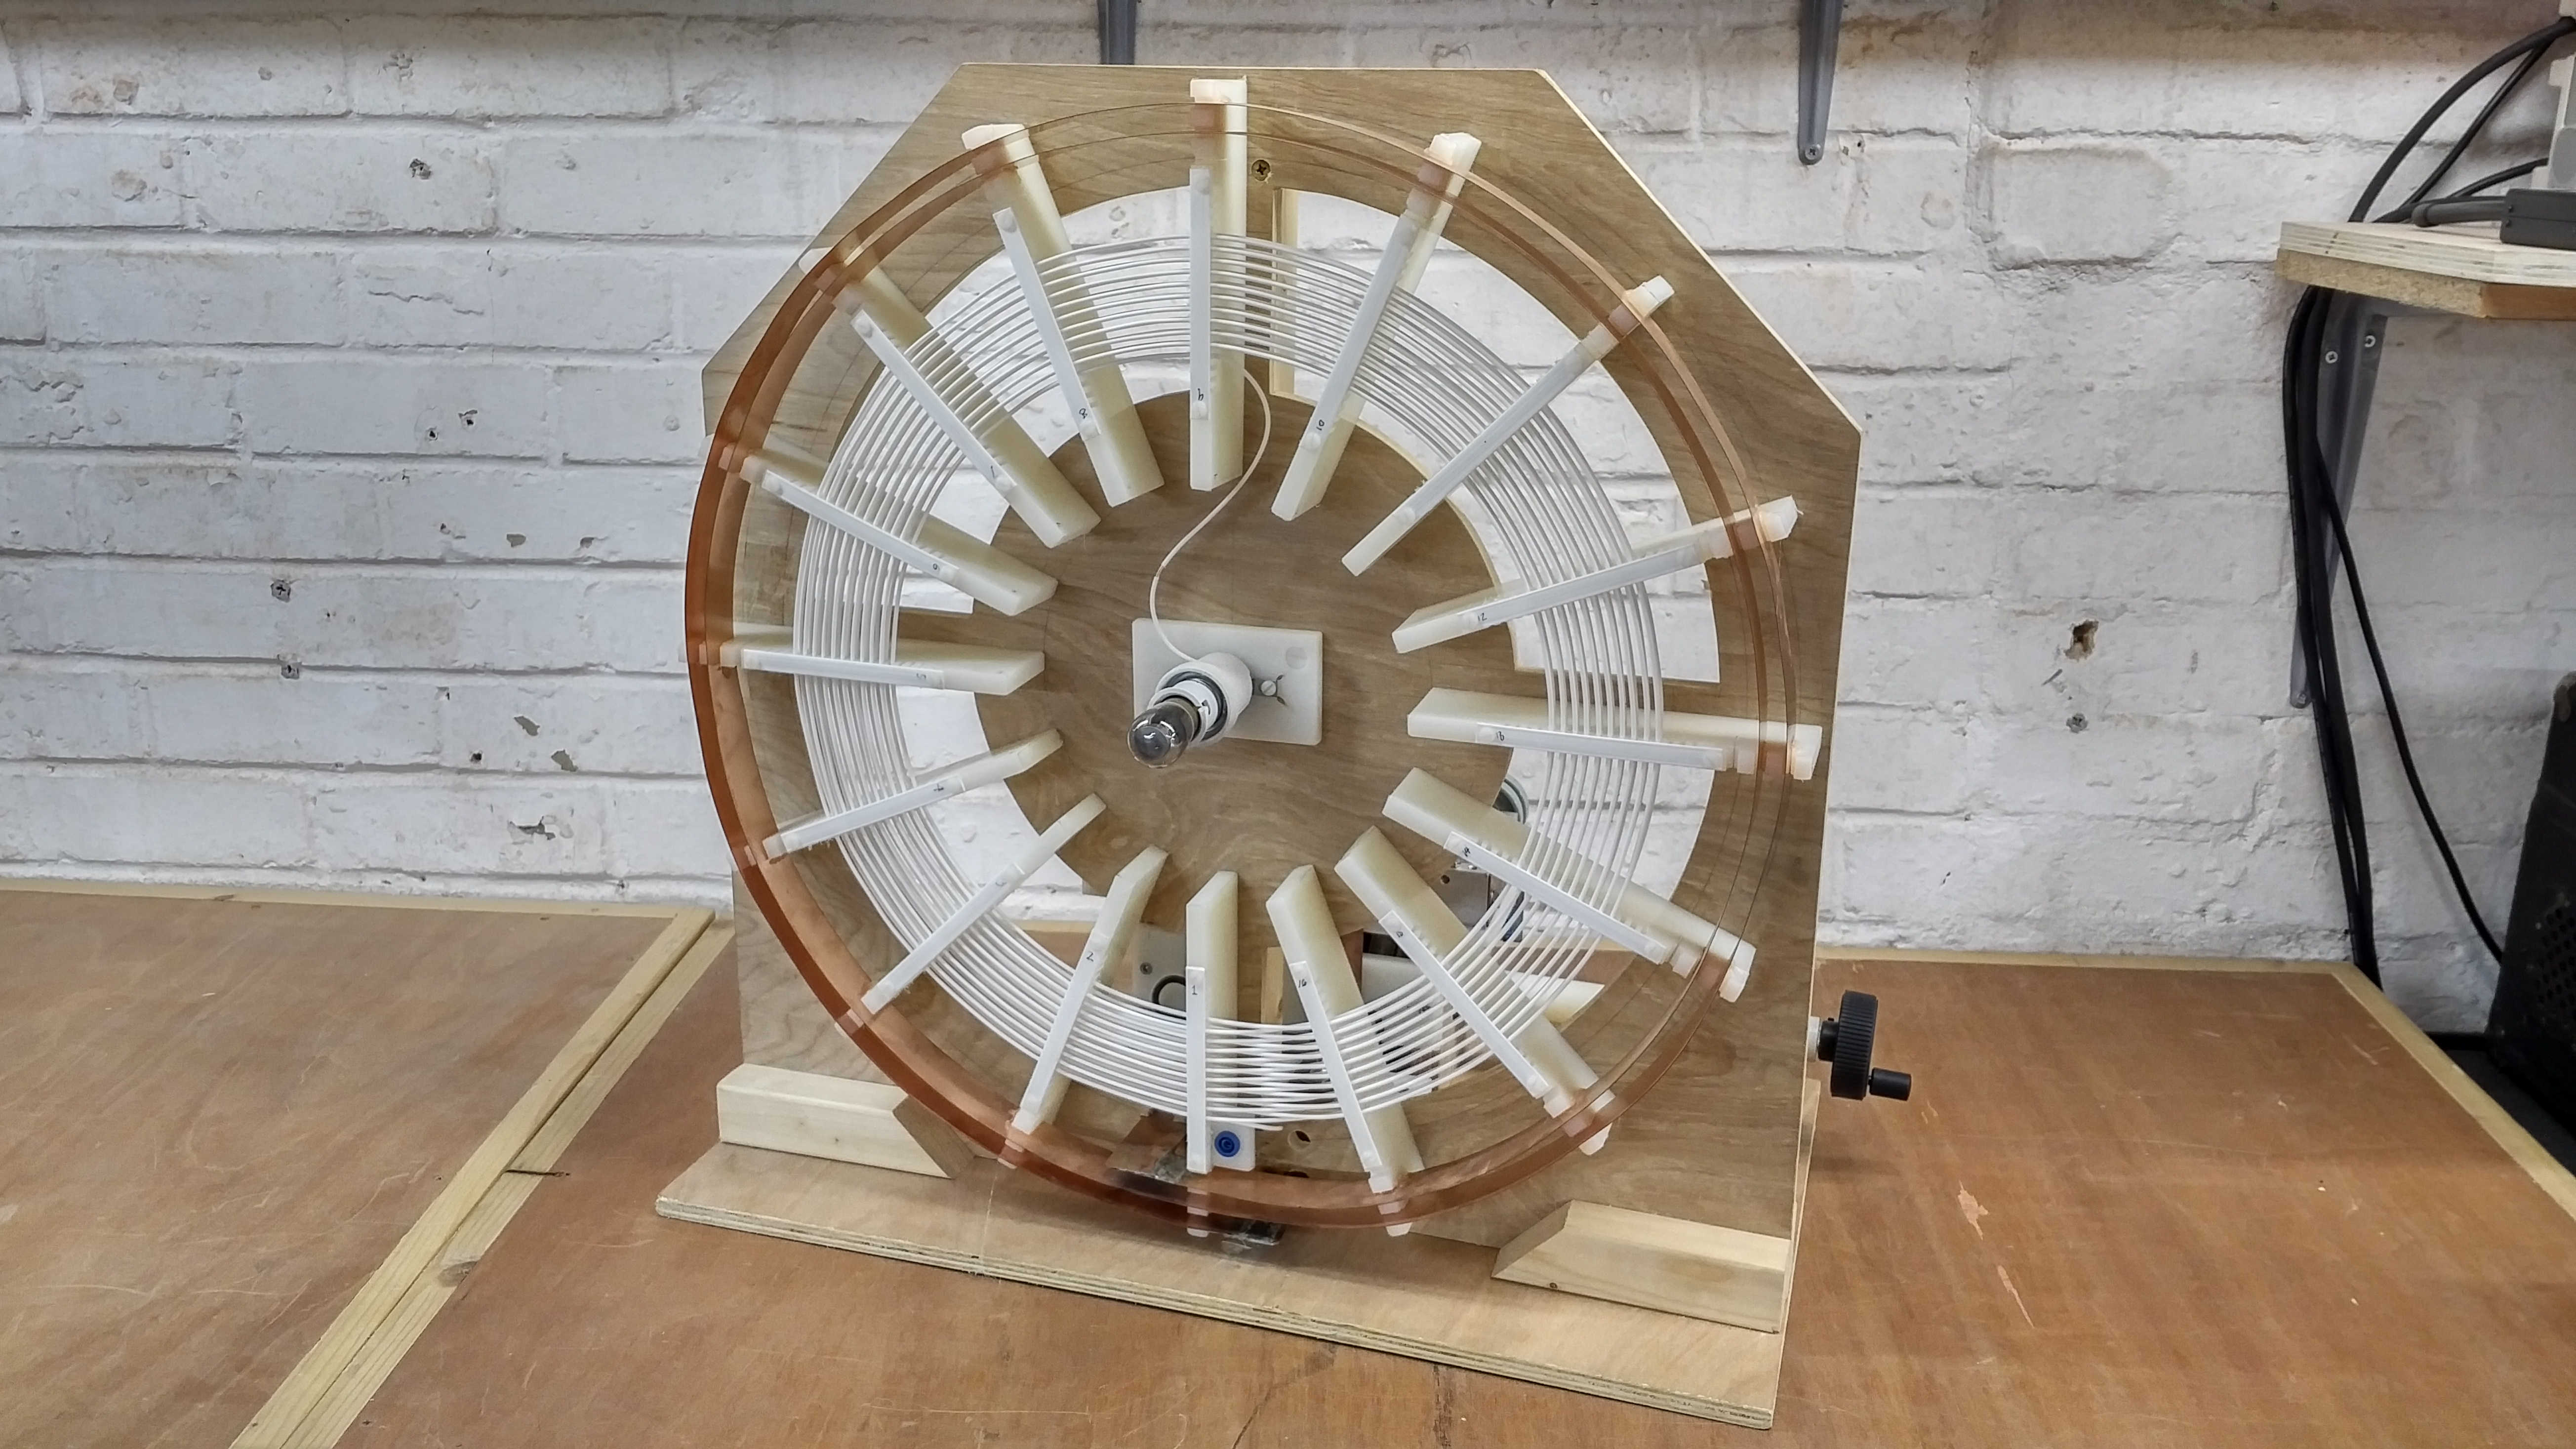
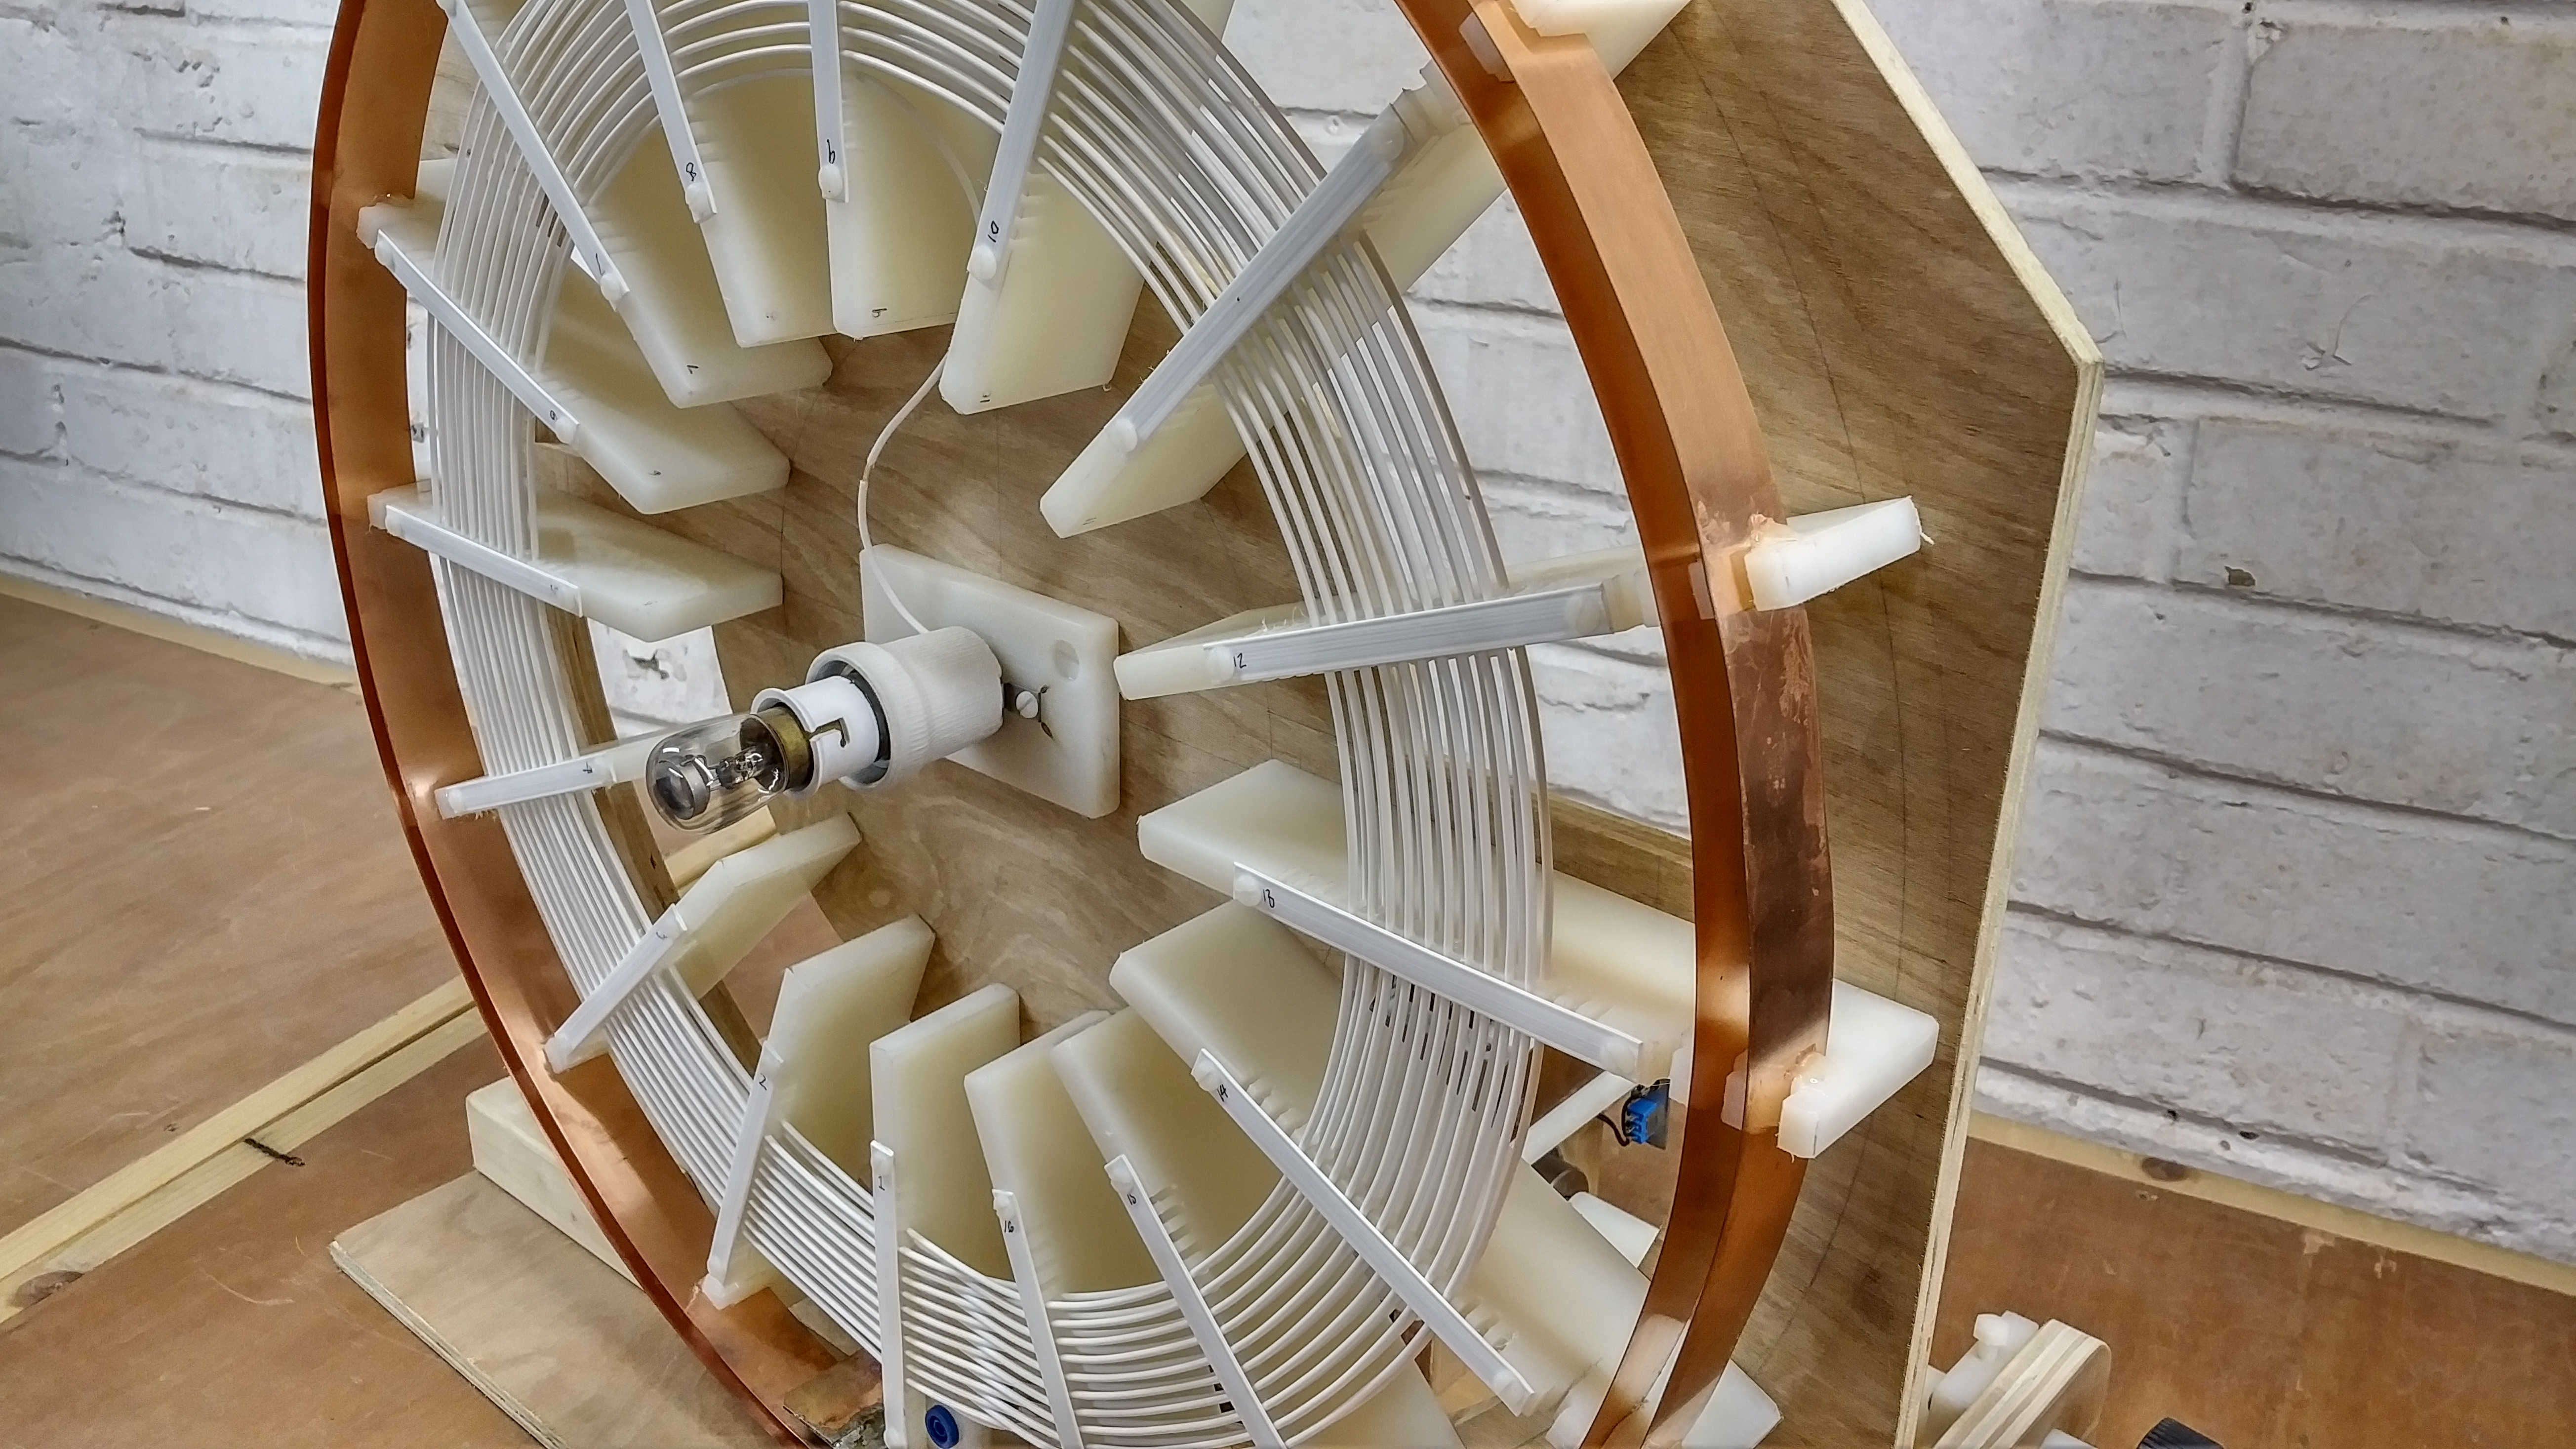
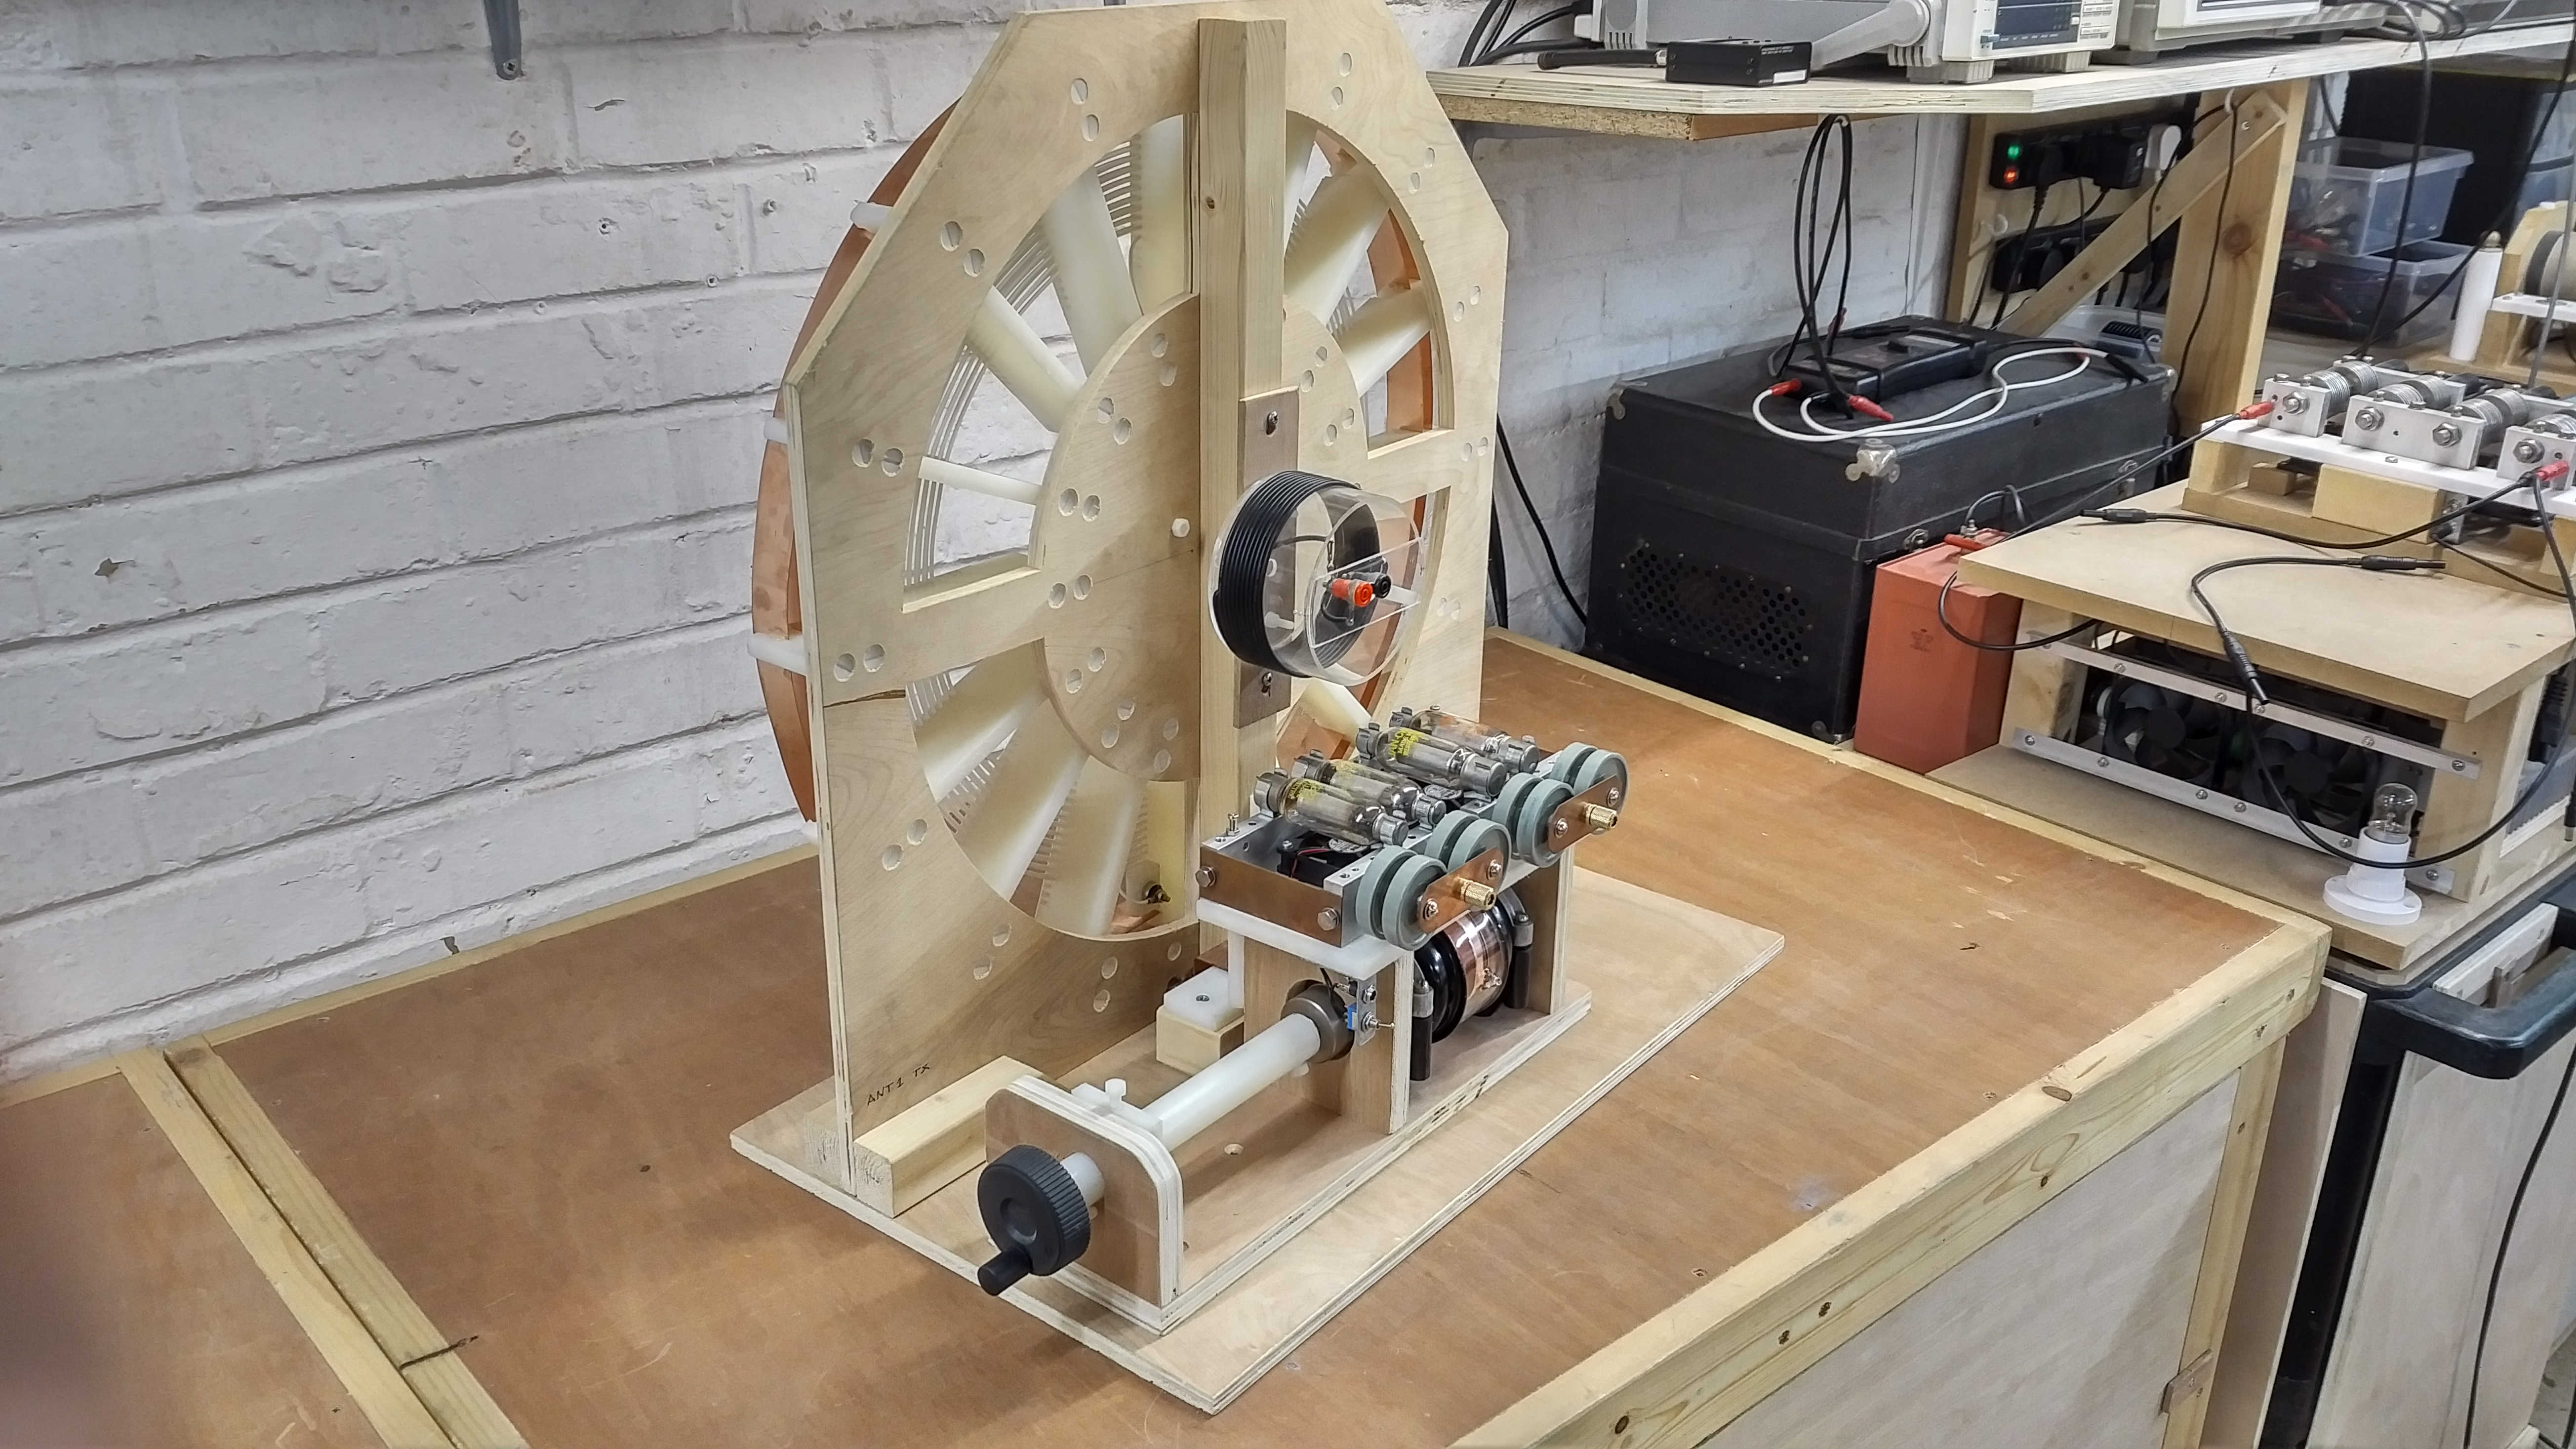
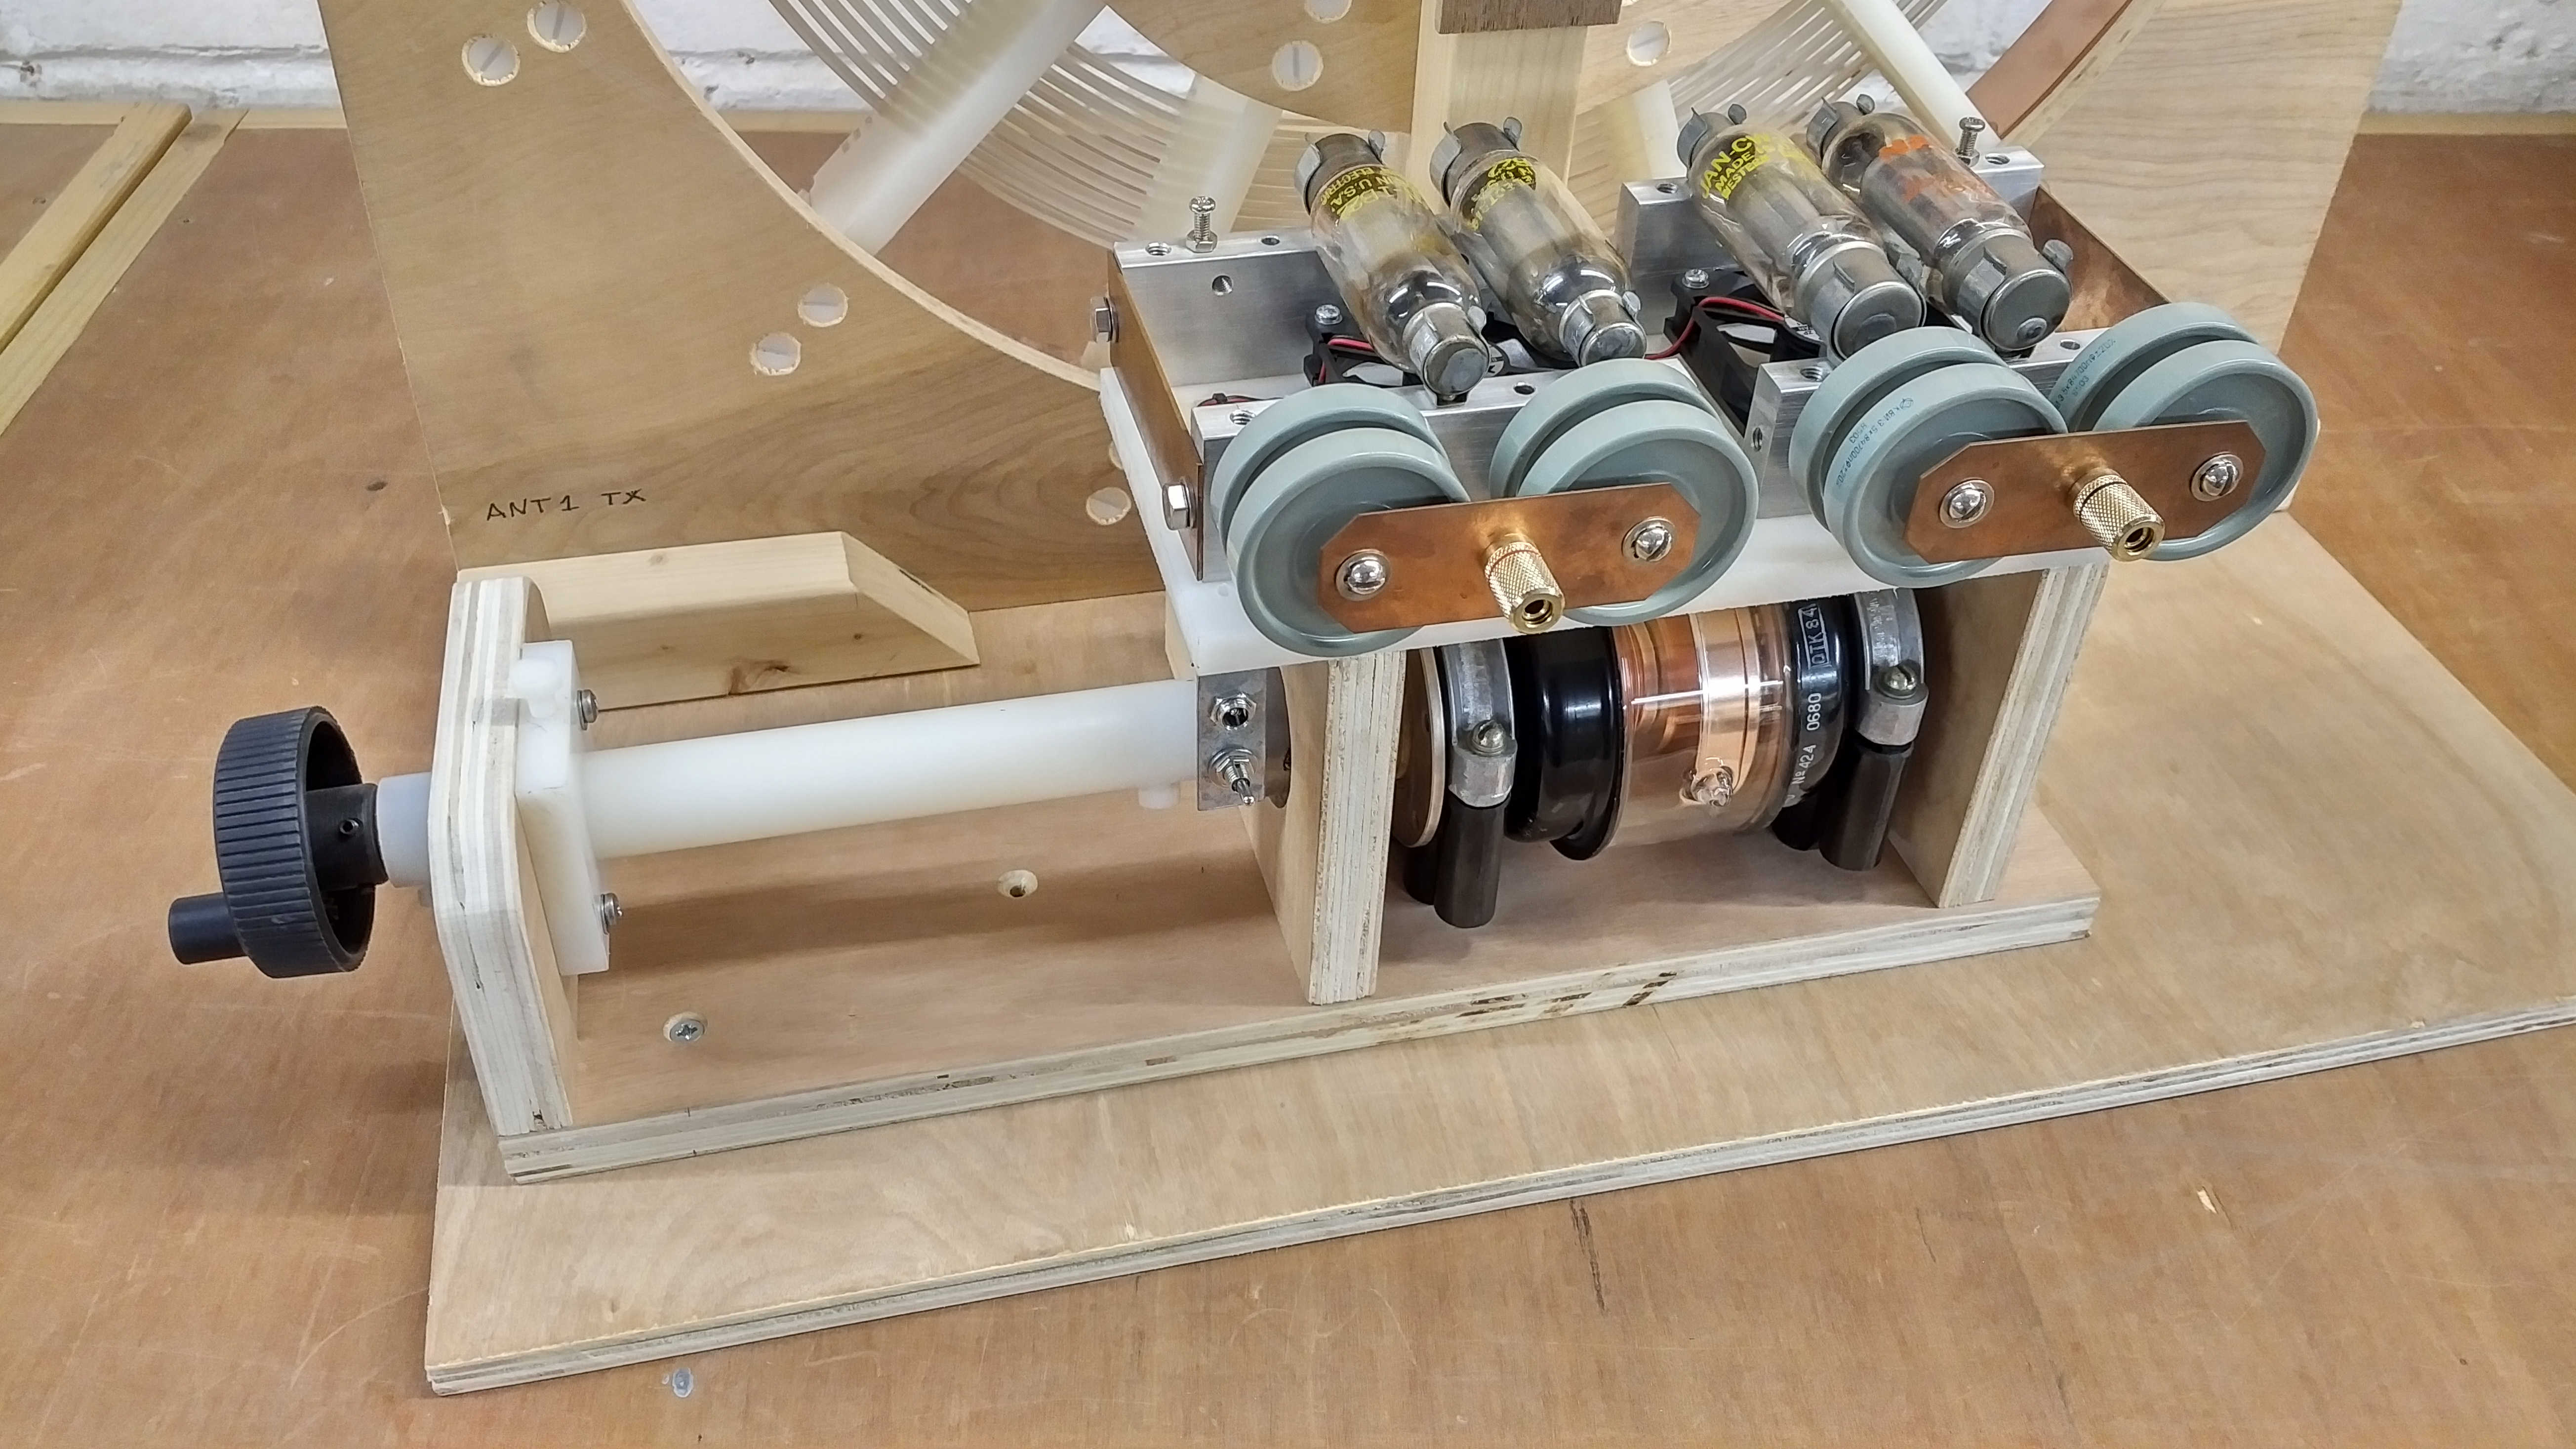
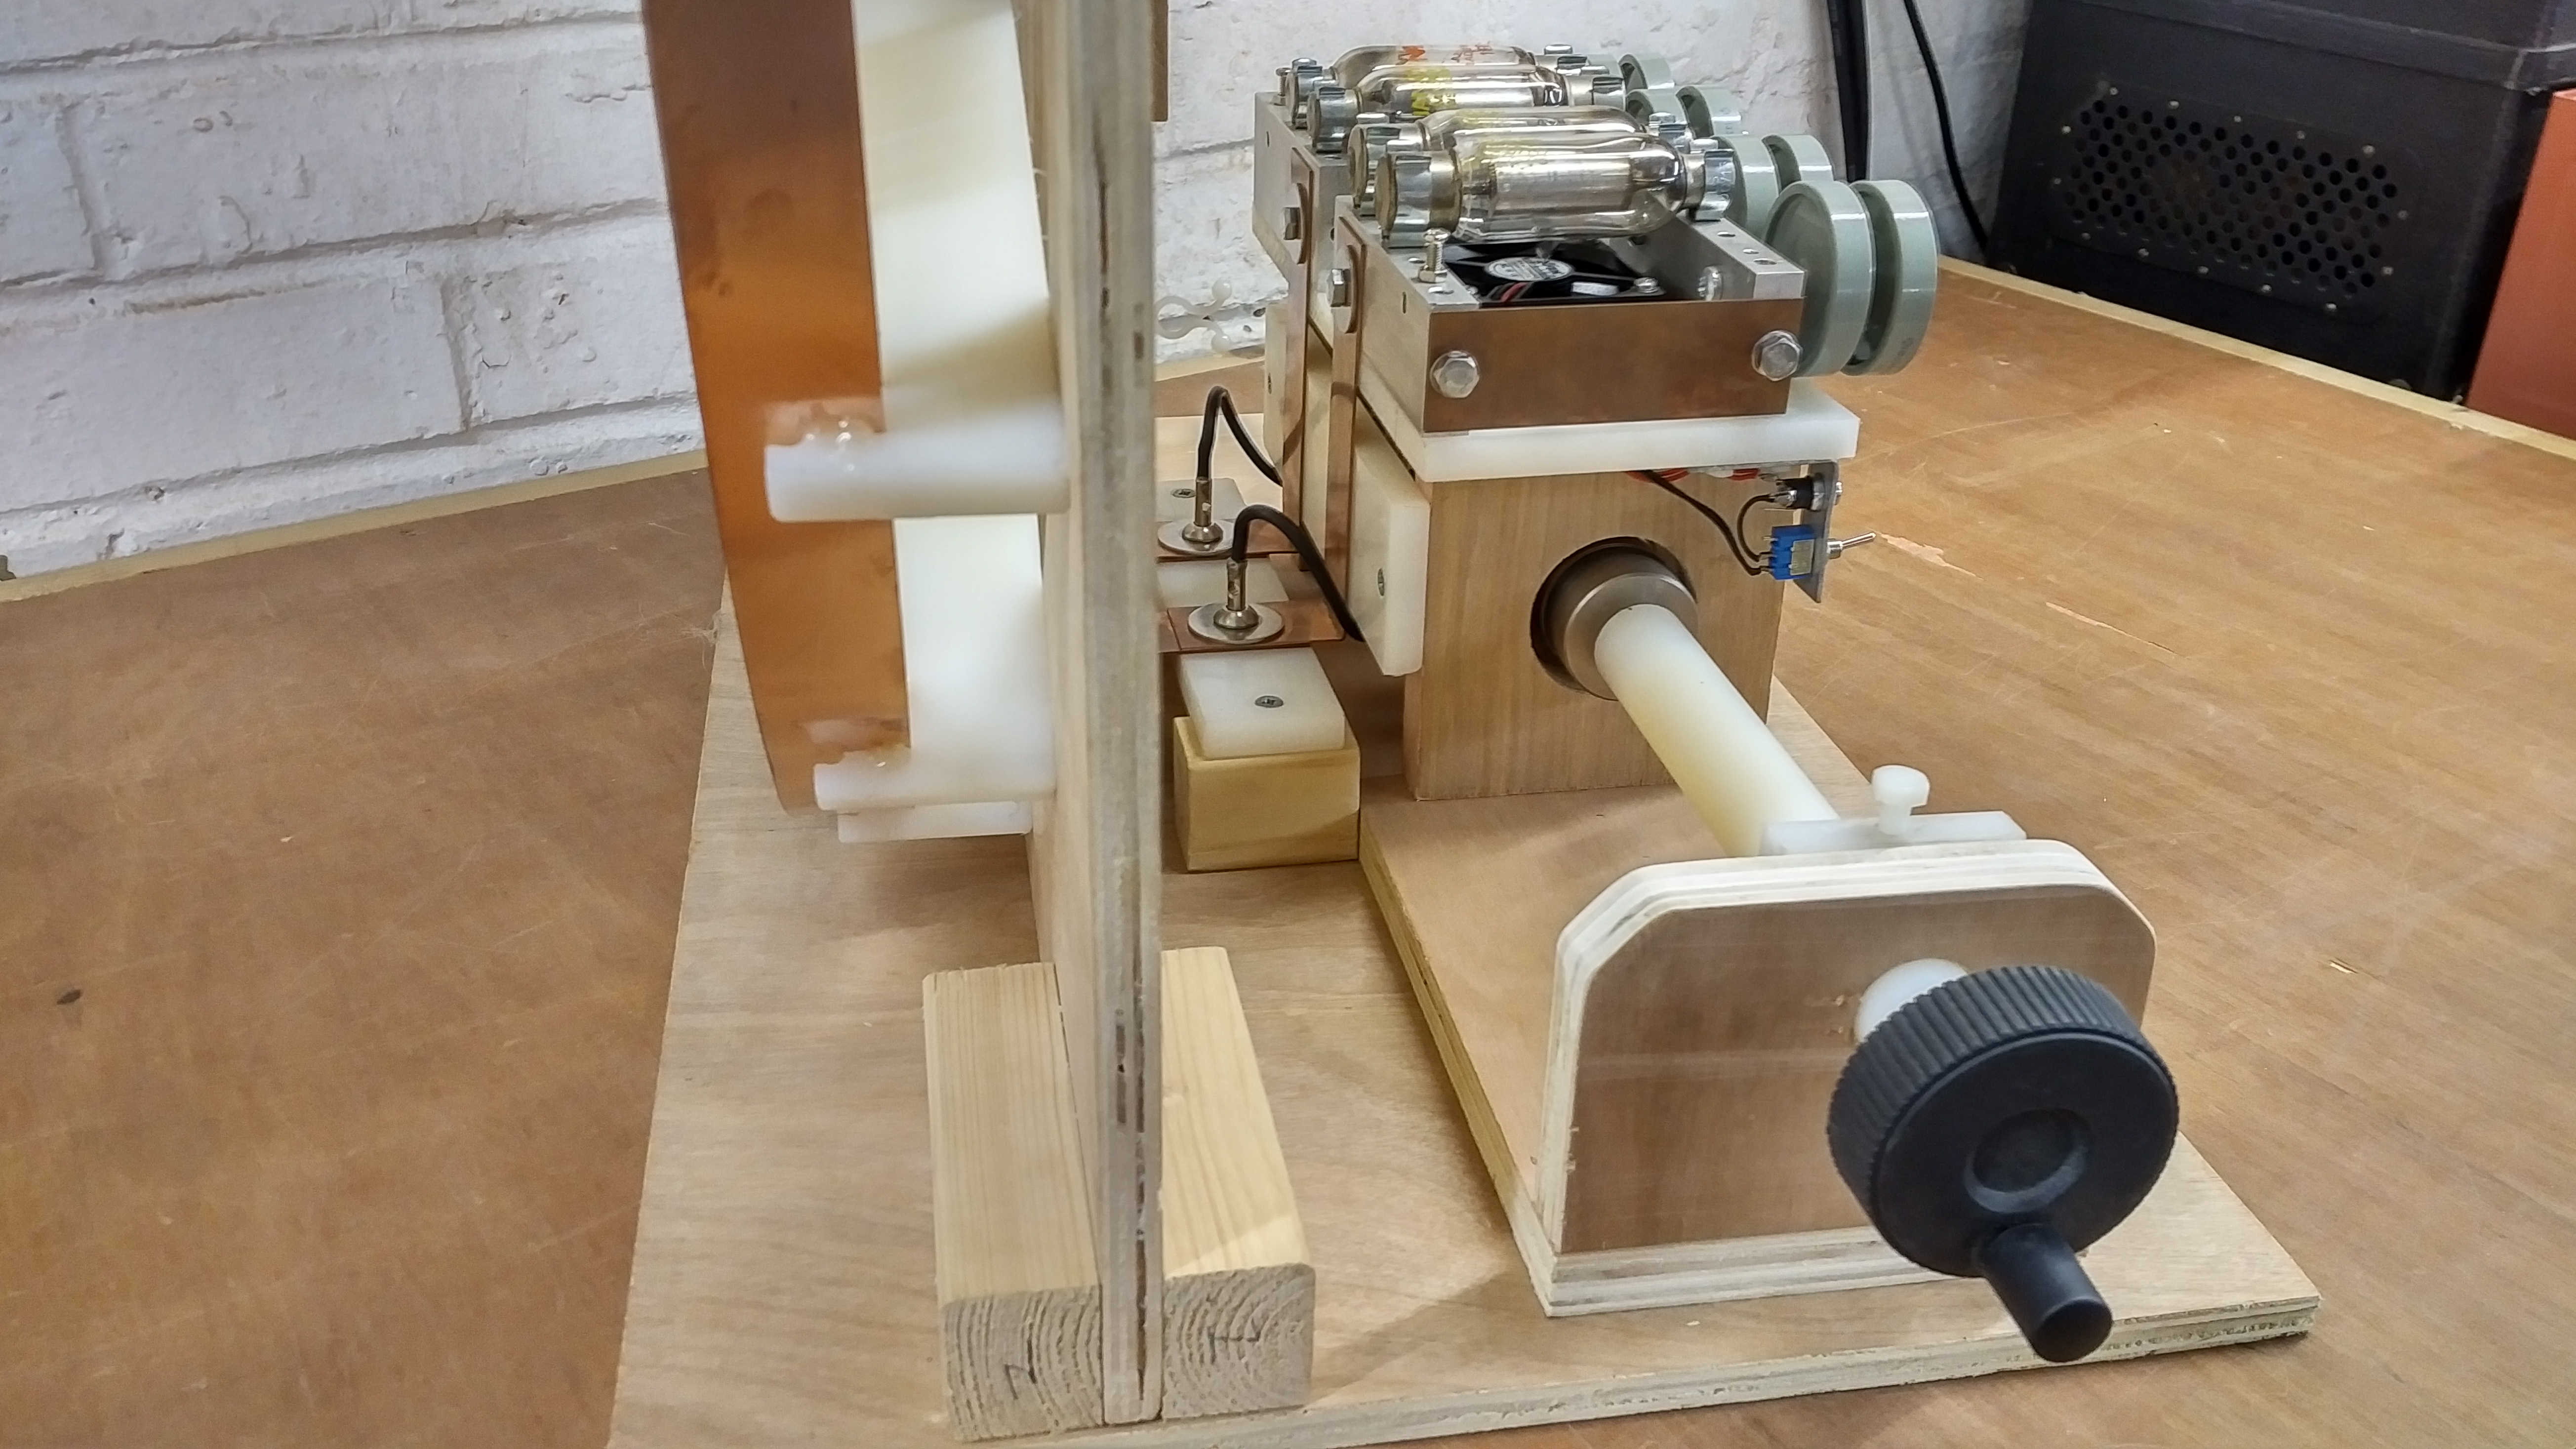
Figures 1. show the generator connected flat coil 1S-3P to be used in the single wire current experiments, and including the primary tuning circuit with primary capacitance CP, in this case a 4kV vacuum capacitor:


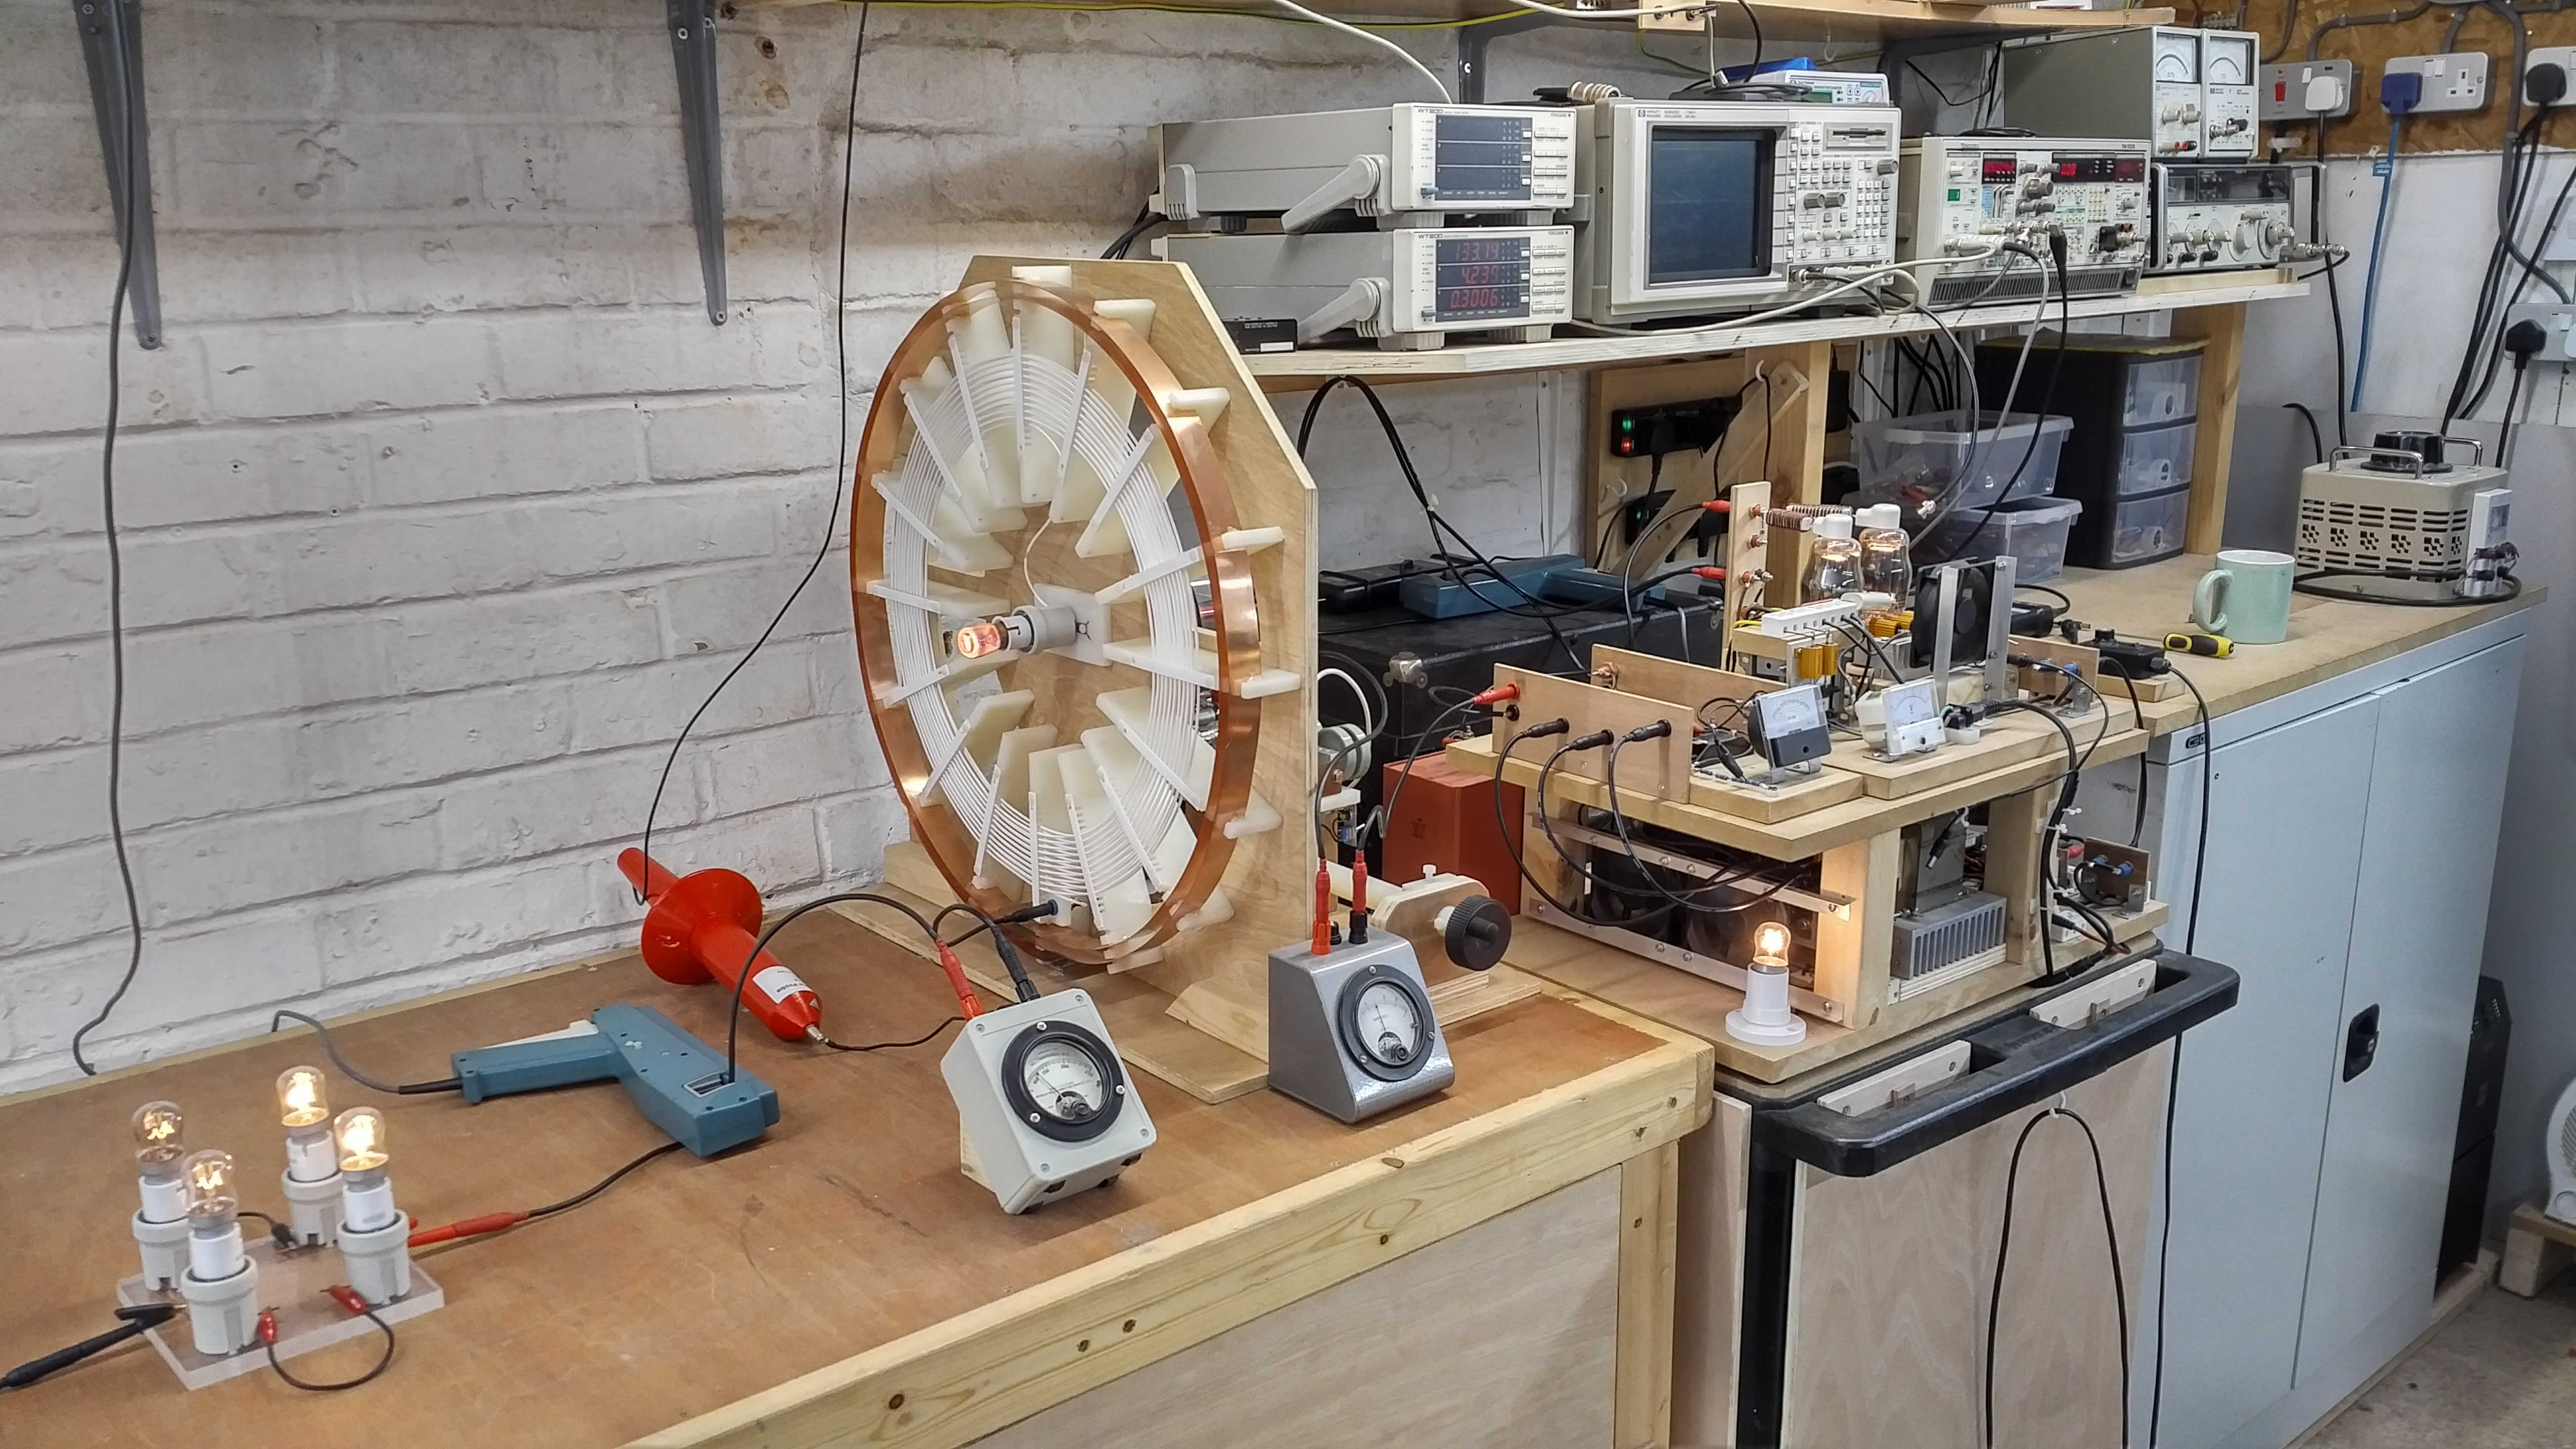
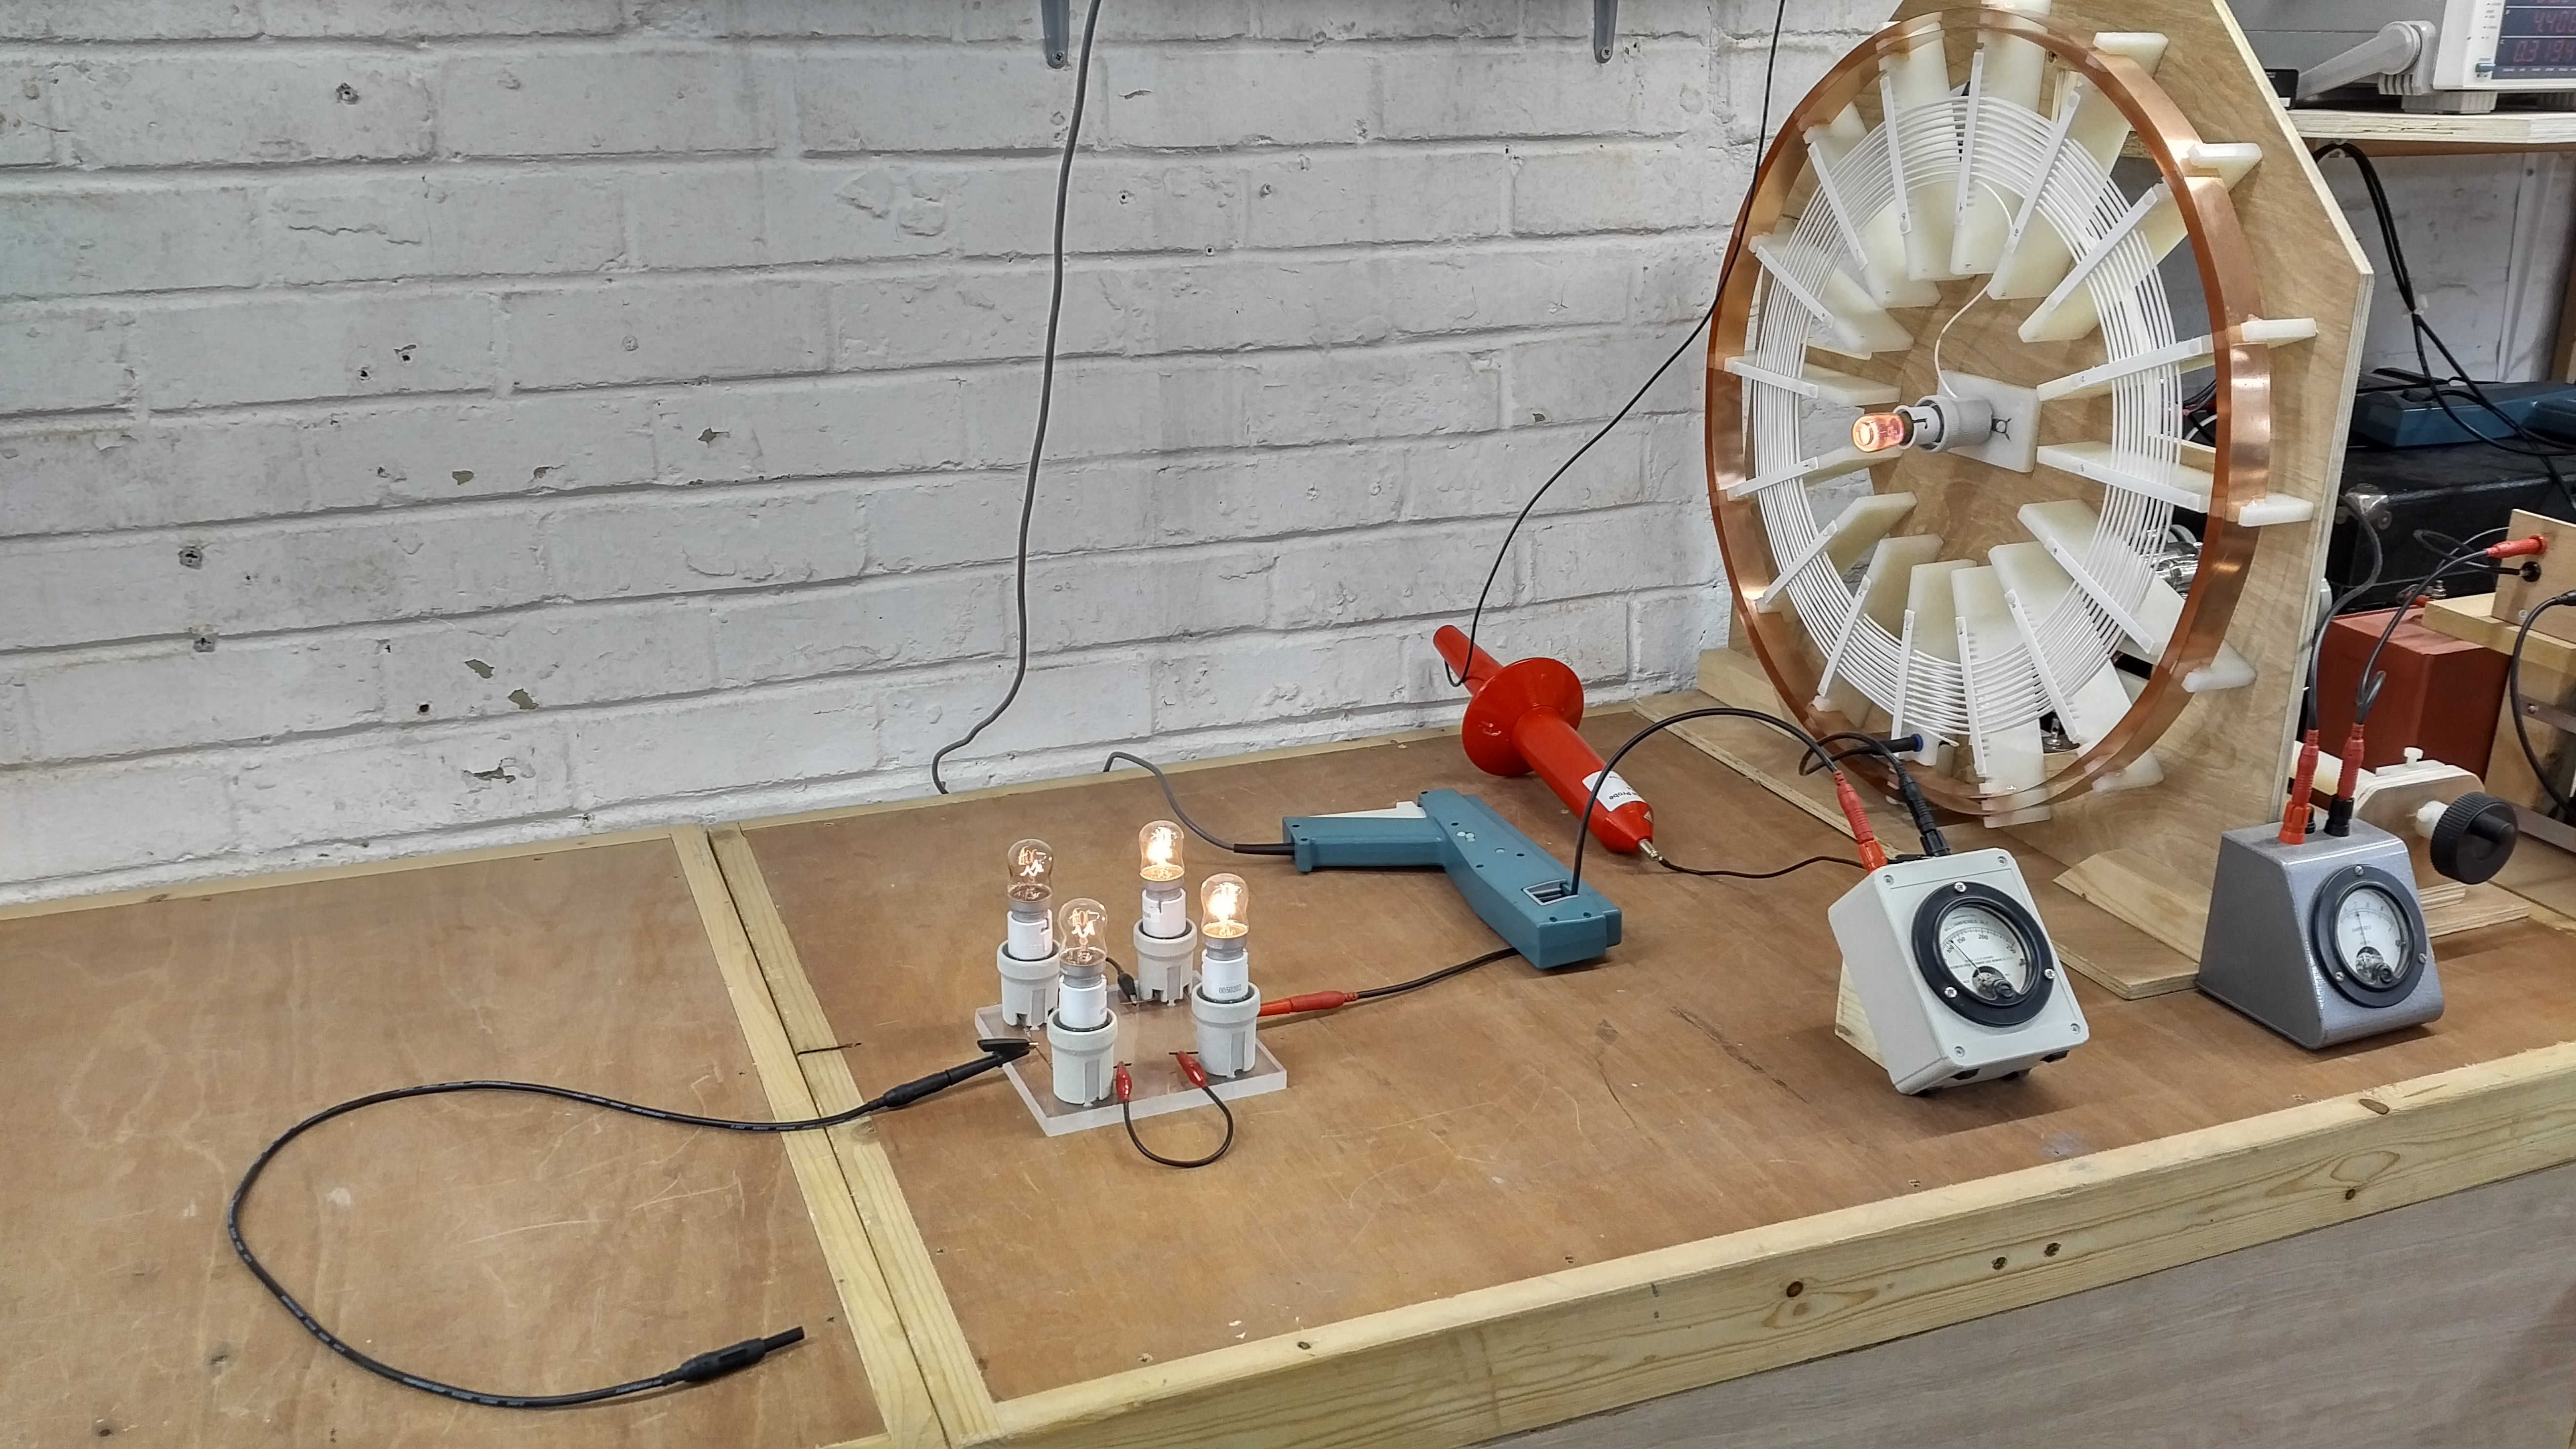
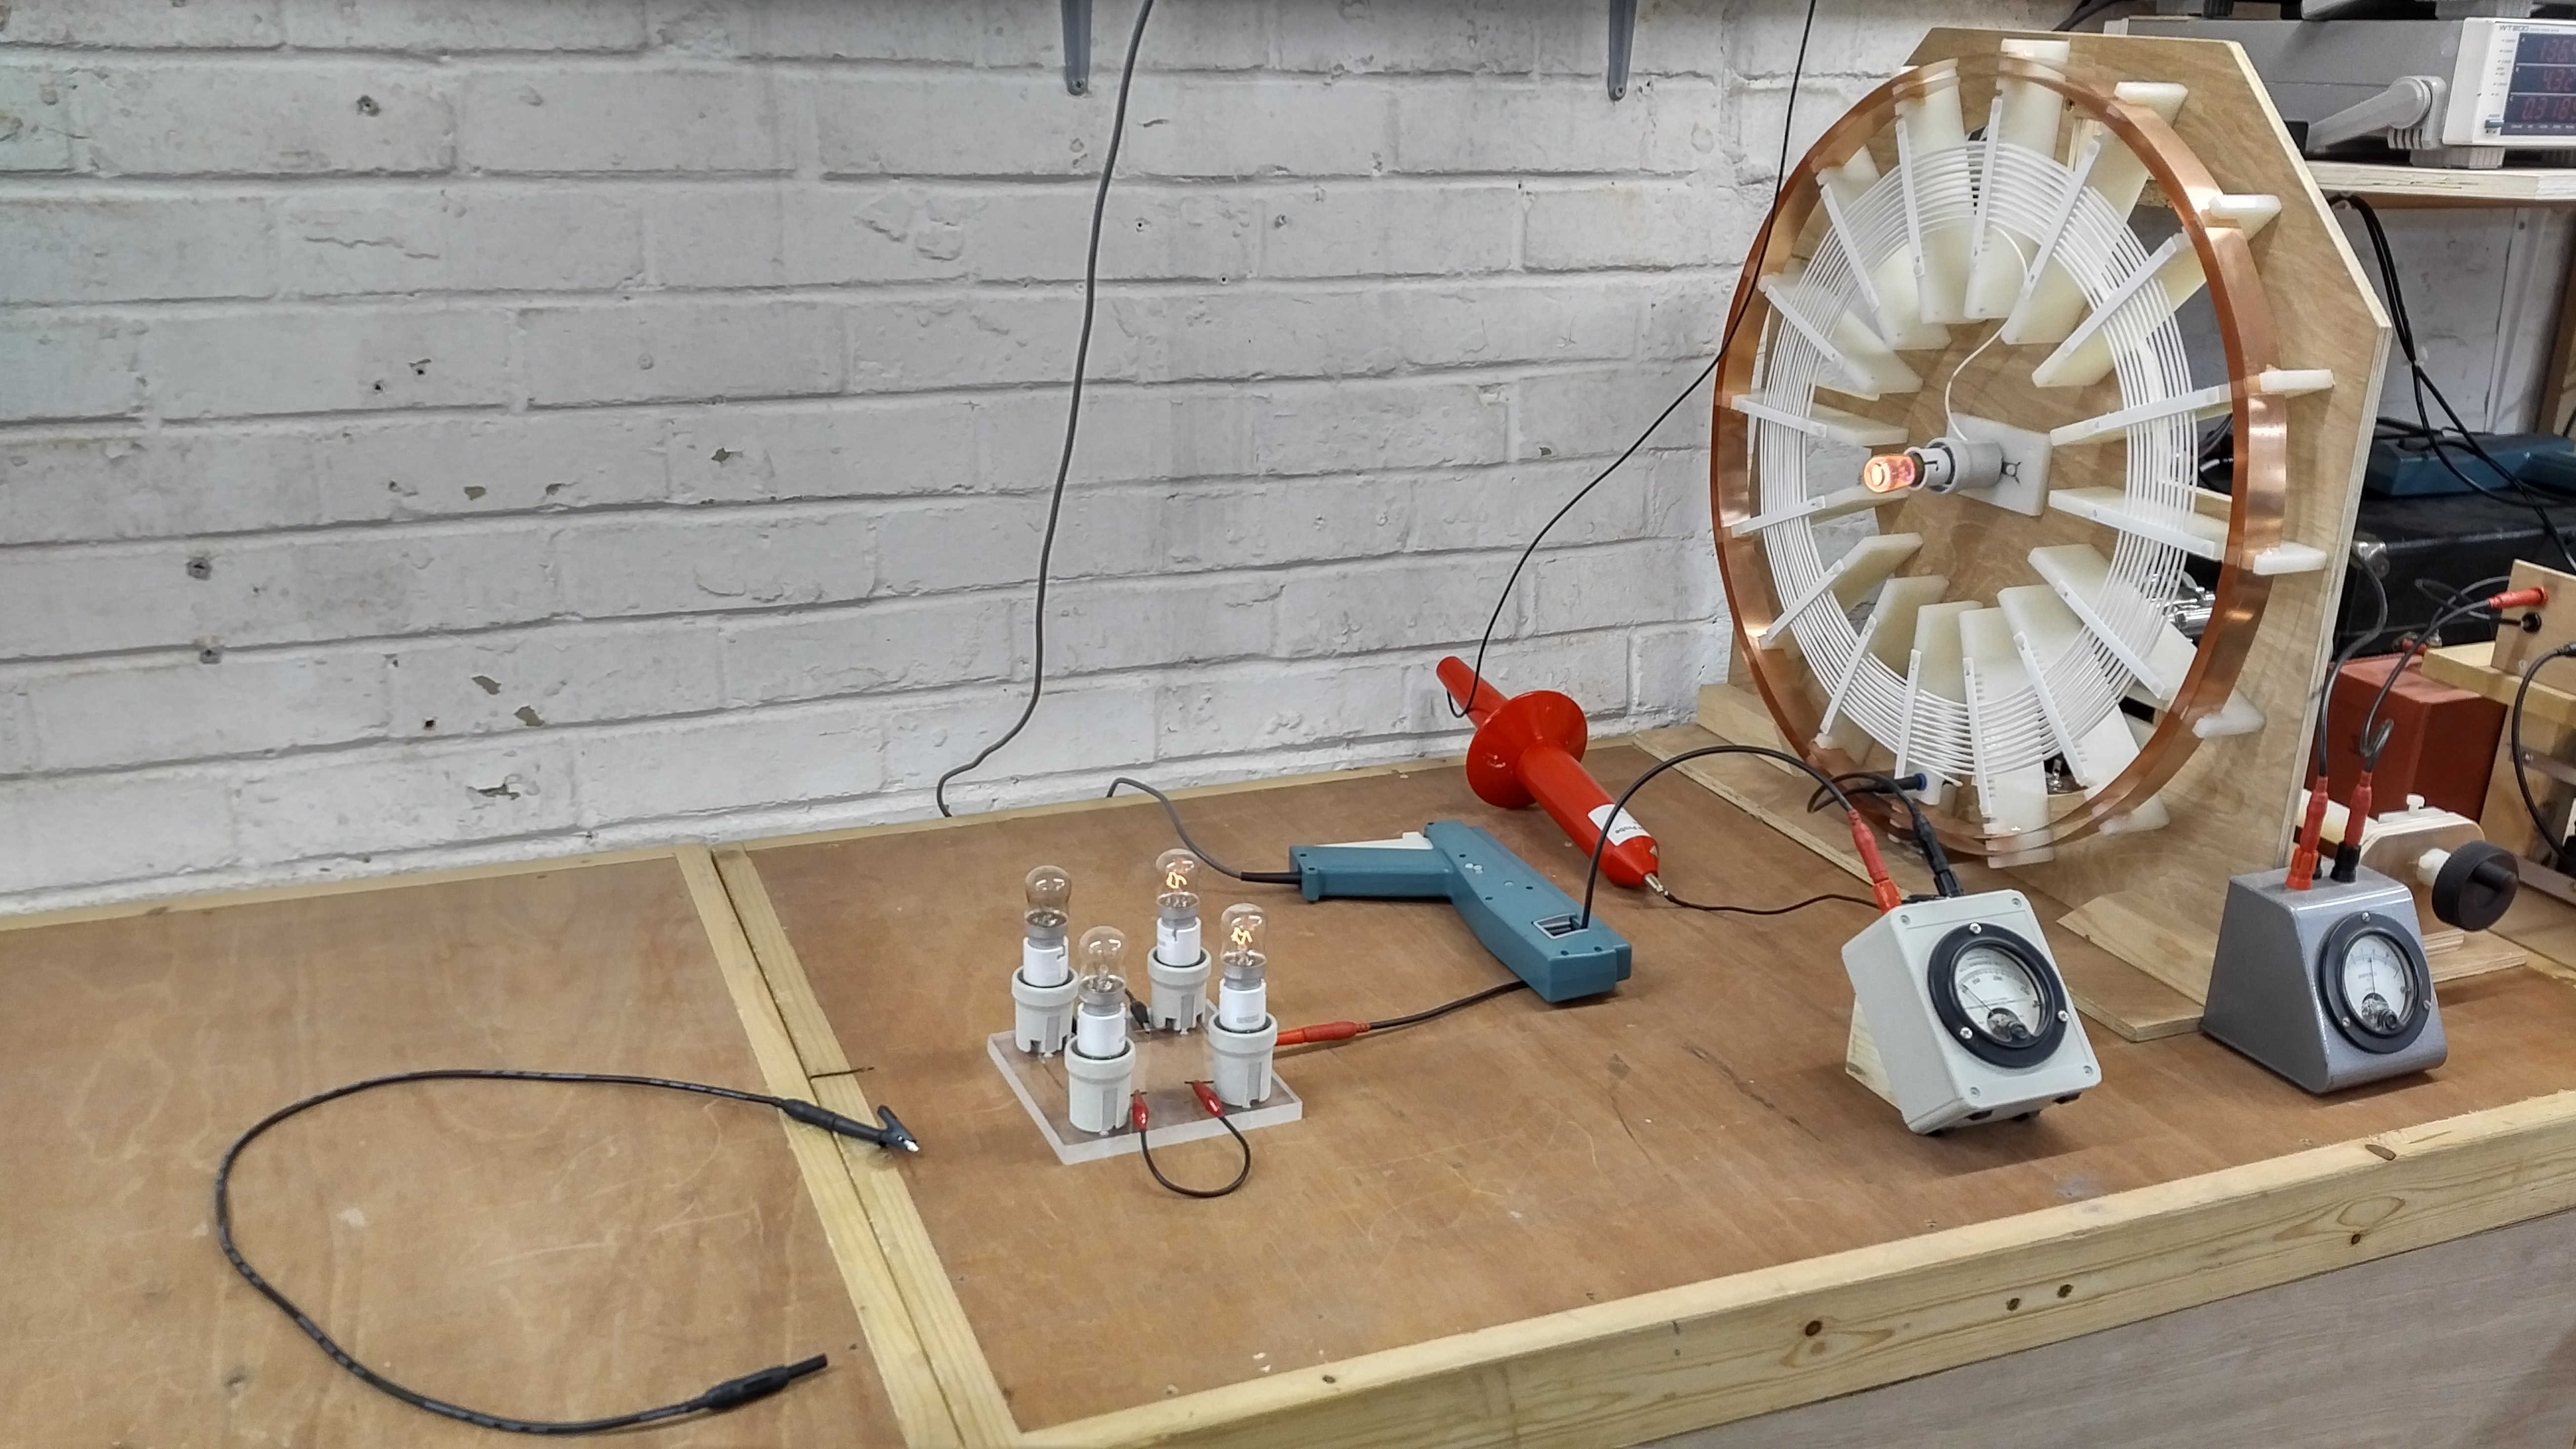
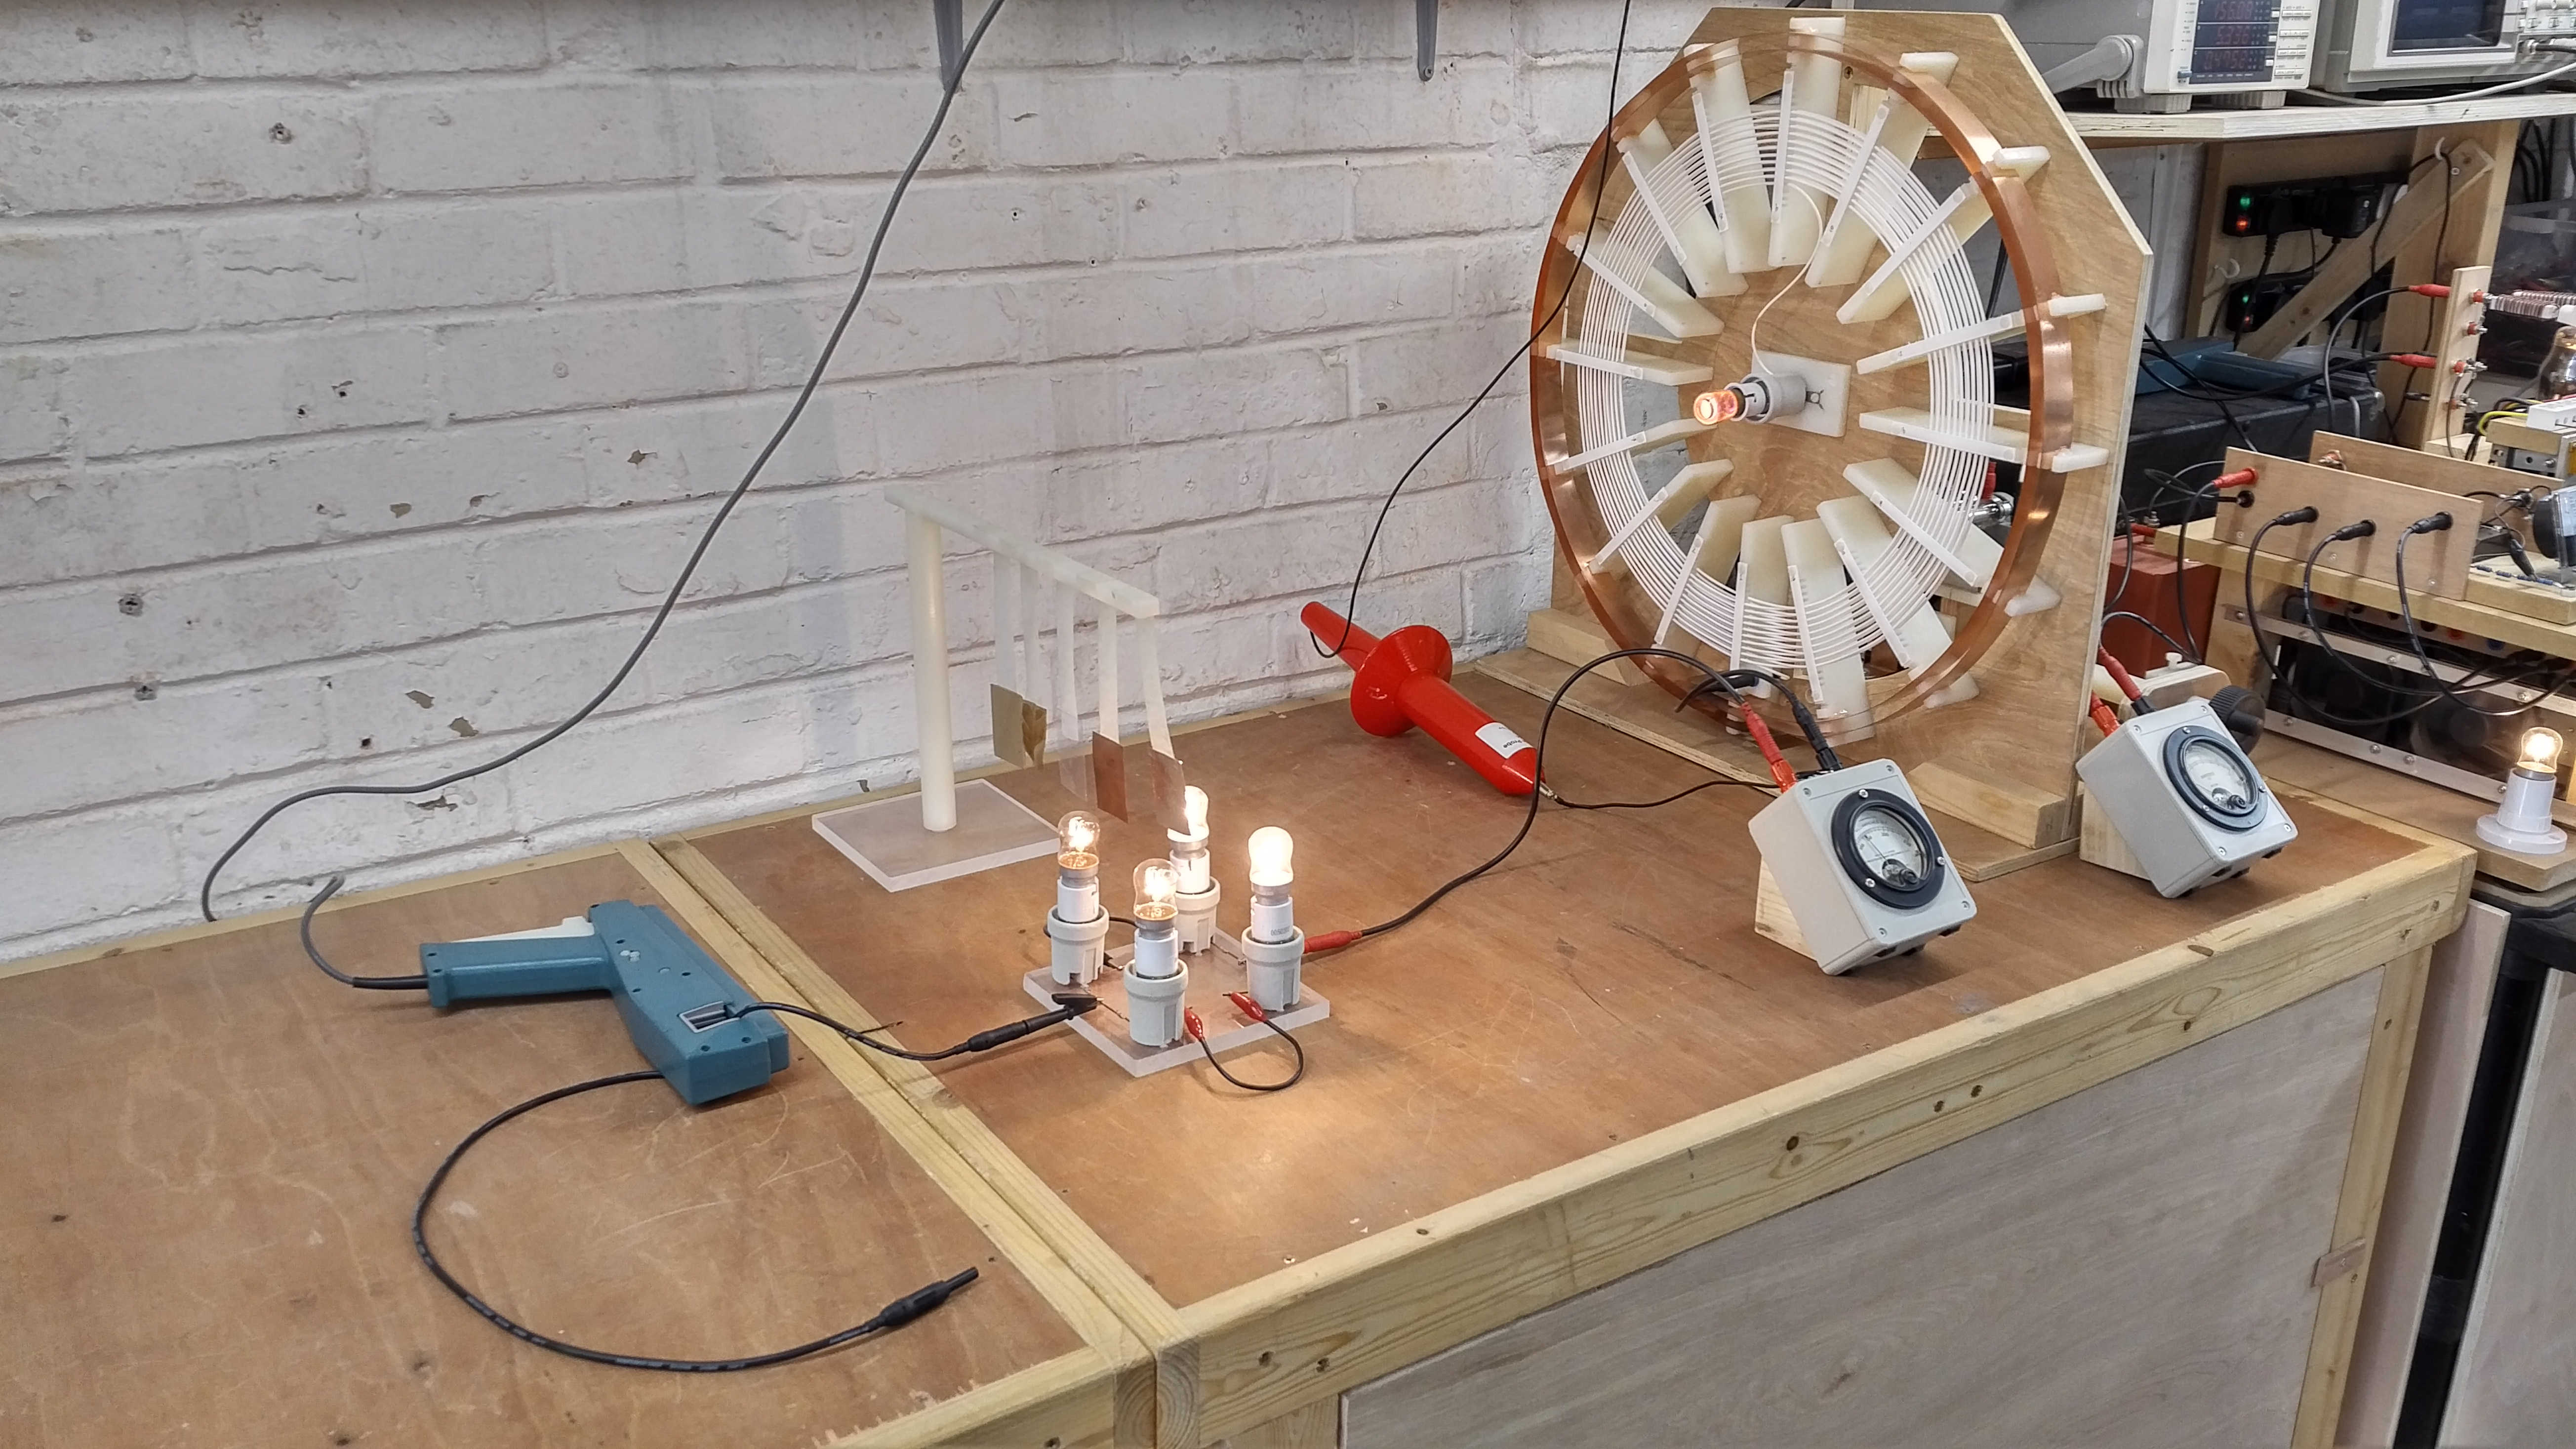
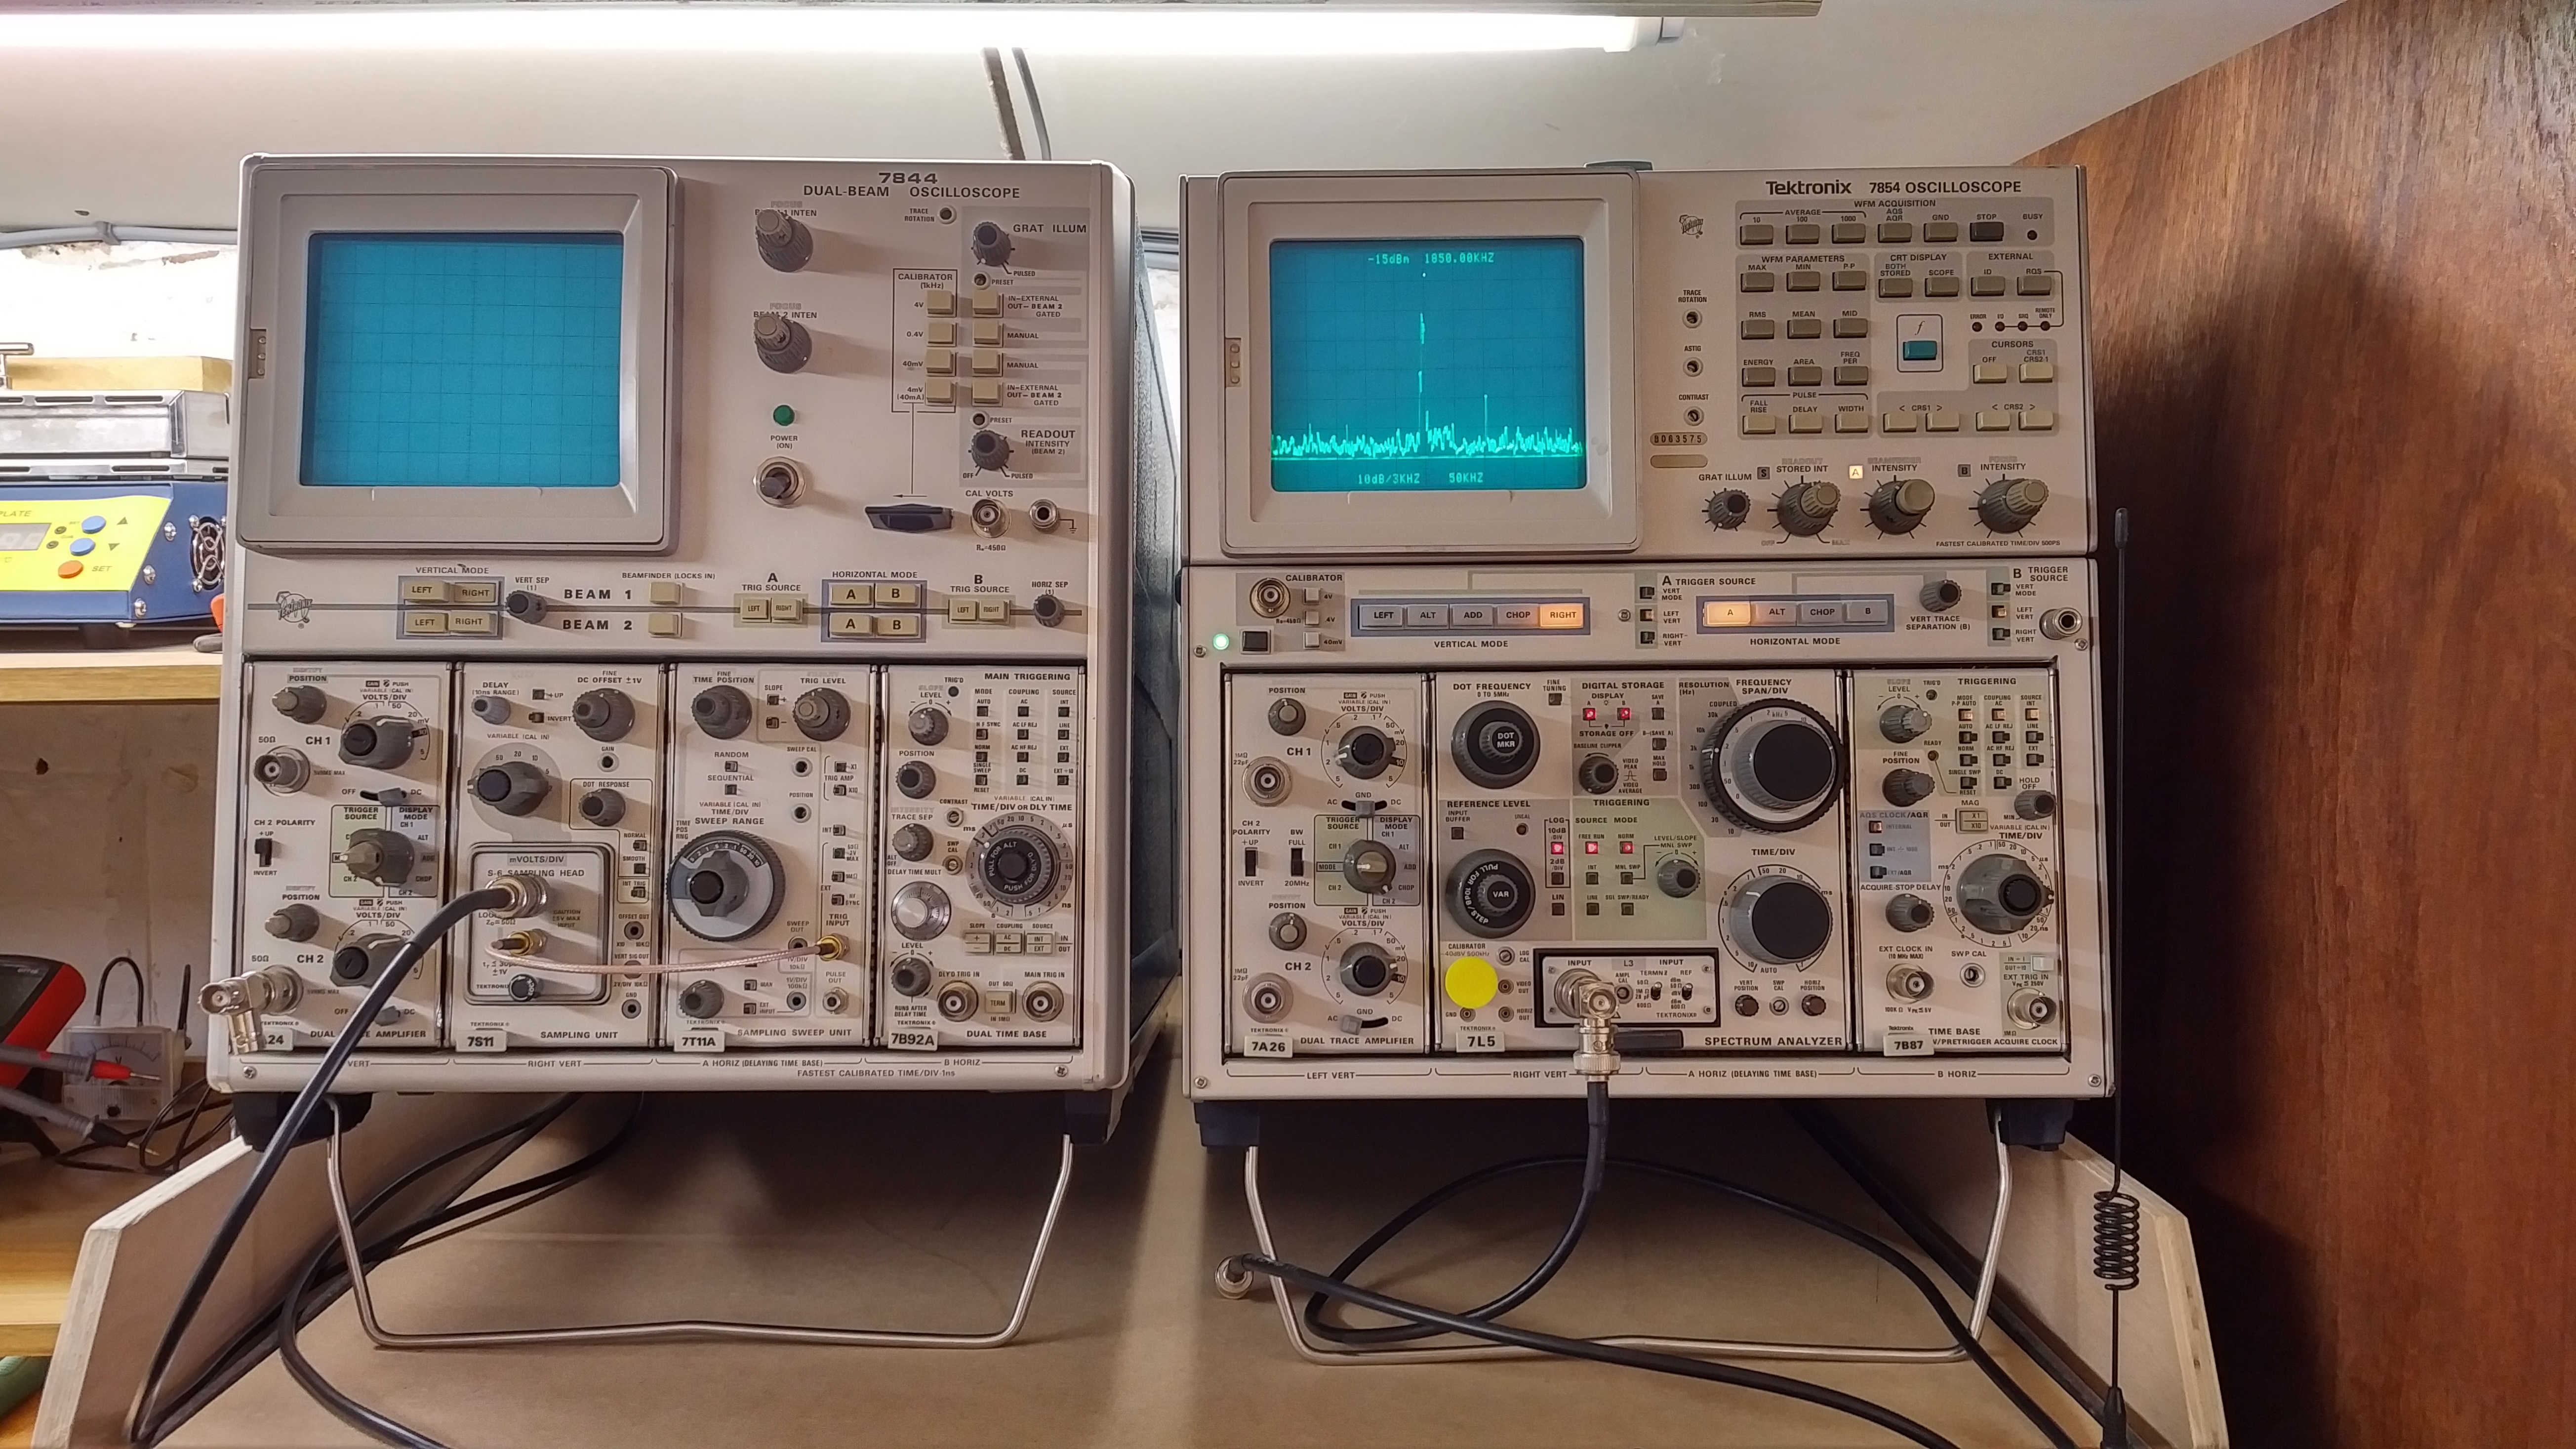
Figures 2. show the single wire current experimental apparatus, including measurement equipment and probes:


To view the large images in a new window whilst reading the explanations click on the figure numbers below:
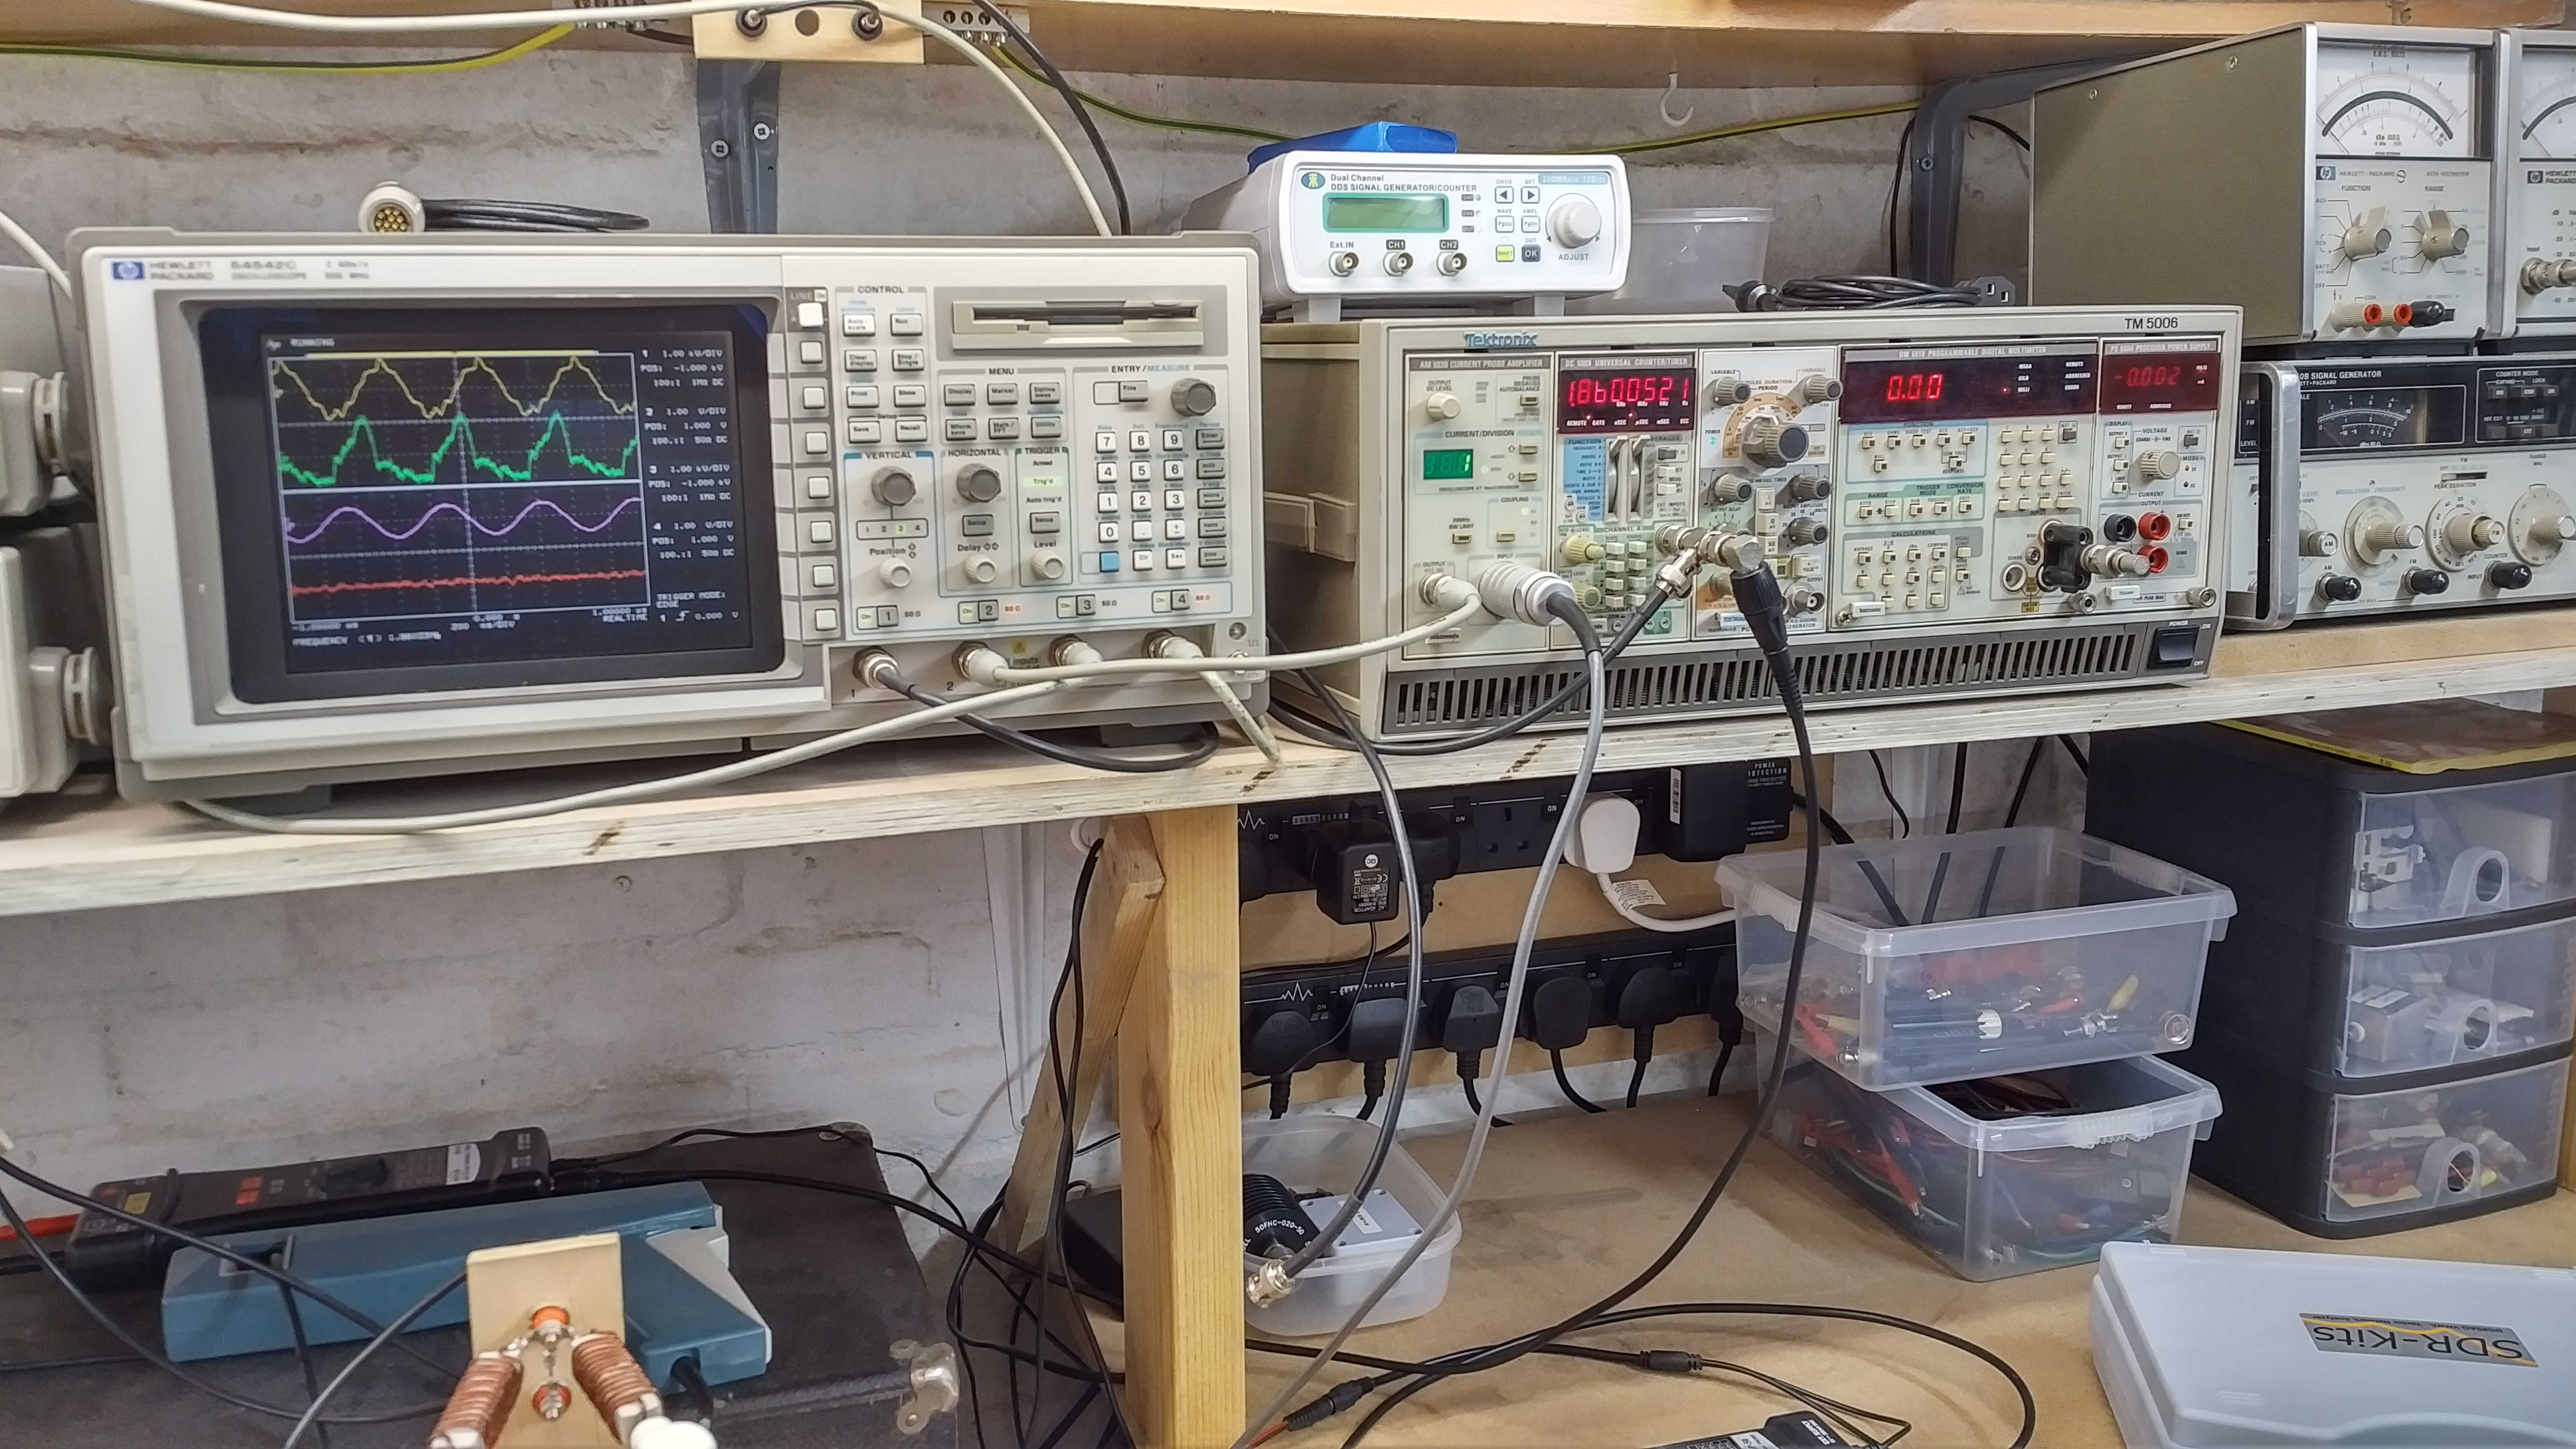
Fig 2.1. Shows the overall experimental apparatus, measurement probes, and equipment. The vacuum tube generator feeds the connections to the tuning unit with the primary capacitance. A high voltage differential probe Pintech DP-50 is connected across the primary capacitance to show the electric potential VP applied across its terminals. A current probe Tektronix A6303 is connected around the wire between the primary capacitor and the plates of the vacuum tubes to show the electric current IP moving through the primary circuit. Inserted between the high voltage tank capacitor and the input to the primary is a Weston model 425 rf ammeter (either 1A or 5A full scale deflection (fsd) dependent on generator output, and with internal thermocouple), to additionally monitor the primary rf currents IPRF.
In the secondary circuit the top-end of the flat coil is terminated with a 240V 5W (UK standard) neon bulb to act as an indicator of the magnitude of induced electric potential or tension, and to contain the top-end with a defined impedance. This containment assists in stabilising the resonant cavity formed by the secondary coil, and without significantly loading the coil and effecting the upper and lower resonant frequencies, or the Q-factor. The bottom-end of the secondary coil is connected by short wire to another Weston model 425 rf ammeter (250mA fsd) combined with a parallel 5Ω shunt to make 500mA fsd and to monitor the secondary rf currents ISRF.
The bottom-end of the coil is also connected to a high-voltage probe Pintech HVP40 40kV 1000:1 passive probe to monitor the secondary potential VS at the lower terminal. The output of the secondary ammeter is connected to the load, which in this case is 4 x 240V 25W (UK standard) pygmy bulbs with vertically laced filaments. The bulbs can be connected in a variety of arrangements, but were here used in a two parallel twin series connected arrangement so that all 4 bulbs will light as the load. The output of the load was connected to an 80cm flying lead. Secondary current IS was monitored in various places using a second Tektronix A6303 current probe.
The outputs of probes VP and IP from the primary, and VS and IS from the secondary, were passed to the inputs a four input oscilloscope HP54542C for measurement and comparison. In addition the signal VP was fed to a Tektronix DC5009 Universal Counter to confirm the oscillation frequency of the primary circuit. This frequency of oscillation was also monitored via a Tektronix 7L5 spectrum analyser fed by a small whip antenna at the input. Throughout the experiment the Tektronix current probes 2 x A6303 connected to AM503B current probe amplifiers were set on 1A AC /division. The total input power to generator PIN, (input to the high voltage transformers only), was monitored using a Yokogawa WT200 digital power meter.
Fig 2.2. Shows that at an input power of PIN = 319W @ 1851kc/s, IPRF ~ 700mA, ISRF ~ 240mA (2 x 120), and a 80cm fly lead connected to the output of the load bulbs, that all the bulbs are lit with the first two bulbs being lit brightly whilst the second two bulbs are only dimly lit. The measured waveforms will be considered in more detail in Figures 3.
Fig 2.3. Shows that under the same electrical conditions with the fly lead removed from the second load bulbs the intensity of the bulbs is greatly reduced. The first set of load bulbs are now dimly lit, whereas the second set of load bulbs are not visibly illuminated. ISRF has also reduced considerably to ~ 100mA (2 x 50mA), whilst IPRF increased slightly to ~ 770mA, at a PIN = 318W @ 1860kc/s. Here the frequency of oscillation has increased slightly due to the reduction in wire length with the fly lead removed, although vacuum tube generator has compensated automatically to shift resonance to the new resonant frequency via the secondary pick-up coil. The most important feature here is that in single wire current experiments loads will not power when no fly lead or terminating lead is connected to their output. In the case of a bulb it will not light when it is the last device connected to the single wire.
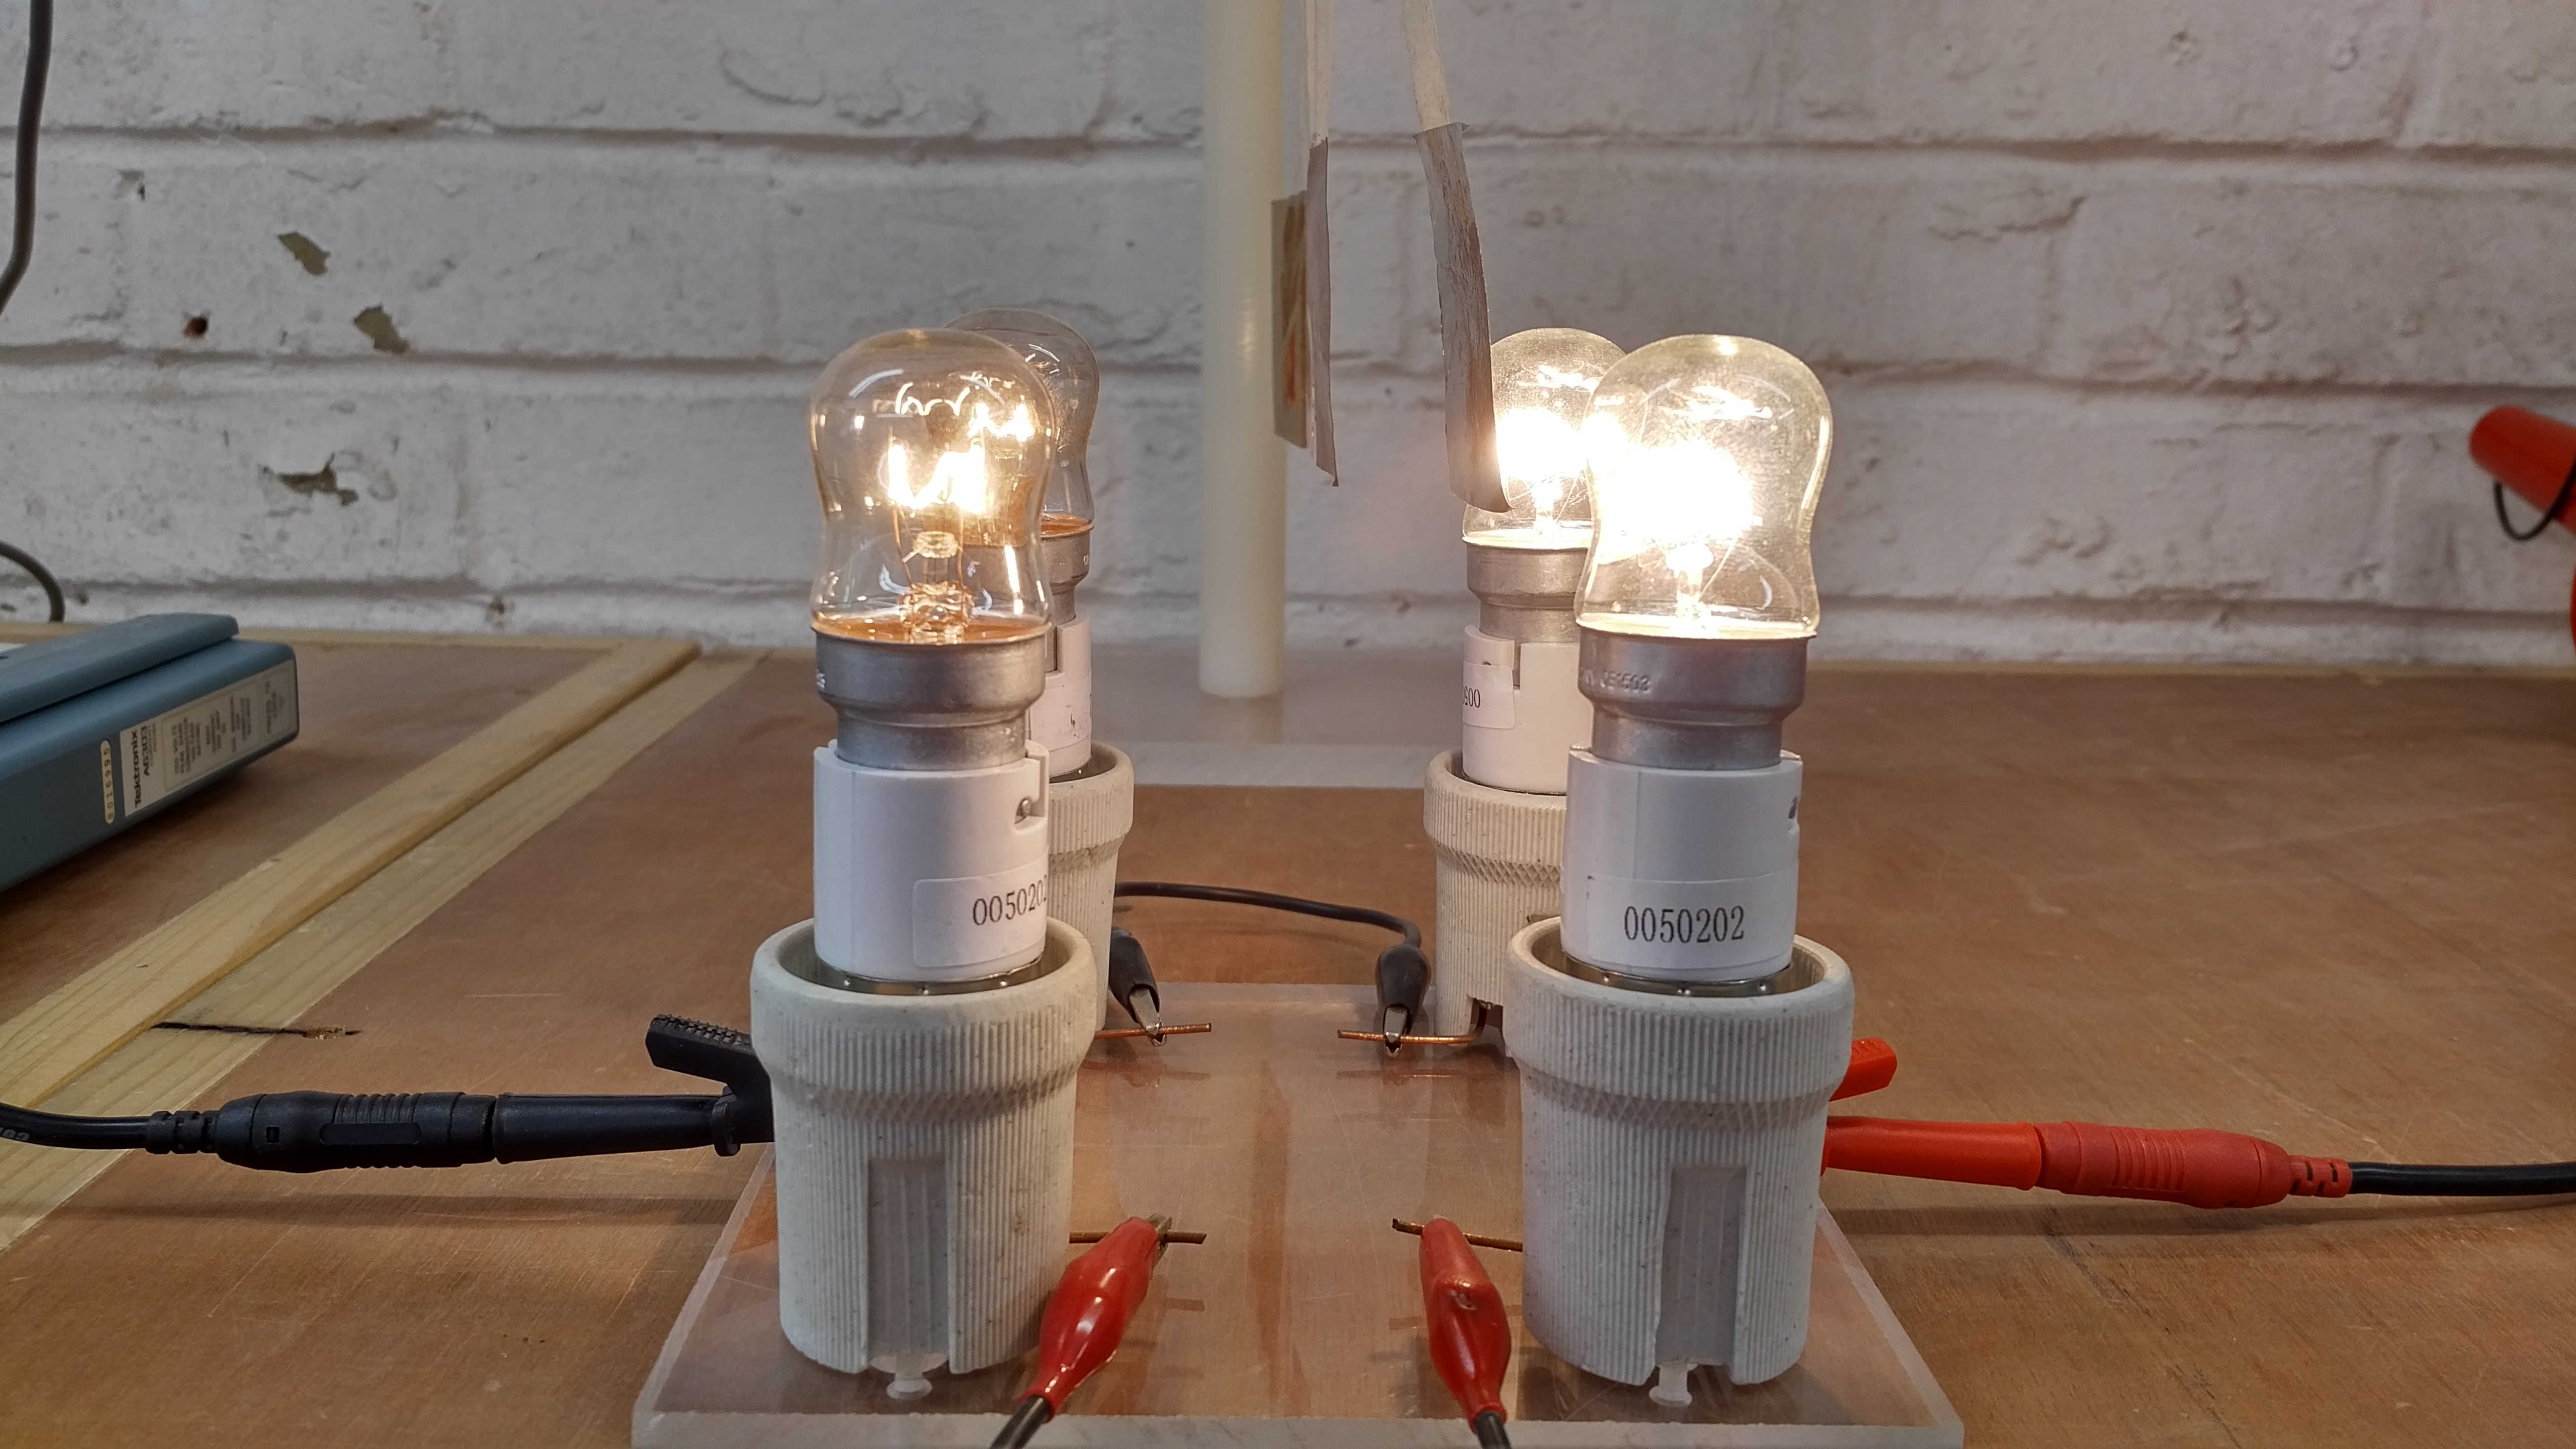
Fig 2.4. Shows the effect of introducing a conductive material close to the load in this case an aluminium leaf suspended by masking tape from an insulated support. Within a certain distance the aluminium leaf is attracted to the bulb outer glass surface and can remain held in this place until the generator is turned off. It appears a force is applied to the aluminium leaf that will move and/or retain the leaf in a distance offset from the vertical. This unusual result has been investigated in a variety of different ways and will be introduced here, to be further investigated and described in subsequent parts.
In the case of the CW vacuum tube generator (VTG-CW) the waveform induced in the secondary circuit is a steady and constant oscillation at a single frequency. This is a very linear and determinate condition and has been found to have the least intensity on the phenomena of attraction of conductive materials. At input powers typically 250W upwards in the experimental apparatus shown the aluminium leaf is very slightly attracted to the bulb glass. If placed only 1mm from the surface then the leaf will be pulled directly from vertical to a point on the glass bulb surface and held there. For distances x between the leaf and the bulb in the range 1mm < x < 15mm, and for the VTG in CW mode, the leaf can be held in place when initially placed on the bulb surface. Above ~15mm the aluminium leaf will not be retained on the bulb surface but will swing back to the vertical position.
The magnitude of the force applied to the aluminium leaf increases with the input power PIN to the generator and hence ISRF in the secondary wire. The overall effect is similar to observing a magnetic metal attracted to a magnet at close range, or the effect of electrostatic attraction in the case of opposite charged metal plates spaced slightly apart. In this case however it appears that the effect is based on the electric field of induction being dominant in the scenario rather than magnetic field of induction. When a permanent magnet is introduced into the experiment it has no influence on the attraction of the aluminium leaf either in being attracted towards the bulb, away from it, or being held on the bulb surface.
The intensity of the attraction and hence the magnitude of the applied force on the leaf has been found to increase significantly with burst, impulse, and modulated waveforms. With a burst or impulse waveform from the generator it is easily seen that at PIN > 400W the leaf can be instantly attracted to the bulb and move from the vertical over distances as much as 20mm, and then held there strongly on the surface of the glass. in this case even with the generator turned off the leaf can be retained for up to 60 seconds on the surface of the bulb before being released and swinging back to the horizontal.
Other types of leaf material have also been tested, and those found to readily be attracted and retained to the bulb glass have a conductive element to them, including metals like aluminium and copper, organic materials such as living tissue, plant matter (e.g. leaves), and paper, cardboard, and woods with a certain content of moisture in them. In the case of organic living tissue the presence of my hand in the vicinity of the light bulb, but not touching, greatly increases the effect even in CW mode. For man-made synthetic materials such as plastic and other insulating mediums there is normally no discernible attraction towards the bulb. At very high voltages and high input powers PIN > 1000W a plastic leaf was found to attracted to the bulb surface over a tiny distance < 0.5mm but could not be retained on the surface of the bulb even when placed directly on the surface.
With the aluminium leaf the voltage on the leaf was measured during the process of attraction and was found to rise to a high dc potential usually in the order of several hundred volts in the experiment thus described. This indicates a form of “charging” like the plate of a capacitor when exposed to a dc potential higher or lower than the surrounding environment. In this case the electric field of induction appears to have created a region of potential difference and tension between the material of the leaf, where the leaf has become “charged” to an opposite polarity than that present on the glass surface of the bulb. It is conjectured here that an electric wavefront (a positive dc level or impulse rather than a varying sinusoid) is emitted from the exposed wire of the bulb filament (itself a tiny extra coil and leading to an imbalance between the magnetic and electric fields of induction). These continuous wavefronts result in charge accumulation on the surface of the conductive material which establishes an electric field between the bulb filament and the conductive material. The electric field results in a force exerted on the aluminium leaf which is pulled towards the glass surface. As the conductors of the filament and the leaf are prevented to come into contact by the glass bulb the electric field is not collapsed by shorting the two together, and the leaf can be retained firmly on the glass surface as it remains “charged” by the presented wavefronts.
It is suggested that the attraction is not likely to be magnetic in nature, and as a result of eddy currents in the conductive material induced by the presence of a time varying magnetic field, as the phenomena cannot be influenced by other magnetic fields in very close vicinity, such as permanent magnets and electromagnets. It would be expected that the magnetic field generated by eddy currents in the leaf would be disturbed by the introduction of a strong permanent magnet, however no such disturbances have been observed or measured.
To eliminate effects due to convection and movement of air due to heating of the glass bulb a control experiment connected the same bulb type, a 240V 25W pygmy bulb, to a normal domestic ac outlet so that it would light to normal intensity and heating. The aluminium leaf was then placed in very close proximity to the bulb surface ~ 0.5mm with no discernible movement towards the bulb over any length of time the control experiment was conducted.
Fig 2.5. Shows in close-up detail the attraction of an aluminium leaf to the surface of the load bulb and being retained on the surface until the generator is turned off. In this case with the VTG in CW mode the attraction is not strong enough to pull the leaf from the vertical over a distance of 15mm to the bulb surface. The applied force is however strong enough to retain the leaf on the surface of the bulb at a distance of 15mm from the vertical, and once placed on the surface of the bulb.
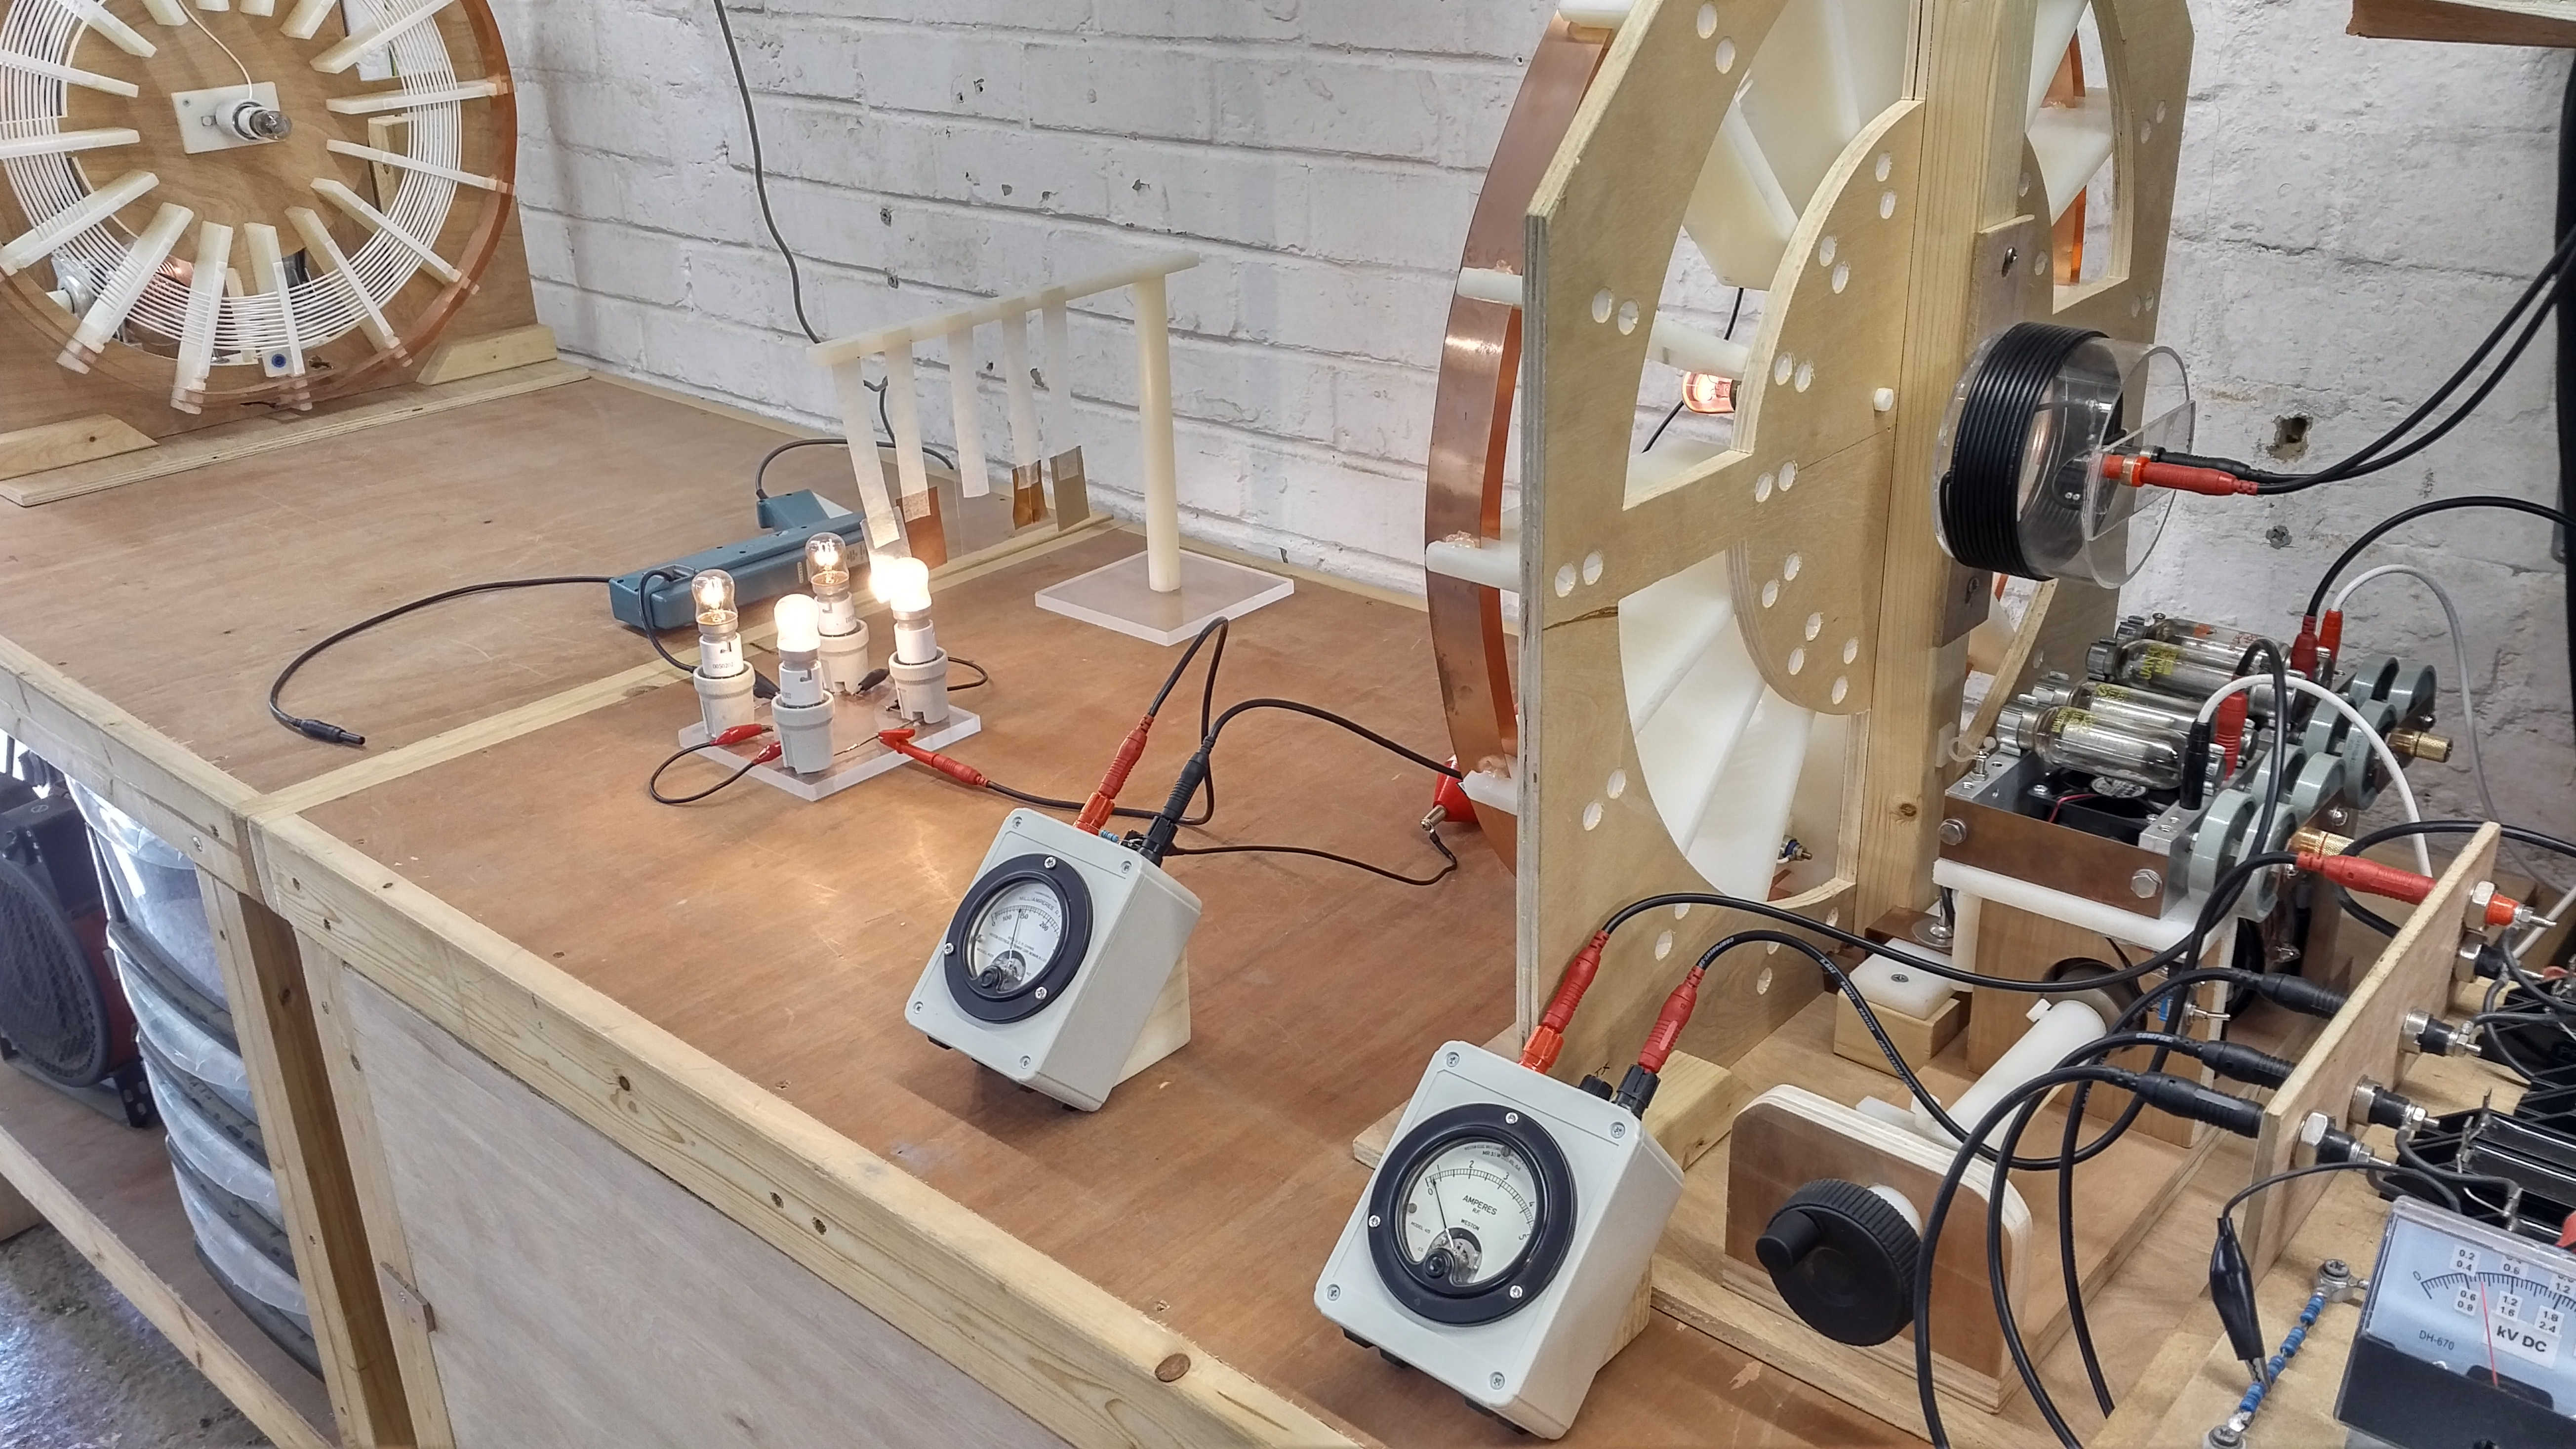
Fig 2.6. Shows the experimental apparatus from the reverse side with the generator attached to the tuning unit, the rf ammeters in the primary and secondary, and the generator tank capacitor meter in the far bottom right showing a tank voltage of ~ 800V dc.
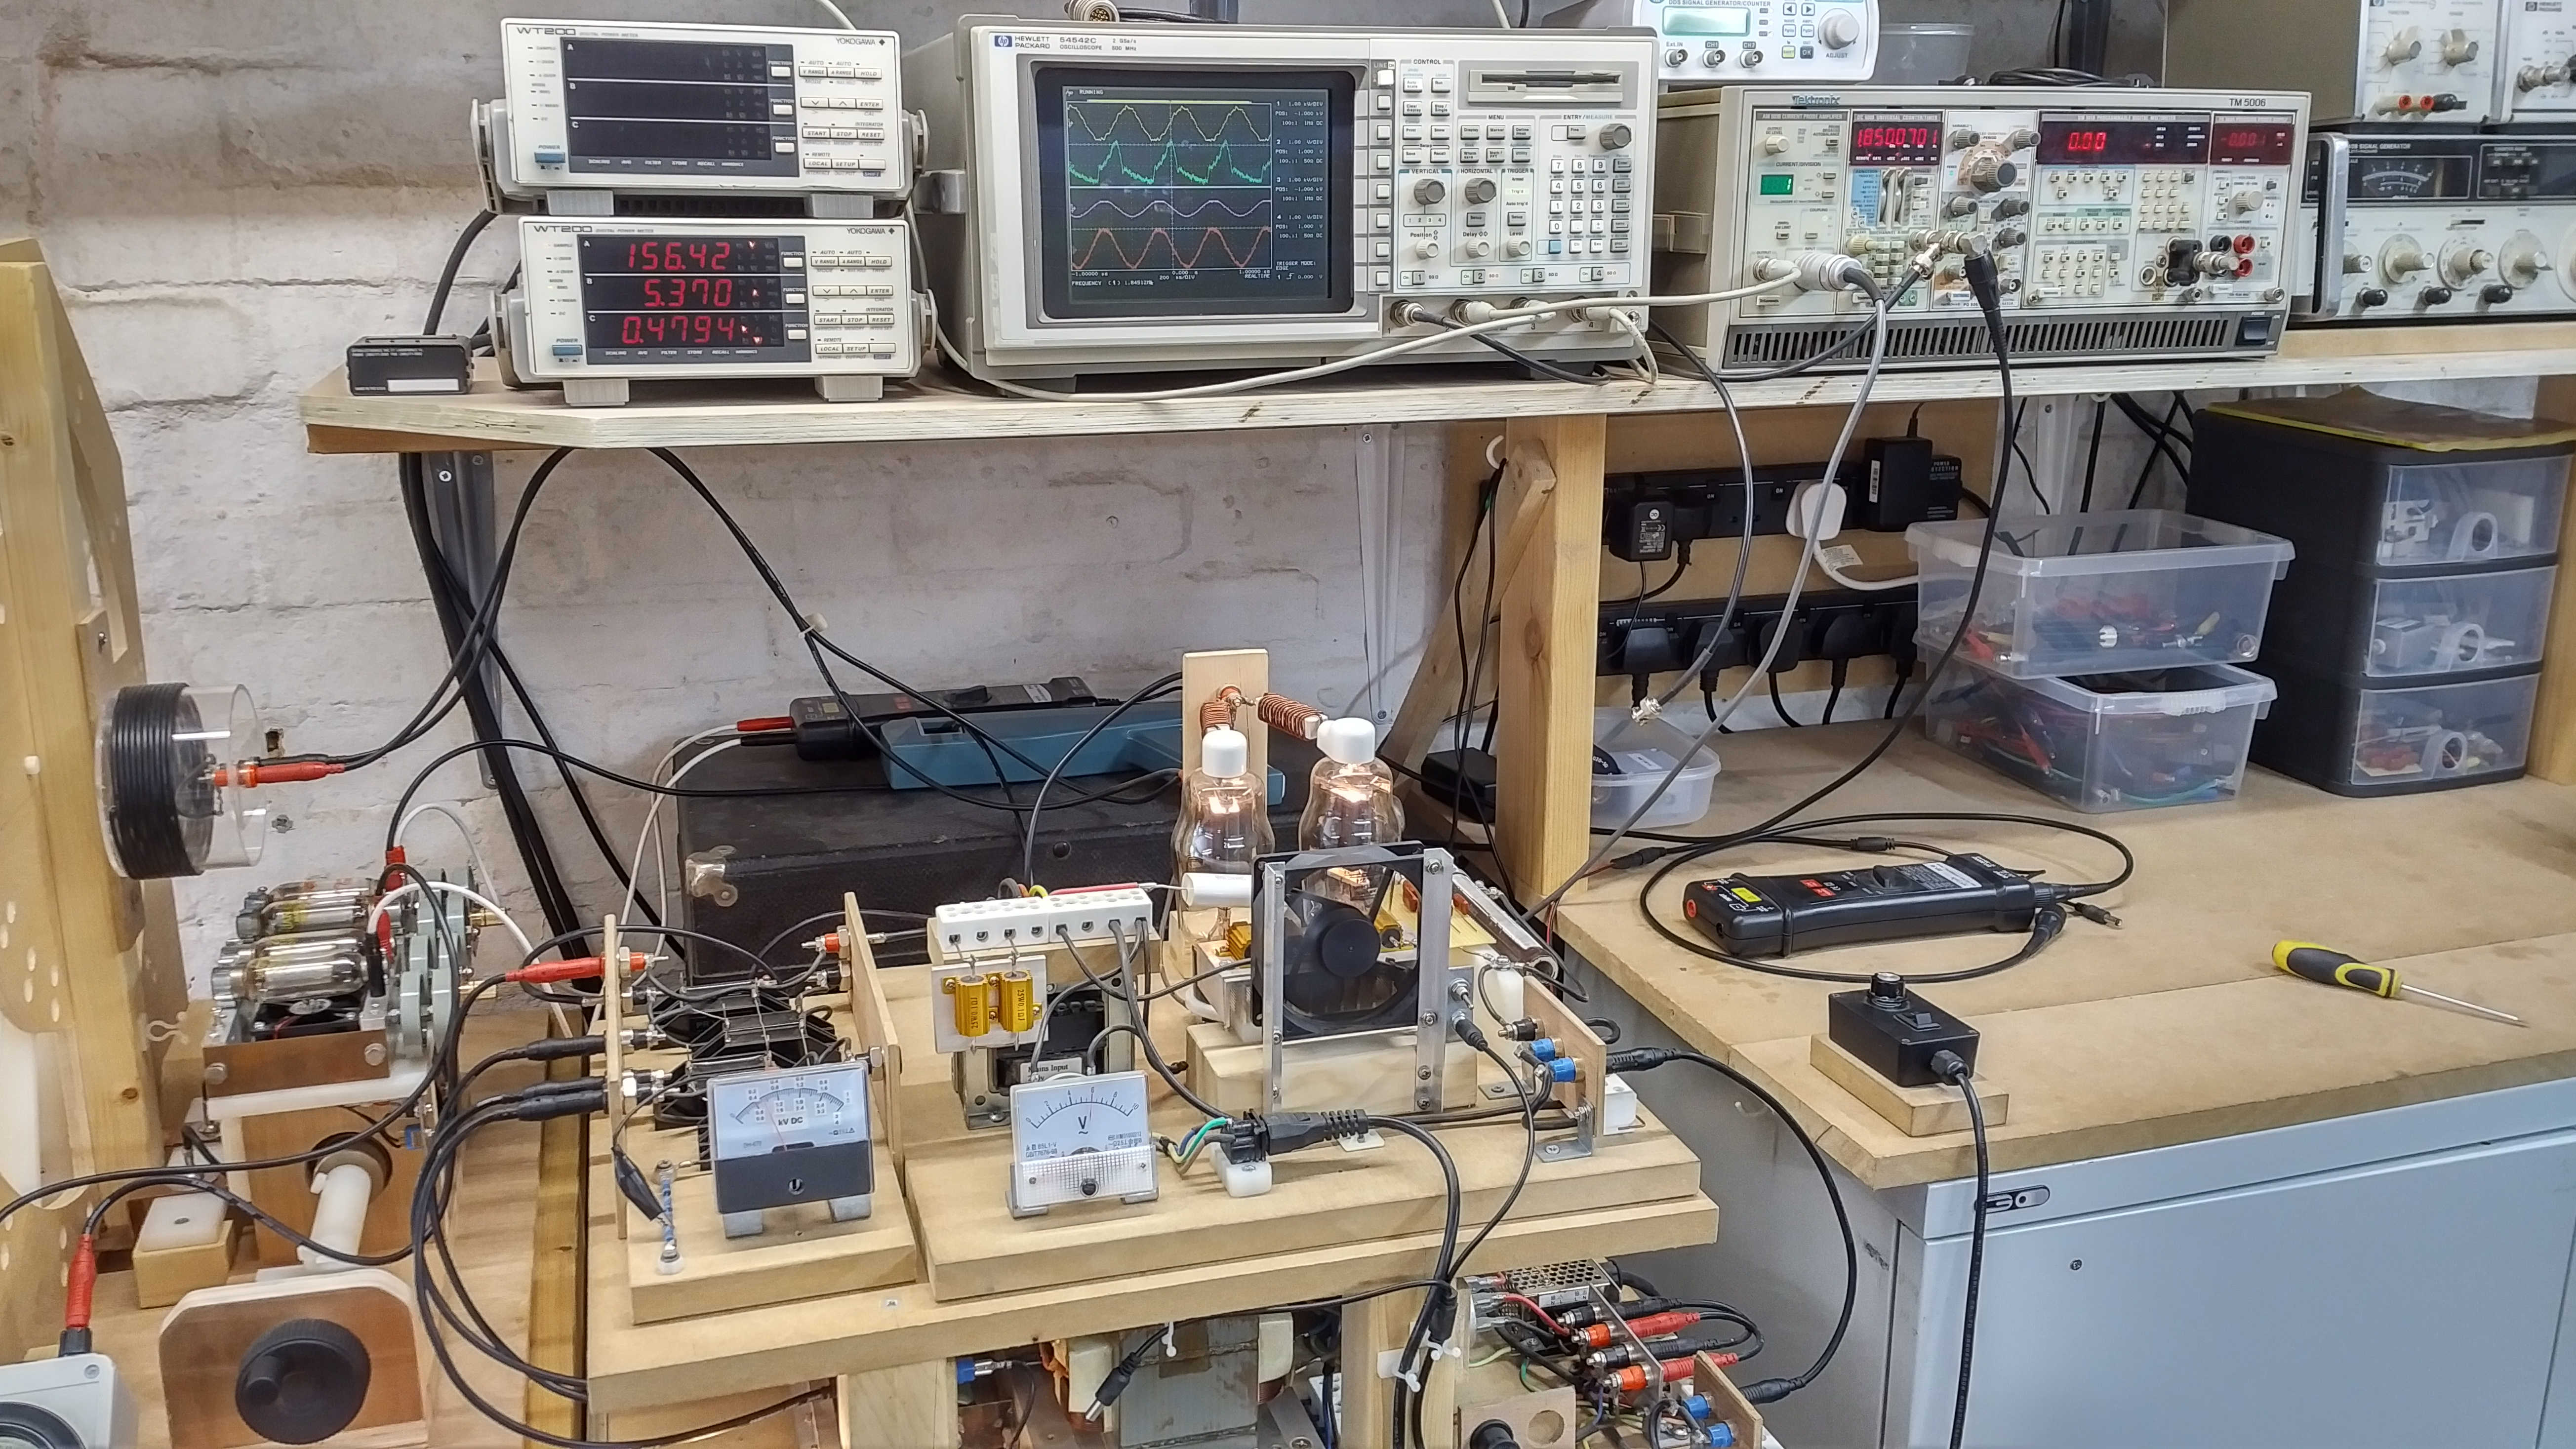
Fig 2.7. Shows the vacuum tube generator, primary measurement probes in the background, and the test equipment setup with PIN = 479W, the primary and secondary voltages and currents measured on the oscilloscope, and the measured oscillation frequency of the primary FP = 1.850Mc/s on the frequency counter.
Fig 2.8. Shows the spectral response of the emitted electric field in vicinity of the experimental setup and as measured by the Tektronix 7L5 spectrum analyser connected to a small whip antenna as shown in the bottom right of the picture. The spectral response shows a significant peak at ~1850kHz, and small possibly “artefact” peak at ~1950kHz.
Fig 2.9. Shows particularly the change in oscillation frequency measured in the primary circuit when the fly lead was removed from the output of the bulb load. The oscillation frequency of the experiment changes from ~1850kc/s to ~1860kc/s.
Figures 3. show the voltage and current waveforms for the primary and secondary and their phase relationship:


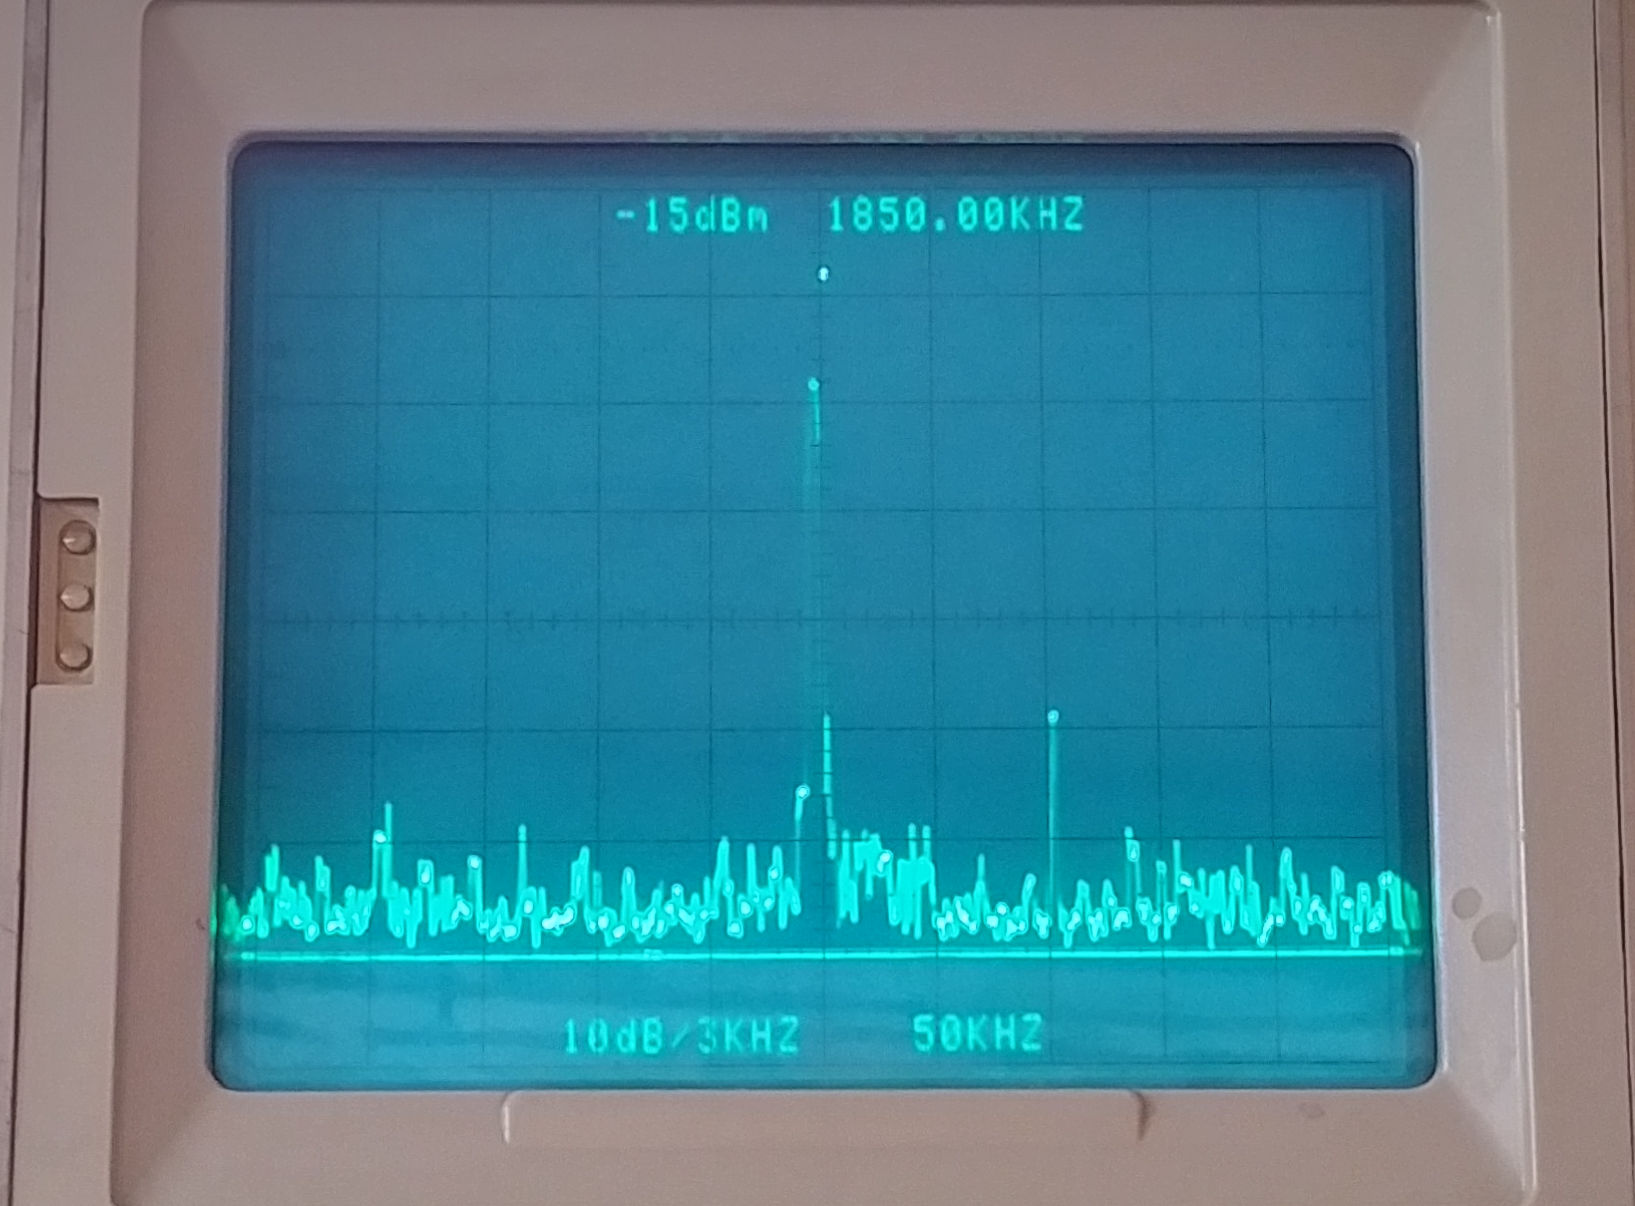
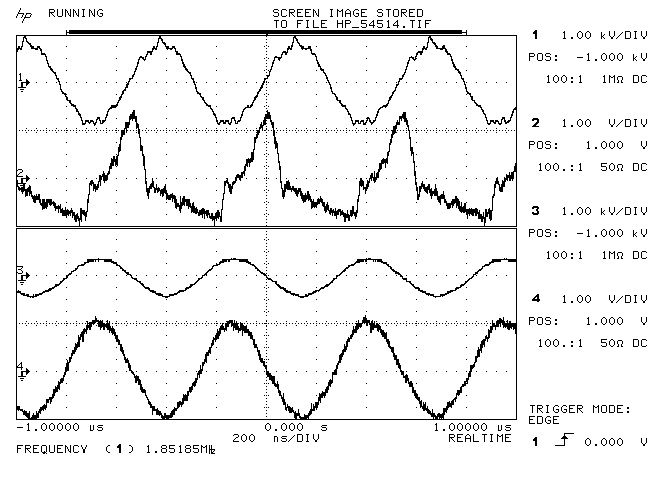
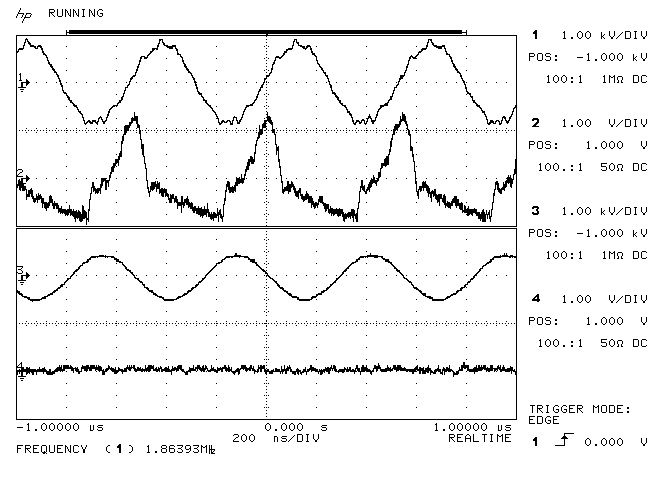

Fig 3.1. Shows the primary and secondary voltage and current measurements VP (trace 1) and IP (trace 2), and VS (trace 3) and IS (trace 4) respectively. VP is a sinusoidal oscillating voltage VPK-PK ~ 2kV. IP is more in the form of a pulsed current where the trace is calibrated 1V per amp and showing IPK-PK of ~ 2A. The phase of the current IP is leading VP by ~90° indicating that the generator appears to be driving a reactive load that is predominantly capacitive in a class-C amplifier arrangement. This is to be expected as the 180° phase change of the primary has been shown to exist at a much higher frequency than the impedance maximum for the primary would indicate. Operated in this way the primary and secondary are not at resonance simultaneously, the primary circuit is oscillating with a driven ac, whilst the secondary is acting as a free resonator at its tuned resonant frequency which determines the driven frequency in the primary.
As the voltage VP rises across the primary the current IP is maximum and falls rapidly as the primary capacitor CP is charged by the tank capacitor, on which that energy is released through the inductance of the primary coil reversing the current flow and discharging CP. This yields current pulses of sufficient magnitude for the magnetic field of induction to dominate and extend to the secondary coil. The secondary coil is not tightly coupled to the primary and so can reasonably resonate freely as the generator oscillates at a frequency determined by feedback from the secondary to the generator pick-up coil.
Using the VTG in cw mode it is important to note that the secondary is constantly being excited by the primary in a linear continuous fashion. There is no charge and discharge phase in the secondary as would occur in a burst or impulse driven primary. In this case the VTG is driving the flat coil in a very linear condition where the system operates at one set frequency, and the dominant majority of energy is conveyed at the fundamental resonant frequency, with very little contribution from harmonics. In this case we would expect phenomena that arise from the imbalance between the electric and magnetic fields of induction to be minimal, which is so far confirmed by measurement of single wire phenomena including deflection of conductive materials, and dc charging of capacitive loads.
The freely resonating secondary shows VP and IP which are in phase in traces 3 and 4, which is to be expected for a freely resonating coil driven with a very linear continuous wave. VS at the bottom-end or outer-end of the secondary coil is ~1kVPK-PK, and the current IP measured by the current probe prior to the load (as shown in Fig. 2.2) is ~ 2APK-PK (1V per amp calibrated on the current probe amplifier).
Fig 3.2. Shows the change in waveforms when the fly lead is removed from the end of the load, and the secondary current probe is connected through the fly lead. The frequency of oscillation has increased due to the reduced wire length in the experiment to ~1860kc/s (as measured by the frequency counter and spectrum analyser, rather than the marker frequency of the oscilloscope). The primary waveforms VP and IP remain largely the same in amplitude, phase, and form. The secondary voltage VS has increased as the effective load is reduced in the secondary, and IS has gone to zero as the fly lead, from which the current is being measured, has been disconnected from the output of the load. In this case the final load bulbs were not lighted, and the first load bulbs were lit only dimly with a significant reduction in ISRF.
Fig 3.3. Confirms the electric field detected in the vicinity of the experiment throughout the measurement period, where the pick-up whip antenna is located ~ 3m from the load bulbs.
To view the large images in a new window whilst reading the explanations click on the figure numbers below:
Figures 4. show the Z11 input impedance characteristics of the experimental apparatus:


To view the large images in a new window whilst reading the explanations click on the figure numbers below:
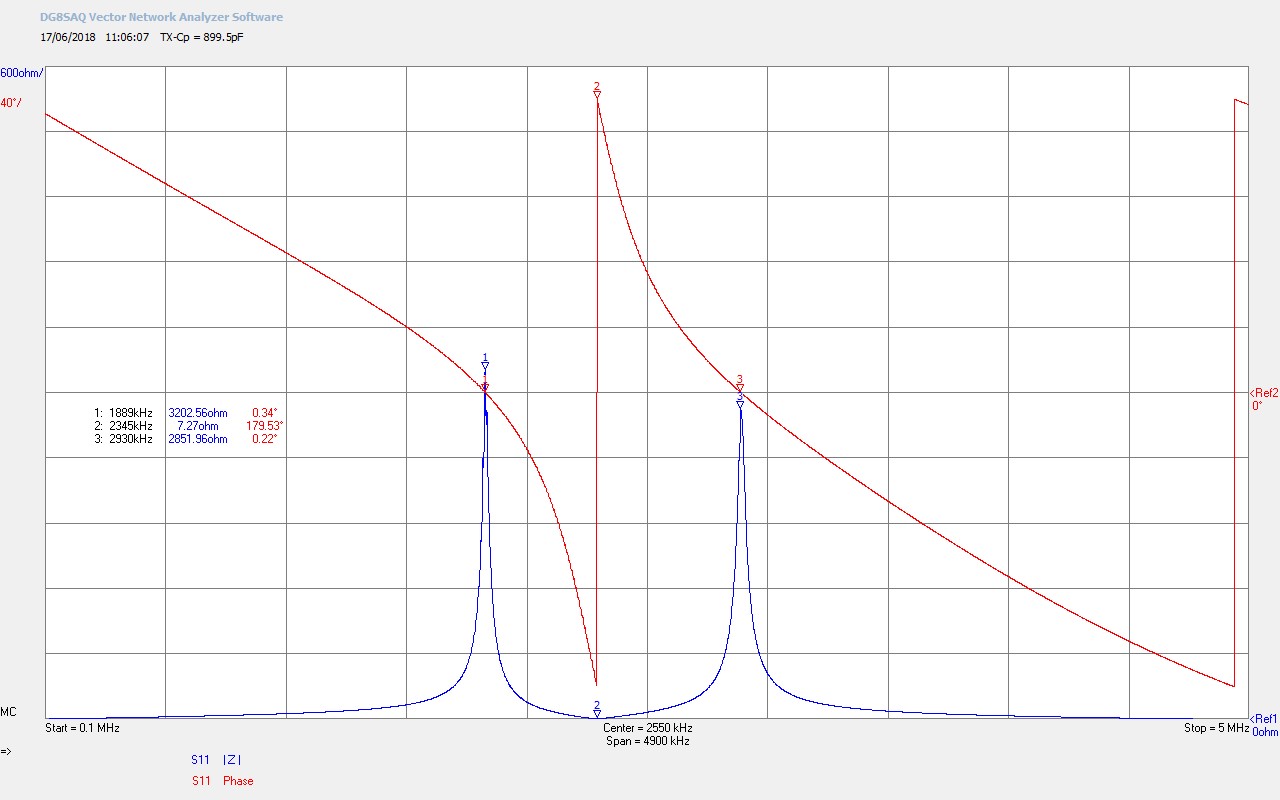
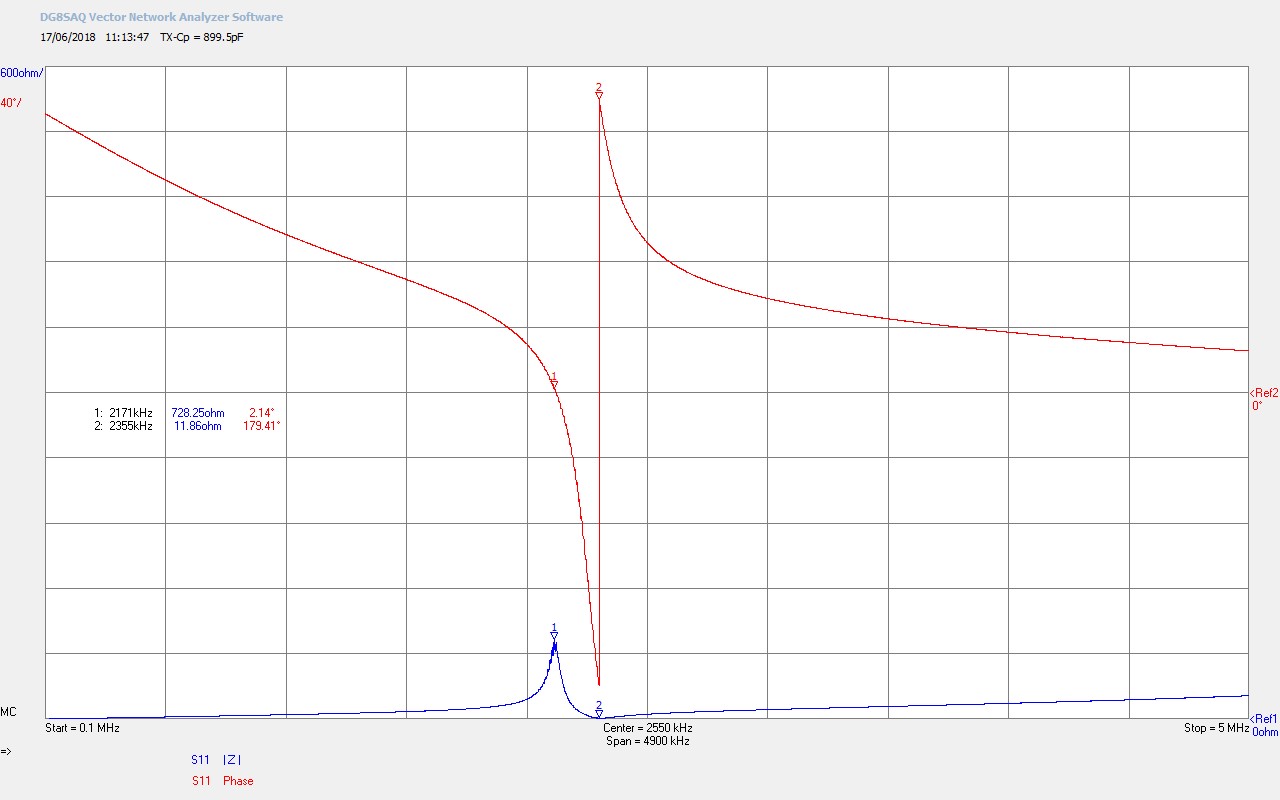
Fig 4.1. Shows the small signal input impedance Z11 as seen by the generator of the complete experimental apparatus with all measurement probes connected, and the fly lead connected at the output of the bulb load. The impedance characteristics show that the experiment tuning is operating very close to the balanced point between the lower and upper resonant frequency, FL and FU, of the flat coil. This is the point where there is expected to be best balance between the electric and magnetic fields of induction between the primary and the secondary coils, and in this case the best experimental starting point when investigating the displacement and transference of electric power through non-linear processes. FL measured when running the single wire current experiments was ~1850kc/s, and from the impedance characteristics 1889kc/s a variation of ~2%, and most likely due to differences between the small-signal and large-signal operation points of the flat coil, tuning components, and generator mode of operation (cw class-C).
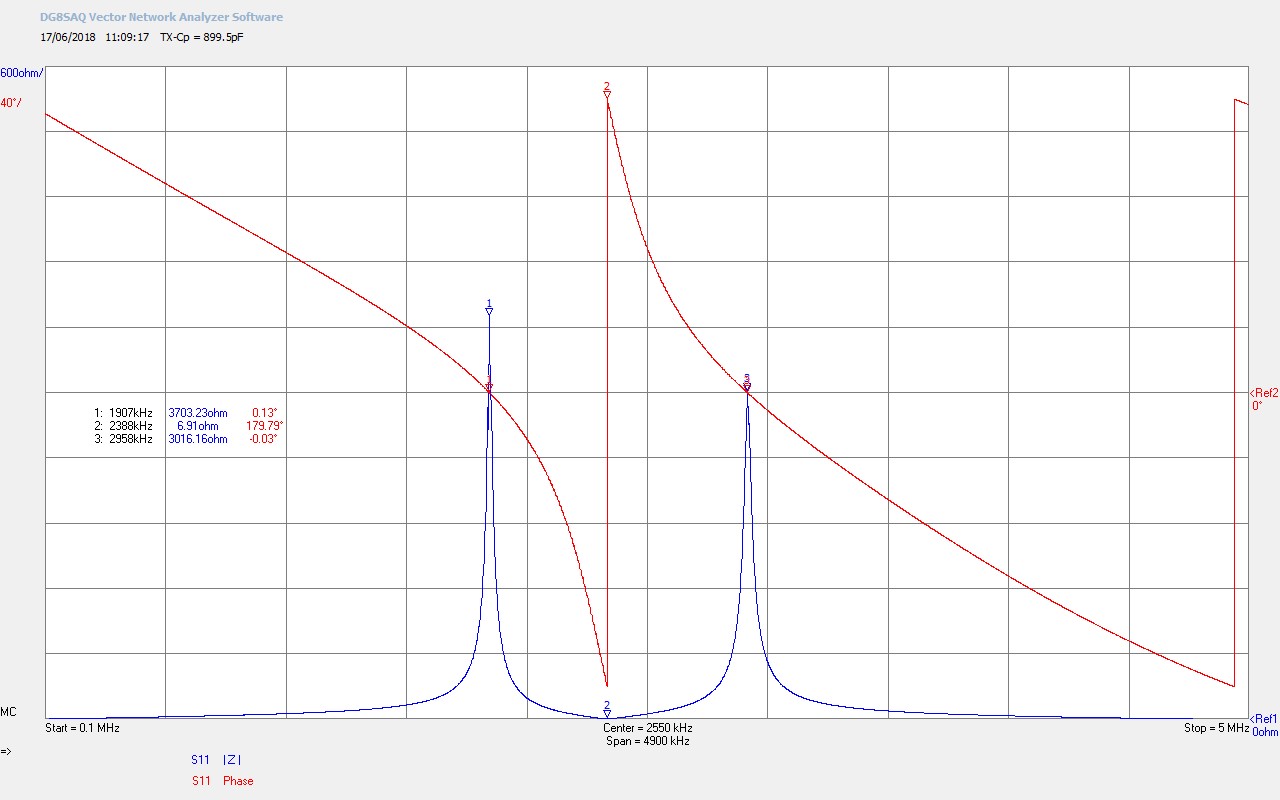
Fig 4.2. Shows the result of removing the fly lead the length of wire in the secondary section of the experiment has been reduced, and hence the frequency increased from ~1850kc/s to ~1860kc/s. This is also indicated by the impedance characteristics where the 180° phase change frequency FØ180 has shifted from 2345kc/s in Fig. 4.1 up to 2388kc/s. This has also created a greater imbalance between FL and FU.
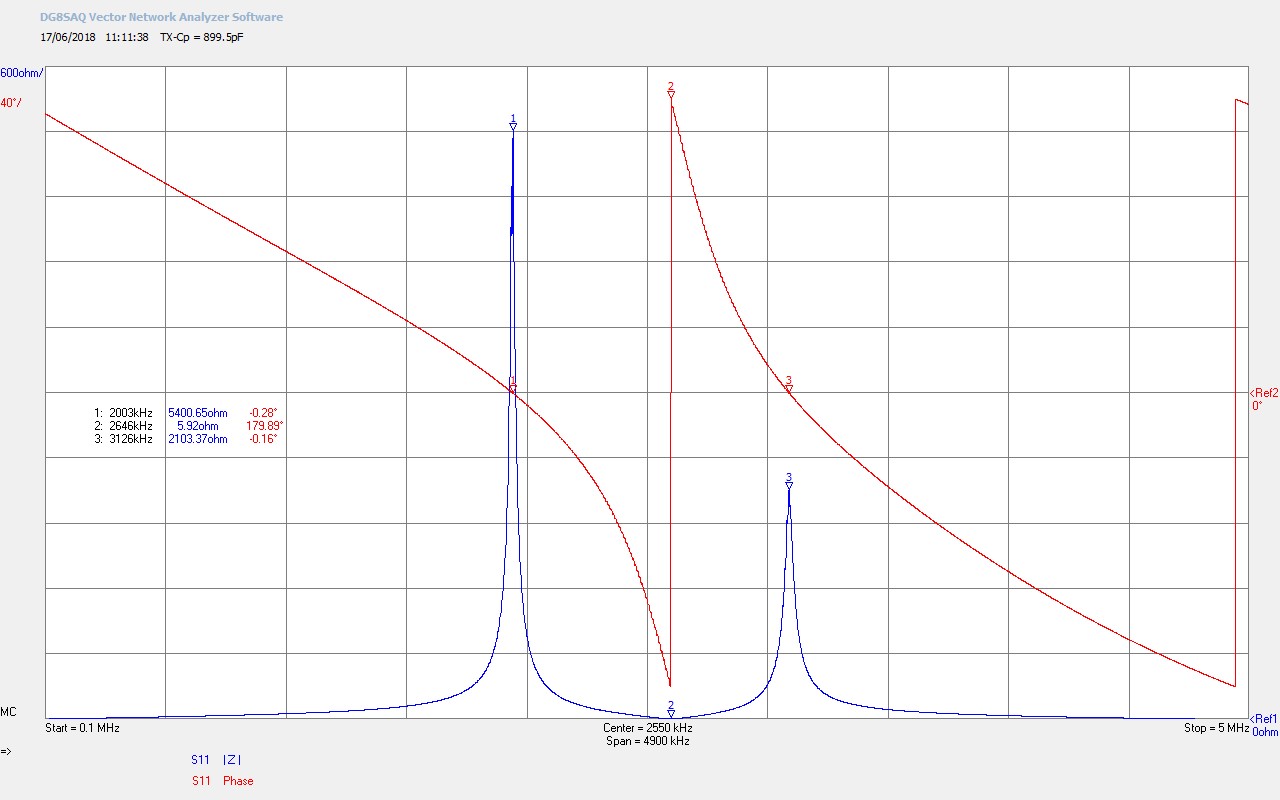
Fig 4.3. Shows the result of removing the experiment from the bottom-end or outer-end of the secondary coil. All frequencies are shifted up due to the change again in wire length, and also the change of impedance at the bottom-end from lower to higher, and away from the λ/4 mode.
Fig 4.4. With the primary capacitance CP removed the impedance characteristics of the experiment revert to the loaded properties of the secondary coil with a single resonant frequency, and there is no established balance between the electric and magnetic fields of induction between the primary and the secondary.
Summary of the results and conclusions so far:
1. Single wire currents have been observed and measured using a flat coil driven by a vacuum tube generator in cw mode. The current measured in the single wire, and its properties thus far observed, would appear to suggest that rf energy from the wire is escaping along its length to the surrounding environment which acts as an energy sink, ground, or -ve terminal, which then effectively completes the circuit. High energy rf as a result of the magnified voltage produced by the secondary coil, is easily radiated from all parts of the conductor that forms the wire through to the end of the fly lead. With this being the case, and with the voltage and current being in phase in the secondary, real power is generated to drive the load bulbs which emit both light and heat. With the fly lead removed the final load bulbs do not light as there is insufficient length of conductor to act as a suitable radiator or sink “to ground”. It is expected that any load connected to the end of the single wire will not be driven as there is insufficient energy sink on the output of the load to enable a current to be developed through the load. With this being the case the energy sink is distributed along the length of the wire so that the current along the wire would not be a constant value, as might be expected normally for the current flowing through a circuit. In part 2 of single wire currents it will be necessary to measure the magnitude and phase of the current along the wire length as a function of distributed load which would then allow a more accurate picture, and hence interpretation, of single wire current action in a circuit.
2. Standing waves were not observed or measured along the length of the single wire in this experiment, but rather the magnitude of the oscillating voltage appears to remain relatively constant along the length of wire, whilst the current reduces with load and distance along the wire. This will be further investigated in part 2 where a more accurate voltage and current distribution will be measured with wire length and load distribution.
3. A force applied to a conductive medium in close proximity to a load on the wire, in this case a lighted incandescent bulb filament, has been observed and investigated at first stage. The phenomena, at this stage, appears to result from a form of electric attraction between the filament of the bulb the emitter, and the conductive medium. The effect does not appear to be influenced by other close proximity magnetic fields such as permanent magnets, and electromagnets, which also suggests that the phenomena does not result from eddy currents generated in the conductive medium. A range of different materials have been tested, and all that show a significant attraction towards the load bulb, have a conductive element or property. The effect is also greatly amplified in the presence of a significant energy sink such as the hand of a person. In cw mode no discernible force could be registered on the surface of the hand when placed in close proximity to a load bulb. This has been subsequently demonstrated when driving the generator in burst or impulse mode and will be presented in detail in subsequent parts.
4. The impedance characteristics indicate that the complete experiment was operated in a well-balanced mode of the flat coil, which suggests a good starting point for further, and more detailed investigation, of the displacement and transference of electric power through non-linear events.
Click here to continue to Transference of Electric Power – Part 1.
1. A & P Electronic Media, AMInnovations by Adrian Marsh, 2019, EMediaPress
2. Dollard, E. and Energetic Forum Members, Energetic Forum, 2008 onwards.